
Network Pattern of Inter-Provincial Information Connection and Its Dynamic Mechanism in China:Based on Baidu Index
Received date: 2018-11-14
Revised date: 2019-03-27
Online published: 2025-04-17
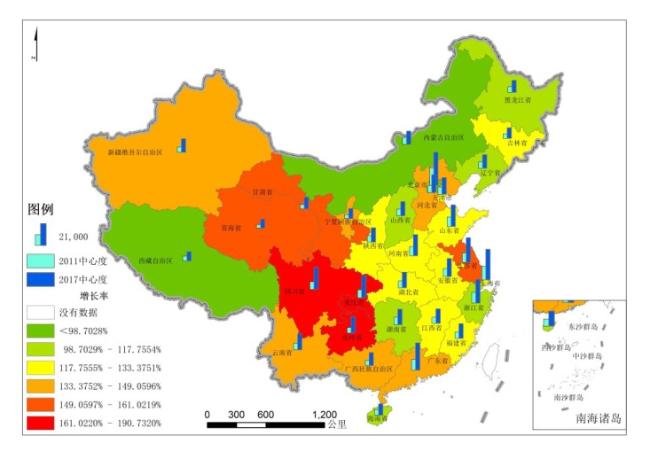
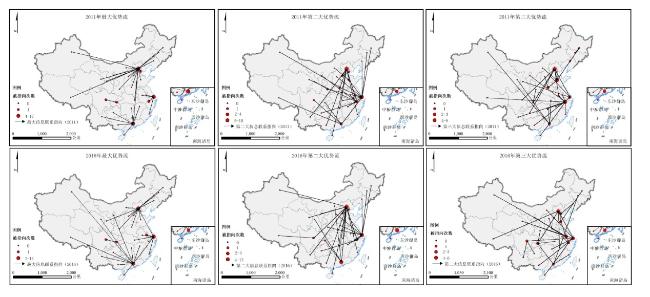
The rapid development of information and communication technologies has strengthened the links between regions. As one of the important ways of regional linkages, the information connection has been studied by the academic community on how to measure the linkages between regions. This paper takes the Baidu index mutual search between provinces as the basis of information connection between provinces and explores the network pattern and hierarchical structure of inter-provincial information connection utilizing the social network analysis. The main findings are as follows: 1) The strength of inter-provincial information connection increases significantly with time, and growth rate of information connection be in low intensity rank is relatively rapid in most provinces; 2) Information connection does not completely break away from the constraints of geographical space. The network pattern of inter-provincial information connection generally shows a decreasing trend in connection intensity from the east to the west. Most of the connection is stably concentrated in Beijing-Shanghai-Guangdong; 3) The inter-provincial information connection network presents a hierarchical structure of "1+2+7+7+14". Beijing has a strong degree of centrality and control force in information connection. Shanghai and Guangzhou are sub-cores. Jiangsu, Zhejiang, Shandong, Henan, Chongqing, and Sichuan are the important nodes in the inter-provincial information connection; 4) The information connection network among provinces has been comprehensively affected by various factors which are regional socio-economic development, information infrastructure construction, information technology application and regional education level.
YU Yang , SONG Zhouying , SHI Kunbo . Network Pattern of Inter-Provincial Information Connection and Its Dynamic Mechanism in China:Based on Baidu Index[J]. Economic geography, 2019 , 39(9) : 147 -155 . DOI: 10.15957/j.cnki.jjdl.2019.09.018
表1 信息联系网络形成的动力机制指标体系Tab.1 Indicators of dynamic mechanism on information connection |
| 目标层 | 影响因素 | 变量 | 单位 |
|---|---|---|---|
| 信息联系 网络形成 的动力机制 | 社会经济发展 | 地区总人口数 | 万人 |
| GDP | 元 | ||
| 基础设施建设 | 移动电话用户数量 | 万人 | |
| 计算机用户数量 | 万人 | ||
| 互联网平均带宽速率 | Mbit/s | ||
| 信息技术应用 | 互联网网站总数 | 个 | |
| IPV4地址数量 | 个 | ||
| 科技教育水平 | 成人受教育比重 | % | |
| R&D经费支出 | 亿元 |
表2 2011和2016年中国省域信息联系网络中心度和优势流分析结果Tab.2 Results of centrality degree and dominant flow of inter-provincial information connection network in China in 2011 and 2016 |
| 省份 | 2011年 | 2016年 | 层级 结构 | |||||||
|---|---|---|---|---|---|---|---|---|---|---|
| 中心度分析 度中心度 | 优势流分析 | 中心度分析 度中心度 | 优势流分析 | |||||||
| P1 | P2 | P3 | P1 | P2 | P3 | |||||
| 北京 | 22 827 | 17 | 7 | 5 | 42 884 | 11 | 13 | 4 | Ⅰ | |
| 上海 | 17 696 | 4 | 10 | 3 | 39 582 | 7 | 8 | 6 | Ⅱ | |
| 广东 | 14 198 | 6 | 3 | 3 | 35 216 | 10 | 3 | 2 | Ⅱ | |
| 浙江 | 14 114 | 1 | 4 | 8 | 30 734 | 0 | 2 | 3 | Ⅲ | |
| 江苏 | 12 331 | 0 | 1 | 0 | 31 918 | 1 | 1 | 6 | Ⅲ | |
| 山东 | 12 317 | 0 | 1 | 5 | 27 911 | 0 | 0 | 2 | Ⅲ | |
| 河南 | 11 817 | 0 | 1 | 2 | 27 385 | 0 | 0 | 0 | Ⅳ | |
| 重庆 | 10 612 | 1 | 0 | 1 | 28 942 | 1 | 0 | 3 | Ⅲ | |
| 安徽 | 10 240 | 0 | 0 | 1 | 23 314 | 0 | 0 | 0 | Ⅳ | |
| 四川 | 10 138 | 1 | 0 | 0 | 29 011 | 1 | 1 | 2 | Ⅲ | |
| 湖南 | 9 931 | 0 | 0 | 1 | 20 208 | 0 | 0 | 0 | Ⅳ | |
| 天津 | 9 639 | 1 | 1 | 0 | 21 660 | 0 | 1 | 2 | Ⅲ | |
| 河北 | 9 520 | 0 | 1 | 0 | 23 169 | 0 | 2 | 1 | Ⅲ | |
| 湖北 | 8 866 | 0 | 1 | 0 | 20 140 | 0 | 0 | 0 | Ⅳ | |
| 内蒙古 | 8 849 | 0 | 0 | 0 | 17 234 | 0 | 0 | 0 | Ⅴ | |
| 山西 | 8 785 | 0 | 0 | 0 | 18 258 | 0 | 0 | 0 | Ⅴ | |
| 云南 | 8 501 | 0 | 0 | 0 | 20 919 | 0 | 0 | 0 | Ⅴ | |
| 辽宁 | 8 438 | 0 | 0 | 1 | 17 684 | 0 | 0 | 0 | Ⅳ | |
| 陕西 | 8 383 | 0 | 1 | 0 | 18 529 | 0 | 0 | 0 | Ⅳ | |
| 福建 | 8 178 | 0 | 0 | 0 | 19 007 | 0 | 0 | 0 | Ⅴ | |
| 江西 | 7 982 | 0 | 0 | 0 | 18 628 | 0 | 0 | 0 | Ⅴ | |
| 贵州 | 7 240 | 0 | 0 | 0 | 21 049 | 0 | 0 | 0 | Ⅴ | |
| 黑龙江 | 7 164 | 0 | 0 | 1 | 15 515 | 0 | 0 | 0 | Ⅳ | |
| 新疆 | 7 018 | 0 | 0 | 0 | 17 479 | 0 | 0 | 0 | Ⅴ | |
| 海南 | 6 922 | 0 | 0 | 0 | 14 626 | 0 | 0 | 0 | Ⅴ | |
| 广西 | 6 764 | 0 | 0 | 0 | 16 828 | 0 | 0 | 0 | Ⅴ | |
| 吉林 | 6 087 | 0 | 0 | 0 | 13 772 | 0 | 0 | 0 | Ⅴ | |
| 西藏 | 5 936 | 0 | 0 | 0 | 11 795 | 0 | 0 | 0 | Ⅴ | |
| 甘肃 | 5 908 | 0 | 0 | 0 | 14 978 | 0 | 0 | 0 | Ⅴ | |
| 宁夏 | 5 192 | 0 | 0 | 0 | 12 740 | 0 | 0 | 0 | Ⅴ | |
| 青海 | 4 423 | 0 | 0 | 0 | 11 545 | 0 | 0 | 0 | Ⅴ | |
注:P1:被最大优势流指向次数;P2:被第二大优势流指向次数;P3:被第三大优势流指向次数;Ⅰ:极节点;Ⅱ:核心节点;Ⅲ区域核心节点;Ⅳ区域节点;Ⅴ从属节点。 |
表3 2016年中国省域信息联系网络凝聚子群密度表Tab.3 The density of the inter-provincial information connection between subgroups of China in 2016 |
| 1 | 2 | 3 | 4 | 5 | 6 | 7 | 8 | |
|---|---|---|---|---|---|---|---|---|
| 1 | 2 101.333 | 966.833 | 838.444 | 1 380.167 | 714.810 | 808.500 | 1 084.333 | 943.600 |
| 2 | 966.833 | 600.000 | 478.000 | 769.000 | 455.286 | 495.667 | 675.833 | 617.000 |
| 3 | 838.444 | 478.000 | 463.333 | 608.833 | 427.048 | 463.722 | 587.556 | 501.400 |
| 4 | 1 380.167 | 769.000 | 608.833 | 1 302.000 | 758.786 | 827.833 | 1 310.667 | 926.100 |
| 5 | 714.810 | 455.286 | 427.048 | 758.786 | 396.143 | 509.238 | 891.333 | 715.000 |
| 6 | 808.500 | 495.667 | 463.722 | 827.833 | 509.238 | 724.600 | 916.944 | 938.700 |
| 7 | 1 084.333 | 675.833 | 587.556 | 1 310.667 | 891.333 | 916.944 | 1 603.667 | 943.667 |
| 8 | 943.600 | 617.000 | 501.400 | 926.100 | 715.000 | 938.700 | 943.667 | 872.800 |
表4 中国省域间信息联系网络驱动机制分析Tab.4 The driving mechanism analysis of inter-provincial information connection in China |
| 驱动因素 | 指标 | 因变量(2011中国省域信息联系网络) | 因变量(2016中国省域信息联系网络) | |||
|---|---|---|---|---|---|---|
| QAP相关分析 | QAP回归 | QAP相关分析 | QAP回归 | |||
| 社会经济发展 | 地区总人口数 | 0.285* | 0.097** | 0.419** | 0.301 | |
| GDP | 0.472** | 0.466* | 0.587*** | -0.330 | ||
| 基础设施建设 | 移动电话拥有人数 | 0.415** | -0.458* | 0.536*** | 1.275* | |
| 计算机拥有人数 | 0.425** | 0.892* | 0.498*** | -1.438* | ||
| 互联网平均带宽速率 | 0.731*** | 0.049 | 0.515*** | 0.248* | ||
| 信息技术应用 | 互联网网站总数 | 0.723*** | 0.070* | 0.656*** | 0.388* | |
| IPV4地址数量 | 0.721*** | 0.129* | 0.505** | 0.206 | ||
| 科技教育水平 | 受教育比重 | 0.302** | 4.300 | 0.279** | 0.046 | |
| R&D经费支出 | 0.655*** | -3.403 | 0.670*** | 0.343* | ||
| R2 | 0.659 | 0.629 | ||||
| 调整后R2 | 0.655 | 0.626 | ||||
注:*表示在0.05显著性水平下通过检验;**表示在0.01显著性水平下通过检验;***表示在0.001显著性水平下通过检验。 |
| [1] |
|
| [2] |
|
| [3] |
宋周莺, 刘卫东. 中国信息化发展进程及其时空格局分析[J]. 地理科学, 2013, 33(3):257-265.
|
| [4] |
|
| [5] |
|
| [6] |
|
| [7] |
|
| [8] |
|
| [9] |
|
| [10] |
|
| [11] |
刘卫东, 甄峰. 信息化对社会经济空间组织的影响研究[J]. 地理学报, 2004, 59(Sup):67-76.
|
| [12] |
宋周莺, 丁疆辉, 刘卫东, 等. 信息技术对中国服装企业空间组织的影响[J]. 地理学报, 2009, 64(4):435-444.
|
| [13] |
丁疆辉, 刘卫东. 信息技术应用对农村居民行为空间的影响——以河北省无极县为例[J]. 地理研究, 2012, 31(4):733-744.
|
| [14] |
胡宇娜, 梅林, 陈妍. 中国5A级旅游景区网站质量测度及空间特征研究[J]. 地理科学, 2016, 36(4):548-554.
|
| [15] |
史坤博, 杨永春, 杨欣傲, 等. 时间成本是否成为电子商务区位的核心因子:基于成都市O2O电子商务的实证分析[J]. 地理学报, 2016, 71(3):500-514.
|
| [16] |
席广亮, 甄峰, 魏宗财, 等. 南京市居民移动信息化水平及其影响因素研究[J]. 经济地理, 2012, 32(9):97-103.
|
| [17] |
余金艳, 刘卫东, 王亮. 基于时间距离的C2C电子商务虚拟商圈分析:以位于北京的淘宝网化妆品零售为例[J]. 地理学报, 2013, 68(10):1 380-1 388.
|
| [18] |
甄峰, 刘晓霞, 刘慧. 信息技术影响下的区域城市网络:城市研究的新方向[J]. 人文地理, 2007, 22(2):76-80.
|
| [19] |
|
| [20] |
|
| [21] |
巴凯斯, 路紫. 从地理空间到地理网络空间的变化趋势:论西方学者关于电信对地区影响的研究[J]. 地理学报, 2000, 55(1):104-110.
|
| [22] |
汪明锋, 宁越敏. 城市的网络优势:中国互联网骨干网络结构与节点可达性分析[J]. 地理研究, 2006, 25(2):193-203.
|
| [23] |
孙中伟, 路紫, 贺军亮. 世界互联网信息流的空间格局及其组织机理[J]. 人文地理, 2009, 24(4):43-49.
|
| [24] |
甄峰, 王波, 陈映雪. 基于网络社会空间的中国城市网络特征——以新浪微博为例[J]. 地理学报, 2012, 67(8):1 031-1 043.
|
| [25] |
赵映慧, 谌慧倩, 远芳, 等. 基于QQ群网络的东北地区城市联系特征与层级结构[J]. 经济地理, 2017, 37(3):49-54.
|
| [26] |
王宁宁, 陈锐, 赵宇. 基于信息流的互联网信息空间网络分析[J]. 地理研究, 2016, 35(1):137-147.
|
| [27] |
王宁宁, 陈锐, 赵宇, 等. 中国省域信息空间研究以及巴尔干现象分析[J]. 经济地理, 2016, 36(3):17-24.
|
| [28] |
熊丽芳, 甄峰, 王波, 等. 基于百度指数的长三角核心区城市网络特征研究[J]. 经济地理, 2013, 33(7):67-73.
|
| [29] |
蒋大亮, 孙烨, 任航, 等. 基于百度指数的长江中游城市群城市网络特征研究[J]. 长江流域资源与环境, 2015, 24(10):1 654-1 664.
|
| [30] |
赵映慧, 李佳谣, 郭晶鹏. 基于百度指数的成渝城市群网络联系格局研究[J]. 地域研究与开发, 2017, 36(4):55-59,129.
|
| [31] |
王宁宁, 赵宇, 陈锐. 基于辐射模型的城市信息空间关联复杂网络研究[J]. 经济地理, 2015, 35(4):76-83.
|
| [32] |
刘军. 整体网分析讲义:UCINET 软件实用指南[M]. 上海: 上海人民出版社, 2007.
|
/
| 〈 |
|
〉 |

