
Analysis of Spatial-Temporal Evolution of Special Economic Zones in India
Received date: 2019-02-20
Revised date: 2019-09-06
Online published: 2025-04-17
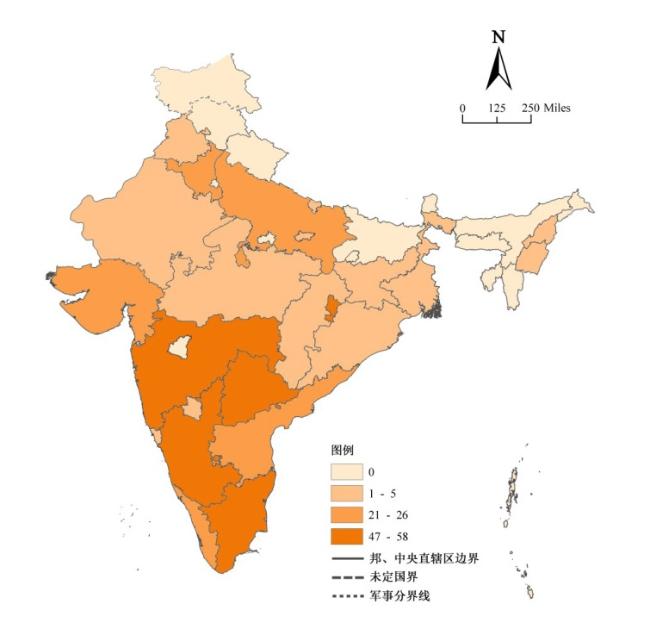
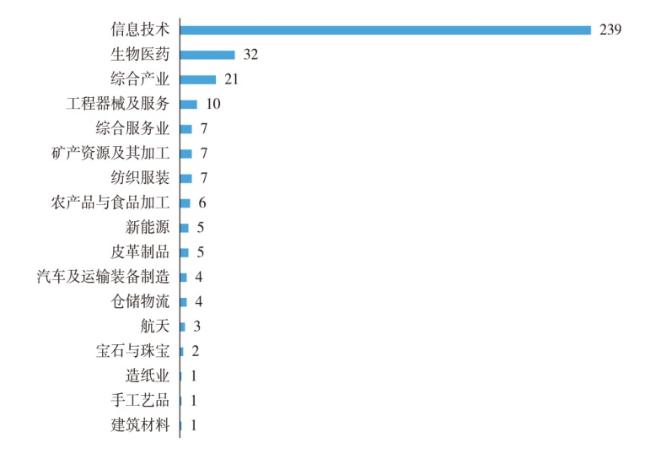
Taking 640 cities across India as research subject, this study employs Exploratory Spatial Data Analysis(ESDA) to analyze and discuss the spatial-temporal evolution and influencing factors of Special Economic Zones from 2006-2018. The result shows that: 1) The spatial agglomeration of Special Economic Zones in India has been strengthened first and then weakened, and the overall agglomeration situation has been strengthened; 2) Special Economic Zones in India are dominated by information technology, bio-pharmaceutical and multi-product industries, and the three major industries present different patterns of spatial differentiation; 3) The spatial cluster of Special Economic Zones in India can be divided into high level regional type (high-high) and type of polarization (high-low); 4) Cold spots and hot spots of the Special Economic Zones in India distribute stably, showing the “hot south and cold northeast” on the whole, the core area of distribution of Special Economic Zones lies in the south region, while northeast region belongs to the cold spots; 5) Natural conditions and the labour factor endowment, the level of regional economic development, infrastructure conditions and scientific and technological facilities are the influencing factors, leading to the spatial and temporal differentiation of Special Economic Zones.
GAO Shuxin , WANG Xingping . Analysis of Spatial-Temporal Evolution of Special Economic Zones in India[J]. Economic geography, 2019 , 39(11) : 9 -17 . DOI: 10.15957/j.cnki.jjdl.2019.11.002
表1 印度经济特区主导产业概况Tab.1 The leading industries of Special Economic Zones of in India |
| 产业类型 | 主导产业门类 |
|---|---|
| 第二产业 | 农产品加工、航空型生产、汽车及配件、矿物、金属制品、制药/化学品、建筑产品、运输设备、陶瓷和玻璃、电子产品、鞋类皮革、食品加工、宝石和珠宝、手工艺品和地毯、氧化铝/铝、轻型工程、冶金工程、石油化工、石油和天然气、基于端口的多产品、电力/替代能源/太阳能、纺织品/服装/羊毛制品、造纸和印刷业、花岗岩加工业、机械制造、电子硬件 |
| 第三产业 | IT、软件开发、电信、动漫、游戏、工程设计、仓储物流服务、综合服务 |
资料来源:依据参考文献[18]整理。 |
表2 印度经济特区产业分类Tab.2 The classification of Industries of Special Economic Zones |
| 经济特区类型 | 产业分类 |
|---|---|
| 二产主导型 | 生物医药、皮革制品、造纸业、纺织服装、农产品与食品加工、矿产资源及其加工、新能源、汽车及运输装备制造、航天、宝石与珠宝、手工艺、建筑材料 |
| 三产主导型 | 仓储物流、综合服务 |
| 产业融合型 | 工程器械及服务、信息技术、综合产业 |
表3 印度经济特区的全局Moran's I估计值Tab.3 Estimates of Global Moran's I for Special Economic Zones in India |
| 年份 | Moran’s I | Z值 | P值 |
|---|---|---|---|
| 2006 | 0.019 | 3.889 | 0.000 |
| 2007 | 0.025 | 5.003 | 0.000 |
| 2008 | 0.029 | 5.596 | 0.000 |
| 2009 | 0.034 | 6.460 | 0.000 |
| 2010 | 0.038 | 7.014 | 0.000 |
| 2011 | 0.039 | 7.243 | 0.000 |
| 2012 | 0.038 | 7.091 | 0.000 |
| 2013 | 0.039 | 7.164 | 0.000 |
| 2014 | 0.039 | 7.229 | 0.000 |
| 2015 | 0.038 | 7.061 | 0.000 |
| 2016 | 0.037 | 6.912 | 0.000 |
| 2017 | 0.030 | 6.007 | 0.000 |
| 2018 | 0.030 | 5.890 | 0.000 |
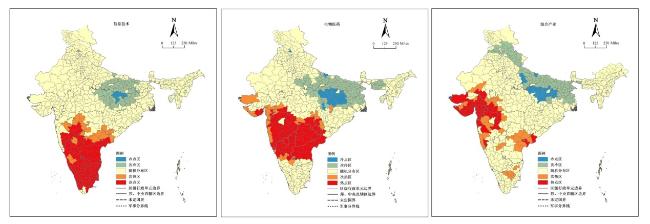
图6 信息技术行业、生物医药、综合产业热点分析Fig.6 Getis-Ord for the information technology industry, bio-pharmaceutical industry, multi-produce industry |
表4 影响因素的相关指标Tab.4 Related indexes of influencing factors |
| 要素类型 | 指标 | 指标描述 | 单位 |
|---|---|---|---|
| 自然环境条件 | 建设适宜性 | 地震低风险区面积比例 | % |
| 低风速区面积比例 | % | ||
| 洪水危险区面积比例 | % | ||
| 经济发展格局 | 经济水平 | GDP | 亿卢比 |
| 人均GDP | 卢比 | ||
| 工业水平 | 工厂数量 | 家 | |
| 工业投资资本 | 万卢比 | ||
| 工业增加值 | 万卢比 | ||
| 劳动力要素禀赋 | 劳动力人口 | 总人口 | 千万 |
| 农村劳动力参与率 | % | ||
| 城市劳动力参与率 | % | ||
| 城镇化水平 | 城镇化率 | % | |
| 劳动力成本 | 最低工资 | 卢比/天 | |
| 教育水平 | 识字率 | % | |
| 基础设施条件 | 交通设施水平 | 公路密度 | km/100 km2 |
| 平均每天的国内航班数 | 班次 | ||
| 平均每天的国际航班数 | 班次 | ||
| 港口总数 | 个 | ||
| 主要港口数 | % | ||
| 能源设施水平 | 工业发电量 | GWh | |
| 无线网用户 | 万人 | ||
| 科技设施条件 | 高等学校资源 | 大学数量 | 所 |
| 专科学校数量 | 所 | ||
| 独立机构资源 | 独立理工学院 | 所 | |
| 独立管理学院 | 所 | ||
| 科研水平 | 专利申请数量 | 个 |
表5 各项指标与经济特区数量的相关性分析结果Tab.5 Results of the analysis of correlation between the number of indexes and Special Economic Zones |
| 指标 | 相关性 | 显著性(双尾) |
|---|---|---|
| 地震低风险区面积比例 | 0.460** | 0.002 |
| 低风速区面积比例 | 0.211 | 0.216 |
| 洪水危险区面积比例 | 0.014 | 0.934 |
| GDP | 0.773** | 0.000 |
| 人均GDP | 0.046 | 0.804 |
| 城镇化率 | 0.024 | 0.892 |
| 总人口 | 0.384* | 0.023 |
| 农村劳动力参与率 | 0.347* | 0.041 |
| 城市劳动力参与率 | 0.042 | 0.809 |
| 城镇化率 | 0.024 | 0.892 |
| 最低工资 | -0.355* | 0.034 |
| 识字率 | -0.043 | 0.808 |
| 工厂数量 | 0.876** | 0.000 |
| 工业投资资本 | 0.823** | 0.000 |
| 工业增加值 | 0.892** | 0.000 |
| 公路网密度 | -0.147 | 0.399 |
| 平均每天的国内航班数 | 0.651** | 0.000 |
| 平均每天的国际航班数 | 0.504** | 0.004 |
| 港口总数 | 0.617** | 0.000 |
| 主要港口数 | 0.652** | 0.000 |
| 工业用电量 | 0.771** | 0.000 |
| 无线网用户 | 0.588** | 0.004 |
| 大学数量 | 0.612** | 0.000 |
| 专科学校数量 | 0.628** | 0.000 |
| 独立理工学院 | 0.684** | 0.005 |
| 独立管理学院 | 0.455** | 0.000 |
| 专利申请数量 | 0.776** | 0.000 |
注:*在0.05级别(双尾),相关性显著;**在0.01级别(双尾),相关性显著。 |
| [1] |
孟广文. 自由经济区演化模式及对天津滨海新区的启示[J]. 地理学报, 2009, 64(12):1 499-1 512.
|
| [2] |
钟坚. 印度出口加工区的设立背景、基本概况及评估[J]. 世界经济性特区, 2000(1):38-41.
|
| [3] |
谢文清. 中国印度自由贸易区发展比较研究[D]. 海口: 海南大学, 2015.
|
| [4] |
李艳芳, 范力丹. 印度软件科技园发展的原因及启示[J]. 南亚研究, 2013(1):114-126.
|
| [5] |
王雪, 孟广文, 隋娜娜. 印度自由经济区的发展类型及启示[J]. 世界地理研究, 2017(1):22-31.
|
| [6] |
|
| [7] |
谈玉妮, 周琦. 印度经济特区模式研究[J]. 中国经济特区研究, 2013:11-18.
|
| [8] |
文富德. 印度加速经济特区建设的政策措施及成效研究[J]. 四川大学学报:哲学社会科学版, 2006(4):117-122.
|
| [9] |
牛旻昱. 印度经济特区的发展历史及其启示[J]. 技术经济与管理研究, 2013(3):103-107.
|
| [10] |
|
| [11] |
Moberg, Lotta. The political economy of special economiczones[J]. Journal of Institutional Economics, 2015, 11(1):167-190.
|
| [12] |
Alkon, Meir. Do special economic zones induce developmentalspillovers?Evidence from India's states[J]. World Development, 2018, 107:396-409.
|
| [13] |
|
| [14] |
|
| [15] |
|
| [16] |
张雷. 印度经济特区建设的历程及绩效评析[J]. 亚非纵横, 2011(2):33-39.
|
| [17] |
张雷. 基于SWOT分析的印度经济特区发展研究[J]. 商业研究, 2011(7):145-149.
|
| [18] |
List of Notified SEZs set up under SEZs Act,2005 as on01.12.2017[EB/OL]. http://sezindia.nic.in/index.php,2019-03-30
|
| [19] |
Ministry of Stataistics and Programme Implementation,Gov-ernment of India[EB/OL]. http://mospi.gov.in/#,2019-03-30
|
| [20] |
潘竟虎, 尹君. 中国地级及以上城市发展效率差异的DEA-ESDA测度[J]. 经济地理, 2012, 32(12):53-60.
|
| [21] |
徐建华. 计量地理学[M]. 北京: 高等教育出版社, 2006.
|
| [22] |
|
| [23] |
|
| [24] |
|
/
| 〈 |
|
〉 |
