
Dynamics and Mechanisms of the Spatial Structure of Urban Network in China:A Study Based on the Corporate Networks of Top 500 Public Companies
Received date: 2019-01-28
Revised date: 2019-04-25
Online published: 2025-04-17
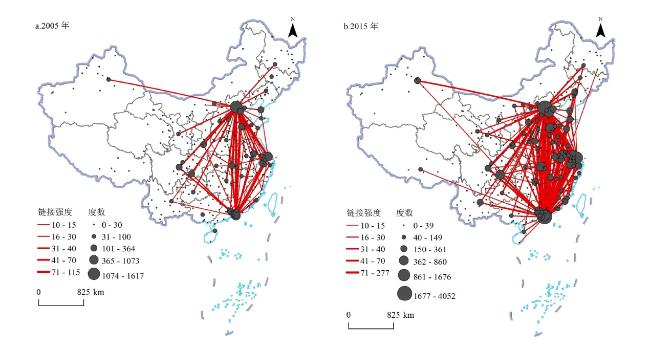
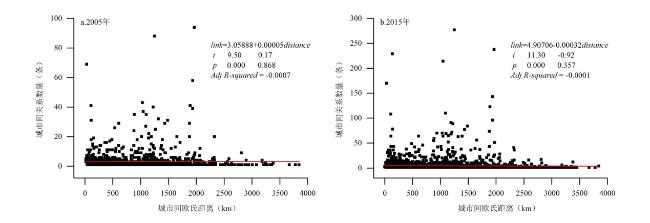
Over the past few years, fragmentation of production has renewed interest in the place and role of cities within regional economic system. Through the lens of corporate network of China’s top 500 public companies in 2016, the evolution characteristics and its mechanisms of the spatial structure of urban network from 2005 to 2015 were examined. Three conclusions are drawn. First, the degree of city linkage in China has been significantly enhanced, but the network relationship exhibits obvious spatial orientation, path dependence and hierarchical structure characteristics, which leads to the evolution of the spatial structure presenting a "core-periphery" mode. Second, economic scale, political status, knowledge capital and network facilities have significantly positive effects on network structure evolution, outdegree activity, indegree popularity and outdegree popularity have profound effects on degree centrality evolution, and reciprocity, 2-paths, transitive triplets and the link patterns formed in history are also important factors influencing network links. Third, preferred linkage, network closure and network proximity, which can be interpreted the observable results of sharing key resources and reducing transaction costs in production fragmentation, are the basic dynamic mechanisms, while the path dependence mechanism, stemming from the agglomeration economy in the location selection of enterprise value chain, tends to strengthen the urban network pattern formed historically. This paper will deepen the understanding of the evolution law of urban network, and provide scientific reference for the adjustment of urbanization policy and urban governance system in China under the network development environment.
SHENG Kerong , WANG Yunjing , FAN Jie . Dynamics and Mechanisms of the Spatial Structure of Urban Network in China:A Study Based on the Corporate Networks of Top 500 Public Companies[J]. Economic geography, 2019 , 39(11) : 84 -93 . DOI: 10.15957/j.cnki.jjdl.2019.11.011
表1 QAP回归模型中变量设定Tab.1 Variables in QAP regression models |
| 指标 | 构建方法 |
|---|---|
| GDP | 市辖区地区生产总值(亿元) |
| capital | 直辖市、省会城市、计划单列市和香港均赋值为1,其他城市赋值为0 |
| knowledge | 市辖区万人科学研究、技术服务人数与全市人均地方财政科学技术支出(元)的乘积 |
| distance | 城市之间的直线距离(km) |
| passenger | 全市民用航空客运量(万人) |
| telecom | 全市电信业务收入(亿元) |
| east | 东部地区的城市被编码为1,其他地区的城市编码为0 |
注:东部地区包括北京、天津、河北、辽宁、上海、江苏、浙江、福建、山东、广东和海南等11个省(市)。 |
表2 SAOMs中的网络效应和假设检验Tab.2 Network effects and testing hypothesis in SAOMs |
| 网络效应[SIENA代码] | 公式 | 假设检验 |
|---|---|---|
| 密度效应[density] | 城市网络关系是否为随机过程的结果? | |
| 互惠链接[recip] | 城市i和j之间是否存在互惠性链接关系? | |
| 出度扩张效应[outActSqrt] | 是否出度值较高的城市倾向于发送更多的关系? | |
| 入度聚敛效应[inPopSqrt] | 是否入度值较高的城市倾向于接收更多的关系? | |
| 出度聚敛效应[outPopSqrt] | 是否出度值较高的城市倾向于接收更多的关系? | |
| 2-路径[transTies] | 城市网络中是否具有较多传递性链接关系? | |
| 传递三方组[transTrip] | 城市网络链接关系是否具有传递性闭合倾向? | |
| 循环三方组[cycle3] | 城市网络链接关系是否具有循环闭合倾向? | |
| 地理距离协关系变量[X] | 地理距离是否制约着城市之间发送关系的倾向? | |
| 发送者效应[egoX] | 是否属性值X较高的城市倾向于发送更多关系? | |
| 接收者效应[altX] | 是否属性值X较高的城市倾向于发送接收关系? | |
| 趋同性(连续变量)[simX] | 是否属性值X相似的城市间倾向于建立更多联系? | |
| 趋同性(分类变量)[sameX] | 是否类型X相同的城市间倾向于建立更多联系? |
注:x代表城市的网络关系状态,i和j代表城市节点, =1表示城市i向城市j发出链接关系, =0表示不存在城市i向城市j的链接关系;v和w分别代表属性变量和地理距离协关系变量(dyadic covariates); 的表达式为 ,其中 ;如果 ,则 ,否则 。 |
表3 中国城市网络的层级分化Tab.3 Hierarchical differentiation of urban network in China |
| 2005年 | 2015年 | 2005年 | 2015年 | |||||||
|---|---|---|---|---|---|---|---|---|---|---|
| 城市 | 度数(%) | 城市 | 度数(%) | 城市对 | 关系数量(%) | 城市对 | 关系数量(%) | |||
| 北京 | 1 617(16.65) | 北京 | 4 052(14.59) | 香港—广州 | 113(2.46) | 香港—上海 | 277(2.15) | |||
| 香港 | 1 073(11.05) | 香港 | 3 579(12.89) | 北京—上海 | 113(2.46) | 香港—北京 | 238(1.85) | |||
| 上海 | 730(7.52) | 上海 | 1 676(6.03) | 香港—北京 | 94(2.05) | 香港—广州 | 229(1.78) | |||
| 深圳 | 550(5.66) | 深圳 | 1 534(5.52) | 香港—上海 | 88(1.92) | 北京—上海 | 214(1.66) | |||
| 广州 | 364(3.75) | 广州 | 860(3.10) | 香港—深圳 | 69(1.50) | 香港—深圳 | 170(1.32) | |||
| 武汉 | 210(2.16) | 杭州 | 553(1.99) | 北京—深圳 | 58(1.26) | 北京—深圳 | 143(1.11) | |||
| 杭州 | 195(2.01) | 南京 | 472(1.70) | 北京—武汉 | 43(0.94) | 香港—天津 | 123(0.95) | |||
| 南京 | 189(1.95) | 武汉 | 461(1.66) | 香港—天津 | 41(0.89) | 香港—杭州 | 110(0.85) | |||
| 天津 | 160(1.65) | 天津 | 452(1.63) | 北京—天津 | 41(0.89) | 北京—天津 | 108(0.84) | |||
| 重庆 | 154(1.59) | 福州 | 425(1.53) | 深圳—上海 | 40(0.87) | 深圳—北京 | 96(0.74) | |||
表4 中国城市网络的核心—边缘结构Tab.4 The core-peripheral structure in the urban network in China |
| 地位 | 2005年 | 2015年 | ||
|---|---|---|---|---|
| 城市名称 | 个数 | 城市名称 | 个数 | |
| 核心 | 北京、上海、深圳、大连、福州、广州、杭州、济南、南京、宁波、厦门、苏州、天津、武汉、香港、大同、鄂尔多斯、抚顺、青岛、太原、长沙、长治 | 22 | 北京、上海、深圳、大连、福州、广州、杭州、济南、南京、宁波、厦门、苏州、天津、武汉、香港、保定、成都、邯郸、嘉兴、廊坊、南通、绍兴、温州、烟台、扬州、重庆 | 26 |
| 中介人 | 沈阳、石家庄、哈尔滨、长春、嘉兴、合肥、芜湖、黄石、襄阳、海口、绵阳、乌鲁木齐 | 12 | 沈阳、鞍山、太原、石家庄、长春、合肥、哈尔滨、昆明、唐山、宿迁、乌鲁木齐、芜湖、潍坊、青岛、佛山、海口、马鞍山、鄂尔多斯、三明、龙岩、南昌、鹰潭、郑州、济源、昆明、黄石、襄阳、长沙、惠州、揭阳、绵阳、西安、乌鲁木齐、拉萨 | 34 |
| 接收者 | 廊坊、唐山、锦州、辽阳、无锡、常州、南通、湖州、绍兴、金华、南昌、淄博、烟台、潍坊、宜昌等 | 49 | 临汾、抚顺、运城、锦州、张家口、云浮、淮安、盐城、湖州、贵阳、榆林、兰州、泉州、银川、淄博、威海、镇江、株洲等 | 121 |
| 孤立者 | 晋城、盘锦、铁岭、佳木斯、萍乡、九江、新余、黄冈等 | 211 | 通化、白山、安阳、鹤壁、保山、昭通、宣城、巴中、七台河、自贡等 | 114 |
表5 中国城市网络演化机理的QAP回归结果Tab.5 Parameter estimates of QAP regressions of urban network evolution in China |
| 2010年 | 2015年 | ||||||
|---|---|---|---|---|---|---|---|
| estimate | Proportion As arge | Proportion As mall | estimate | Proportion As arge | Proportion As mall | ||
| intercept | 0.030979 | 0.017862 | |||||
| GDP | 0.136118 | 0.025 | 0.975 | 0.074898 | 0.004 | 0.996 | |
| capital | 0.684590 | 0.001 | 0.999 | 0.229219 | 0.002 | 0.998 | |
| knowledge | 1.191708 | 0.001 | 0.999 | 0.199732 | 0.001 | 0.999 | |
| telecom | 0.059971 | 0.064 | 0.936 | 0.061882 | 0.010 | 0.990 | |
| passenger | 0.218588 | 0.018 | 0.982 | 0.133366 | 0.008 | 0.992 | |
| distance | -0.010307 | 0.997 | 0.003 | -0.005484 | 0.993 | 0.007 | |
| east | 0.102451 | 0.001 | 0.999 | 0.065492 | 0.001 | 0.999 | |
| 2005 lag | 0.617261 | 0.001 | 0.999 | 2.067167 | 0.001 | 0.999 | |
| R-square | 0.673 | 0.896 | |||||
注:estimate 为参数的拟合系数,Proportion As Large为随机重排实验中拟合系数大于实际观测值的概率,Proportion As Small为随机重排实验中拟合系数小于实际观测值的概率。 |
表6 中国城市网络演化机理的SAOMs分析结果Tab.6 Parameter estimates of SAOMs of urban network evolution in China |
| estimate | S.E. | t-ratio | |
|---|---|---|---|
| Objective function | |||
| density | -0.3828 | 2.9766 | -0.092 |
| reciprocity | 1.9647* | 0.2893 | 0.033 |
| outdegree activity(sqrt) | 1.2987* | 0.2726 | 0.037 |
| indegree popularity(sqrt) | 0.4410* | 0.1275 | 0.032 |
| outdegree popularity(sqrt) | -0.9719* | 0.1778 | 0.030 |
| transitive ties | 2.7288* | 0.7960 | -0.051 |
| transitive triplets | 0.2515* | 0.0486 | 0.016 |
| 3-cycles | -0.0419 | 0.0859 | -0.039 |
| distance (centered) | -0.3480* | 0.0569 | -0.096 |
| capital alter | 1.8533* | 0.3559 | 0.021 |
| capital ego | -0.2930 | 1.2853 | 0.060 |
| same capital | -0.4488 | 0.2882 | 0.022 |
| GDP alter | 0.1030* | 0.0079 | 0.027 |
| GDP ego | 0.0036 | 0.0677 | -0.000 |
| GDP similarity | -2.9828* | 1.3768 | 0.005 |
| east alter | -0.4512* | 0.2161 | 0.019 |
| east ego | 2.7496 | 7.4202 | -0.058 |
| same east | 0.7325* | 0.2548 | 0.038 |
| Rate function | |||
| effect GDP on rate | 0.0072* | 0.0015 | -0.027 |
| effect capital on rate | 1.3672* | 0.1201 | -0.018 |
| effect east on rate | 0.4466* | 0.1351 | -0.078 |
| rate period 1 | 1.4181* | 0.0866 | |
| rate period 2 | 1.4315* | 0.0786 |
注:estimate为网络效应参数估计值;S.E.为参数估计值的标准误,参数估计值的绝对值大于两倍的标准误差代表相应的网络效应具有显著影响;t-ratio为模型收敛性指标,t-ratio的绝对值小于0.1代表参数收敛。 |
表7 中国城市网络三方组统计量的规模(链接数量截断值为3)Tab.7 The number of triad motifs in the urban network in China(cut-off vale of links is 3) |
| 三方组类型 | 数量(个) | 三方组类型 | 数量(个) | ||||
|---|---|---|---|---|---|---|---|
| 2005年 | 2010年 | 2015年 | 2005年 | 2010 | 2015 | ||
| A,B,C | 280 954 | 271 514 | 260 567 | A→B←C,A→C | 96 | 168 | 302 |
| A→B,C | 15 033 | 19 818 | 23 402 | A←B←C,A→C | 0 | 0 | 2 |
| A↔B,C | 2 026 | 2 904 | 5 404 | A↔B↔C | 98 | 210 | 566 |
| A←B→C | 3 135 | 5 738 | 8 071 | A←B→C,A↔C | 27 | 25 | 61 |
| A→B←C | 19 | 52 | 163 | A→B←C,A↔C | 58 | 137 | 204 |
| A→B→C | 144 | 213 | 575 | A→B→C,A↔C | 8 | 19 | 39 |
| A↔B←C | 33 | 63 | 246 | A->B↔C,A↔C | 20 | 61 | 167 |
| A↔B→C | 955 | 1 671 | 2 785 | A↔B↔C,A↔C | 15 | 28 | 67 |
| [1] |
李小建. 公司地理论[M]. 北京: 科学出版社, 1999.
|
| [2] |
宁越敏, 武前波. 企业空间组织与城市—区域发展[M]. 北京: 科学出版社, 2011.
|
| [3] |
盛科荣, 张红霞, 佀丹丹. 基于企业网络视角的城市网络研究进展与展望[J]. 人文地理, 2018, 33(2):11-17.
|
| [4] |
王成, 王茂军, 柴箐. 城市网络地位与网络权力的关系——以中国汽车零部件交易链接网络为例[J]. 地理学报, 2015, 70(12):1 953-1 972.
|
| [5] |
赵新正, 李秋平, 芮旸, 等. 基于财富500强中国企业网络的城市网络空间联系特征[J]. 地理学报, 2019, 74(4):694-709.
|
| [6] |
蒋小荣, 杨永春, 汪胜兰, 等. 基于上市公司数据的中国城市网络空间结构[J]. 城市规划, 2017, 41(6):18-26.
|
| [7] |
路旭, 马学广, 李贵才. 基于国际高级生产者服务业布局的珠三角城市网络空间格局研究[J]. 经济地理, 2012, 32(4):50-54.
|
| [8] |
李仙德. 基于上市公司网络的长三角城市网络空间结构研究[J]. 地理科学进展, 2014, 33(12):1 587-1 600.
|
| [9] |
吴康. 城市网络的空间结构及其演化研究[D]. 北京: 中国科学院大学, 2013.
|
| [10] |
赵渺希, 魏冀明, 吴康. 京津冀城市群的功能联系及其复杂网络演化[J]. 城市规划学刊, 2014(1):46-52.
|
| [11] |
朱查松, 王德, 罗震东. 中心性与控制力:长三角城市网络结构的组织特征及演化——企业联系的视角[J]. 城市规划学刊, 2014(4):24-30.
|
| [12] |
|
| [13] |
|
| [14] |
|
| [15] |
|
| [16] |
潘峰华, 夏亚博, 刘作丽. 区域视角下中国上市企业总部的迁址研究[J]. 地理学报, 2013, 68(4):449-463.
|
| [17] |
|
| [18] |
|
| [19] |
|
| [20] |
|
| [21] |
|
| [22] |
|
| [23] |
|
| [24] |
刘军. 整体网分析讲义:UCINET软件实用指南[M]. 上海: 格致出版社, 2009.
|
| [25] |
中华人民共和国国家统计局. 中国城市统计年鉴[M]. 北京: 中国统计出版社, 2011—2016.
|
| [26] |
姚士谋, 陈振光, 朱英明. 中国城市群[M]. 合肥: 中国科技大学出版社, 2006.
|
| [27] |
|
| [28] |
陆大道. 区域发展及其空间结构[M]. 北京: 科学出版社, 1995.
|
| [29] |
盛科荣, 孙威. 基于理论模型与美国经验证据的城市增长序贯模式[J]. 地理学报, 2013, 68(12):1 632-1 642.
|
| [30] |
刘君德, 靳润成, 周克瑜. 中国政区地理[M]. 北京: 科学出版社, 1999.
|
| [31] |
陆玉麒. 区域双核结构模式的形成机理[J]. 地理学报, 2002, 57(1):85-95.
|
| [32] |
贺灿飞, 肖晓俊, 邹沛思. 中国城市正在向功能专业化转型吗?——基于跨国公司区位战略的透视[J]. 城市发展研究, 2012, 19(3):20-29.
|
/
| 〈 |
|
〉 |