
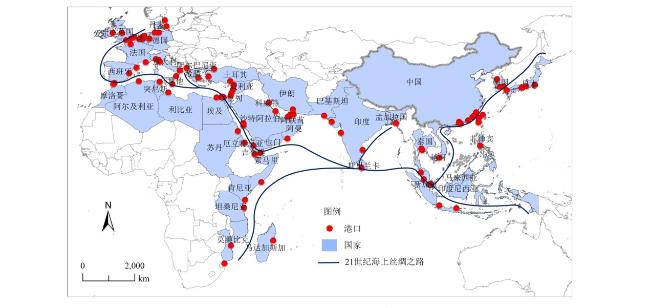
Spatial-Temporal Pattern and Evolution of Port System along the 21st-Century Maritime Silk Road
Received date: 2019-04-14
Revised date: 2019-09-30
Online published: 2025-04-17
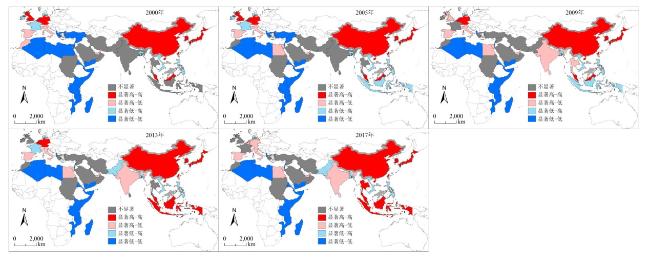
To reveal the evolution characteristics of the spatial distribution pattern of ports along the 21st-Century Maritime Silk Road(MSR), this paper describes them from time and space perspectives based on the methods of spatial autocorrelation and temporal-spatial correlation dimension, which provides theoretical support for clarifying the investment environment planning, layout of ports and the construction of the MSR. The results show that: 1) The distribution pattern of port system along the MSR has certain spatial correlation, the difference of container throughput is gradually narrowing. The spatial pattern of port container throughput presents the characteristics of marginalization and the phenomenon of club-convergence. The centre of gravity of port system has gradually shifted from Europe to Asia, especially to East and Southeast Asia. 2) The correlation between port clusters based on spatial and temporal distances is gradually enhanced, the temporal correlation is more obvious and the evolution process is more complex. The spatial-temporal correlation levels among port clusters are not completely consistent with the "distance attenuation law". 3) Overall, there is a hierarchical distribution pattern in the port system, and there are multiple hubs in some port clusters. The connection between port clusters along the MSR shows the networking tendency.
ZHANG Xinfang , LYU Jing . Spatial-Temporal Pattern and Evolution of Port System along the 21st-Century Maritime Silk Road[J]. Economic geography, 2019 , 39(11) : 33 -40 . DOI: 10.15957/j.cnki.jjdl.2019.11.005
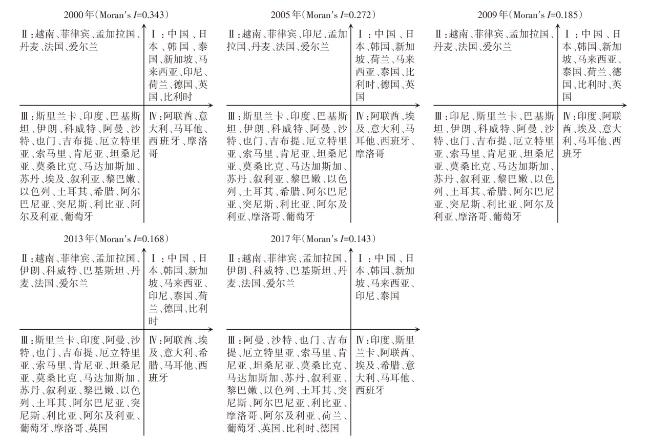
表1 MSR沿线港口体系的Global Moran's I指数Tab.1 The Global Moran's I of port system along the MSR |
| 年份 | Moran’s I | P值 | 年份 | Moran’s I | P值 | |
|---|---|---|---|---|---|---|
| 2000 | 0.343 | 0.001*** | 2009 | 0.185 | 0.021** | |
| 2001 | 0.377 | 0.001*** | 2010 | 0.189 | 0.017** | |
| 2002 | 0.379 | 0.001*** | 2011 | 0.188 | 0.018** | |
| 2003 | 0.346 | 0.002*** | 2012 | 0.180 | 0.020** | |
| 2004 | 0.322 | 0.002*** | 2013 | 0.168 | 0.023** | |
| 2005 | 0.272 | 0.008*** | 2014 | 0.154 | 0.034** | |
| 2006 | 0.243 | 0.011** | 2015 | 0.149 | 0.035** | |
| 2007 | 0.216 | 0.015** | 2016 | 0.145 | 0.040** | |
| 2008 | 0.190 | 0.019** | 2017 | 0.143 | 0.041** |
注:**、***分别表示通过5%、1%水平的显著性检验。 |
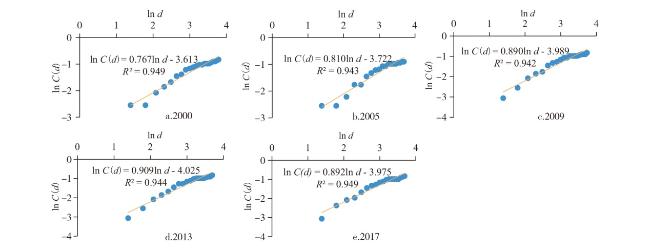
图4 空间关联维数的双对数关系Fig.4 The log-log plots for the correlation dimension of spatial distance |
表2 空间关联维数Tab.2 Values of correlation for spatial distance |
| 年份 | D | R2 | 年份 | D | R2 | |
|---|---|---|---|---|---|---|
| 2000 | 0.767 | 0.949 | 2009 | 0.890 | 0.942 | |
| 2001 | 0.811 | 0.935 | 2010 | 0.885 | 0.936 | |
| 2002 | 0.794 | 0.942 | 2011 | 0.881 | 0.937 | |
| 2003 | 0.794 | 0.938 | 2012 | 0.885 | 0.937 | |
| 2004 | 0.795 | 0.939 | 2013 | 0.909 | 0.944 | |
| 2005 | 0.798 | 0.943 | 2014 | 0.886 | 0.939 | |
| 2006 | 0.805 | 0.945 | 2015 | 0.883 | 0.945 | |
| 2007 | 0.839 | 0.944 | 2016 | 0.886 | 0.947 | |
| 2008 | 0.826 | 0.943 | 2017 | 0.892 | 0.949 |
注:结果在0.01水平(双侧)上显著相关。 |
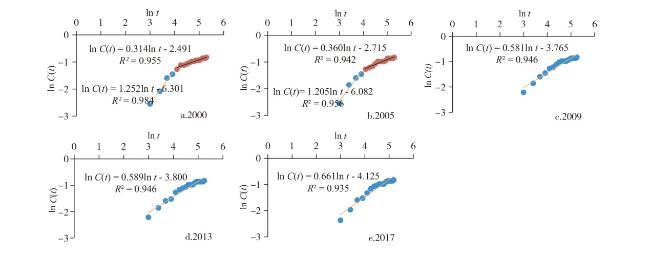
图5 时间关联维数的双对数关系Fig.5 The log-log plots for the correlation dimension of temporal distance |
表3 时间关联维数Tab.3 Values of correlation for temporal distance |
| 年份 | D1 | D2 | 年份 | D | R2 | |||
|---|---|---|---|---|---|---|---|---|
| 2000 | 1.252 | 0.984 | 0.314 | 0.955 | 2008 | 0.592 | 0.932 | |
| 2001 | 1.205 | 0.956 | 0.318 | 0.952 | 2009 | 0.581 | 0.946 | |
| 2002 | 1.195 | 0.989 | 0.327 | 0.948 | 2010 | 0.581 | 0.946 | |
| 2003 | 1.205 | 0.956 | 0.335 | 0.945 | 2011 | 0.590 | 0.951 | |
| 2004 | 1.205 | 0.956 | 0.309 | 0.946 | 2012 | 0.587 | 0.946 | |
| 2005 | 1.205 | 0.961 | 0.360 | 0.942 | 2013 | 0.589 | 0.946 | |
| 2006 | 1.125 | 0.956 | 0.349 | 0.940 | 2014 | 0.598 | 0.948 | |
| 2007 | 1.107 | 0.995 | 0.344 | 0.930 | 2015 | 0.604 | 0.950 | |
| 2016 | 0.608 | 0.947 | ||||||
| 2017 | 0.661 | 0.935 |
注:结果在0.01水平(双侧)上显著相关。 |
| [1] |
|
| [2] |
|
| [3] |
刘涛, 刘均卫. 长江干线集装箱港口体系集中度演进分析[J]. 经济地理, 2018, 38(3):113-119.
|
| [4] |
程佳佳, 王成金. 珠江三角洲集装箱港口体系演化及动力机制[J]. 地理学报, 2015, 70(8):1 256-1 270.
|
| [5] |
周思悦, 何金廖, 黄贤金. 江苏长江内河港口群竞争格局与一体化发展研究[J]. 长江流域资源与环境, 2018, 27(3):493-502.
|
| [6] |
郭政, 董平, 陆玉麒, 等. 长三角集装箱港口体系演化及影响因素分析[J]. 长江流域资源与环境, 2018, 27(7):1 423-1 432.
|
| [7] |
|
| [8] |
庄佳芳, 余思勤. 基于探索性空间数据分析的我国港口空间格局[J]. 上海海事大学学报, 2013, 34(3):66-71.
|
| [9] |
|
| [10] |
王绍卜. 我国沿海集装箱港口体系的空间结构及演化[J]. 经济地理, 2016, 36(8):93-98.
|
| [11] |
赵旭, 高苏红, 王晓伟. “21世纪海上丝绸之路”倡议下的港口合作问题及对策[J]. 西安交通大学学报:社会科学版, 2017, 37(6):66-74.
|
| [12] |
赵旭, 王晓伟, 周巧琳. 海上丝绸之路战略背景下的港口合作机制研究[J]. 中国软科学, 2016, 12:5-14.
|
| [13] |
牟乃夏, 廖梦迪, 张恒才, 等. “海上丝绸之路”沿线重要港口区位优势度评估[J]. 地球信息科学学报, 2018, 20(5):613-622.
|
| [14] |
杨忍, 牟乃夏, 彭澎, 等. “海上丝绸之路”沿线重要港口竞争力评价[J]. 地球信息科学学报, 2018, 20(5):623-631.
|
| [15] |
|
| [16] |
张协奎, 张亚芬. 南部沿海主要港口空间结构分析及互联互通定位[J]. 广西民族大学学报:哲学社会科学版, 2018, 40(2):160-168.
|
| [17] |
李剑, 兰潇文, 姜宝. “海上丝绸之路”战略下的我国港口功能布局研究——基于临港产业空间集聚视角[J]. 海洋开发与管理, 2017, 34(2):3-9.
|
| [18] |
|
| [19] |
|
| [20] |
袁莉琳, 季鹏. “21世纪海上丝绸之路”沿线区域枢纽港优化选择[J]. 经济地理, 2017, 37(11):1-9.
|
| [21] |
王成, 王茂军, 杨勃. 港口航运关联与港城职能的耦合关系研判——以“21世纪海上丝绸之路”沿线主要港口城市为例[J]. 经济地理, 2018, 38(11):158-165.
|
| [22] |
赵旭, 高苏红, 周巧琳, 等. 21世纪海上丝绸之路沿线港口体系演化研究——基于Logistics、Lotka-Volterra模型[J]. 运筹与管理, 2018, 27(8):172-181.
|
| [23] |
曾庆成, 吴凯, 滕藤. 海上丝绸之路港口的空间分布特征研究[J]. 大连理工大学学报:社会科学版, 2016, 37(1):25-30.
|
| [24] |
赵旭, 梁雪娇, 周巧琳, 等. 海上丝绸之路沿线港口体系的空间布局演化[J]. 上海海事大学学报, 2017, 38(4):43-48.
|
| [25] |
邓楚雄, 李民, 宾津佑. 湖南省人口分布格局时空变化特征及主要影响因素分析[J]. 经济地理, 2017, 37(12):41-48.
|
/
| 〈 |
|
〉 |