
Spatio-Temporal Differentiation and Influencing Factors of Regional Tourism Carbon Emissions under the Background of Green Development: A Case Study of the Yangtze River Economic Belt
Received date: 2018-10-02
Revised date: 2019-05-14
Online published: 2025-04-17
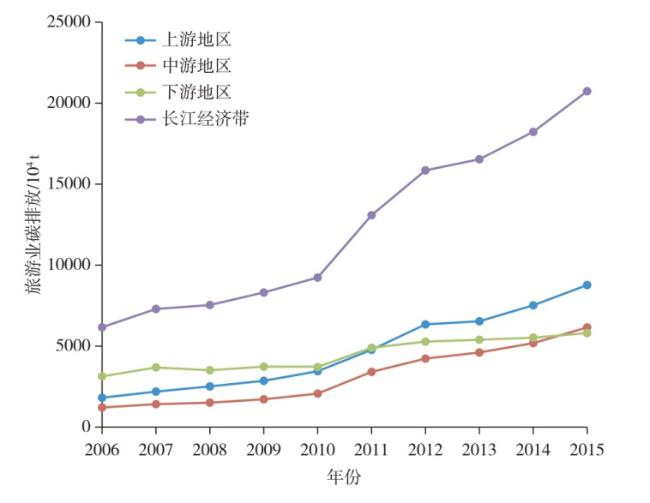
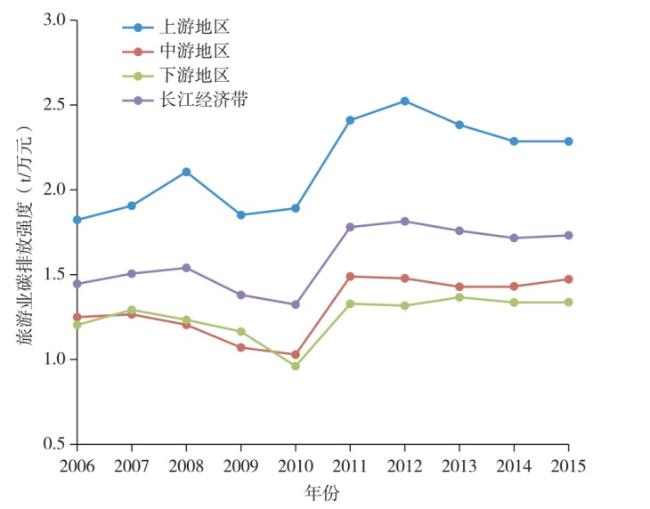
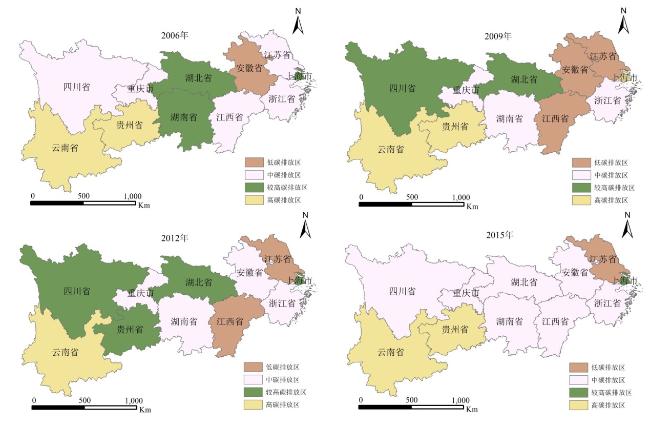
With the continuous and rapid development of tourism in the Yangtze River Economic Belt, the carbon emissions of tourism have also increased rapidly, which caused damage to the ecological environment of the Yangtze River Basin. Taking the carbon emission intensity of the tourism industry as the measure index, this paper used the Theil index to study the temporal and spatial differentiation and influencing factors of carbon emissions of tourism industry in the Yangtze River Economic Belt from 2006 to 2015. The results showed that: 1) From 2006 to 2015, the total carbon emissions of tourism industry in the Yangtze River Economic Belt showed a growing trend, which grew at an average annual growth rate of 14.91% from 61.646 million tons in 2006 to 207.395 million tons in 2015. But, the carbon emission intensity of tourism industry shows a trend of rising first and then slowly declining on the whole, which shows that the dependence of tourism economic growth on energy consumption is beginning to weaken; 2) The distribution of carbon emission intensity of tourism industry in the Yangtze River Economic Belt is not balanced, and the main type of carbon emission are middle carbon and higher carbon emission. In the spatial distribution of carbon emission intensity, the upper reaches > the middle reaches > the lower reaches; 3) The regional and intraregional differences in carbon emission intensity of tourism in the Yangtze River Economic Belt show a trend of expanding first and then narrowing. The regional differences are mainly rooted in intraregional differences, but the dependence on intraregional differences is declining; 4) Among the influencing factors, the economic scale, tourist scale, energy consumption intensity and energy consumption structure of tourism play a remarkable positive role in promoting the tourism carbon emission, while the regional economic development level, regional environmental pollution control level and tourism industry structure play a significant negative role in hindering the tourism carbon emission.
HUANG Heping , QIAO Xuezhong , ZHANG Jin , LI Yali , ZENG Yongming . Spatio-Temporal Differentiation and Influencing Factors of Regional Tourism Carbon Emissions under the Background of Green Development: A Case Study of the Yangtze River Economic Belt[J]. Economic geography, 2019 , 39(11) : 214 -224 . DOI: 10.15957/j.cnki.jjdl.2019.11.025
表1 国内外旅游业碳排放测算方法文献梳理Tab.1 Literature review on the methods of tourism carbon emission measurement at home and abroad |
| 测算方法 | 方法简介 | 作者及年份 |
|---|---|---|
| 自下而上法 | 以游客为基础,利用游客在旅游交通、住宿和旅游活动三个方面的相关统计数据,逐渐向上测算旅游业各部门的CO2排放量 | Gössling(2002)、Becken等(2003)、Peeters和Dubois(2010)、Howitt等(2010)、石培华等(2011)、程占红等(2015)、王凯等(2016)、李强谊等(2017)[1⇓⇓⇓⇓⇓⇓-8] |
| 自上而下法 | 将旅游业看作是国民经济体系的组成部分,基于国家或区域层面的统计数据,利用环境经济综合核算方法测算旅游业碳排放量 | Becken等(2006)、谢园方等(2012)、韩元军等(2016)[9⇓-11] |
| 生态足迹法 | 是一种静态分析方法,基于土地面积的量化指标来定量测算区域内旅游活动对生态的影响,并以此来测算旅游业碳排放量 | Hunter(2002)、Roberto等(2010)[12-13] |
| 碳足迹法 | 是对生态足迹法的拓展运用,用于测算某一活动过程直接或间接的CO2排放量,可以此来测算旅游业全过程的碳排放量 | 肖建红等(2011)、姜东晖等(2015)、姚治国等(2016)[14⇓-16] |
表2 国内外关于旅游业碳排放影响因素研究情况Tab.2 Research on the influencing factors of carbon emission in tourism at home and abroad |
表3 国民经济行业分类中第三产业部门与投入产出表、国家旅游卫星账户及能源平衡表的对应关系Tab.3 The corresponding relations between the third industry sector and the input-output table, the national tourism satellite account and the energy balance table in the classification of national economic industries |
| 第三产业产业部门名称 (行业分类门类代码) | 投入产出表(42部门)中 相对应第三产业部门名称 | 基于旅游卫星账户的 旅游特征产业部门名称 | 能源平衡表中 第三产业行业部门名称 |
|---|---|---|---|
| 批发和零售业F(51-52) | 批发和零售贸易业 | 商业(购物) | 批发、零售业和住宿、餐饮业 |
| 交通运输、仓储和邮政业G(53-60) | 交通运输及仓储业 | 交通(含长途、市内) | 交通运输、仓储和邮政业 |
| 邮政业 | 邮电通讯 | ||
| 住宿和餐饮业H(61-62) | 住宿和餐饮业 | 住宿、餐饮 | 批发、零售业和住宿、餐饮业 |
| 信息传输、计算机服务和软件业I(63-65) | 信息传输、计算机服务和软件业 | 邮电通讯 | 交通运输、仓储和邮政业 |
| 金融业J(66-69) | 金融保险业 | 其他服务 | 其他行业 |
| 房地产业K(70) | 房地产业 | 其他服务 | 其他行业 |
| 租赁和商务服务业L(71-72) | 租赁和商务服务业 | 其他服务 | 其他行业 |
| 科学研究和技术服务业M(73-75) | 科学研究事业、综合技术服务业 | - | - |
| 水利、环境和公共设施管理业N(76-78) | 水利、环境和公共设施管理业 | 游览 | 其他行业 |
| 居民服务和其他服务业O(79-81) | 居民服务和其他服务业 | 其他服务 | 其他行业 |
| 教育P(82) | 教育 | - | - |
| 卫生和社会工作Q(83-84) | 卫生、社会保障和社会福利事业 | - | - |
| 文化、体育和娱乐业R(85-89) | 文化、体育和娱乐业 | 娱乐 | 其他行业 |
| 公共管理、社会保障和社会组织S(90-95) | - | - | - |
| 国际组织T(96) | - | - | - |
表4 各种能源折标准煤参考系数Tab.4 The coefficient of energy converse to standard coal |
| 能源名称 | 折标准煤系数 | 能源名称 | 折标准煤系数 |
|---|---|---|---|
| 原煤 | 0.7143 kgce/kg | 汽油 | 1.4714 kgce/kg |
| 洗精煤 | 0.9000 kgce/kg | 煤油 | 1.4714 kgce/kg |
| 焦炭 | 0.9714 kgce/kg | 柴油 | 1.4571 kgce/kg |
| 型煤 | 0.5000~0.7000 kgce/kg | 液化石油气 | 1.7143 kgce/kg |
| 原油 | 1.4286 kgce/kg | 油田天然气 | 1.3300 kgce/m3 |
| 燃料油 | 1.4286 kgce/kg | 气田天然气 | 1.2143 kgce/m3 |
| 焦炉煤气 | 0.5714~0.6143 kgce/m3 | 液化天然气 | 1.7572 kgce/kg |
| 其他石油制品 | 1.4000 kgce/kg | 其他能源 | 1.0000 kgce/kg |
注:本文将天然气的折标准煤系数取油田天然气和气田天然气的均值,即为1.2722 kgce/m3。另外,对于型煤和焦炉煤气的折标准煤系数,本文惯常处理方法在此取均值0.6000 kgce/kg和0.59285 kgce/kg。 |
图1 2006—2015年长江经济带及上、中、下游地区旅游业碳排放量变动情况Fig.1 Changes in carbon emissions of tourism in the Yangtze River Economic Belt from 2006 to 2015 |
表5 2006—2015年长江经济带旅游业碳排放强度泰尔指数Tab.5 Theil index of carbon emission intensity of tourism in the Yangtze River Economic Belt from 2006 to 2015 |
| 年份 | 区域内 | TWR | TBR | T | ||
|---|---|---|---|---|---|---|
| 上游 | 中游 | 下游 | ||||
| 2006 | 0.0570 | 0.0676 | 0.0839 | 0.2084 | 0.0140 | 0.2225 |
| 2007 | 0.0404 | 0.0739 | 0.1053 | 0.2196 | 0.0137 | 0.2334 |
| 2008 | 0.0900 | 0.0968 | 0.1114 | 0.2982 | 0.0321 | 0.3303 |
| 2009 | 0.0549 | 0.0911 | 0.1752 | 0.3211 | 0.0304 | 0.3516 |
| 2010 | 0.0620 | 0.0722 | 0.1382 | 0.2724 | 0.0502 | 0.3226 |
| 2011 | 0.0751 | 0.0747 | 0.1271 | 0.2770 | 0.0394 | 0.3164 |
| 2012 | 0.0487 | 0.0506 | 0.1289 | 0.2282 | 0.0501 | 0.2783 |
| 2013 | 0.0918 | 0.0207 | 0.1138 | 0.2263 | 0.0378 | 0.2640 |
| 2014 | 0.0790 | 0.0135 | 0.0851 | 0.1776 | 0.0391 | 0.2166 |
| 2015 | 0.0800 | 0.0098 | 0.0782 | 0.1681 | 0.0381 | 0.2062 |
表6 2006—2015年长江经济带旅游业碳排放强度泰尔指数贡献率Tab.6 Contribution rate of Theil index of carbon emission intensity in Yangtze River Economic Belt from 2006 to 2015 |
| 年份 | 区域内(%) | 区域内总 (%) | 区域间 (%) | ||
|---|---|---|---|---|---|
| 上游 | 中游 | 下游 | |||
| 2006 | 25.62 | 30.38 | 37.71 | 93.71 | 6.29 |
| 2007 | 17.31 | 31.66 | 45.12 | 94.09 | 5.91 |
| 2008 | 27.25 | 29.31 | 33.73 | 90.28 | 9.72 |
| 2009 | 15.61 | 25.91 | 49.83 | 91.35 | 8.65 |
| 2010 | 19.22 | 22.38 | 42.84 | 84.44 | 15.56 |
| 2011 | 23.74 | 23.61 | 40.17 | 87.52 | 12.48 |
| 2012 | 17.50 | 18.18 | 46.32 | 82.00 | 18.00 |
| 2013 | 34.77 | 7.84 | 43.11 | 85.72 | 14.28 |
| 2014 | 36.47 | 6.23 | 39.29 | 81.99 | 18.01 |
| 2015 | 38.80 | 4.75 | 37.92 | 81.47 | 18.53 |
表7 面板数据单位根检验结果Tab.7 Unit root test results of panel data |
| 指标说明 | 水平值 | 一阶差分 | 二阶差分 | ||||||
|---|---|---|---|---|---|---|---|---|---|
| LLC | ADF | PP | LLC | ADF | PP | LLC | ADF | PP | |
| 碳排放 | 0.30331 (0.6192) | 4.46817 (1.0000) | 7.67553 (0.9979) | -6.85012 (0.0000) | 36.5634 (0.0264) | 52.7073 (0.0002) | -4.88887 (0.0000) | 43.1831 (0.0045) | 105.128 (0.0000) |
| 地区经济发展水平 | -4.15958 (0.0000) | 15.2272 (0.8523) | 66.6075 (0.0000) | -1.22896 (0.1095) | 20.0358 (0.5808) | 20.5995 (0.5456) | -10.6949 (0.0000) | 47.1038 (0.0014) | 66.5570 (0.0000) |
| 地区环境污染治理水平 | -3.75776 (0.0001) | 19.3773 (0.6219) | 21.3973 (0.4963) | -4.14760 (0.0000) | 32.4887 (0.0694) | 61.3833 (0.0000) | -8.18206 (0.0000) | 54.4101 (0.0001) | 93.3143 (0.0000) |
| 旅游业经济规模 | -1.78749 (0.0369) | 10.5102 (0.9811) | 38.0726 (0.0180) | -9.89537 (0.0000) | 42.2825 (0.0058) | 57.9477 (0.0000) | -15.1843 (0.0000) | 69.3704 (0.0000) | 123.072 (0.0000) |
| 旅游产业结构 | -9.84192 (0.0000) | 51.2416 (0.0004) | 48.0685 (0.0011) | -7.63423 (0.0000) | 39.1740 (0.0135) | 29.6905 (0.01262) | -14.2773 (0.0000) | 74.1710 (0.0000) | 65.0136 (0.0000) |
| 旅游业人数规模 | -4.19494 (0.0000) | 13.9072 (0.9047) | 30.7672 (0.1010) | -4.57311 (0.0000) | 25.2319 (0.2861) | 30.5804 (0.1050) | -17.7631 (0.0000) | 51.0399 (0.0004) | 73.9865 (0.0000) |
| 旅游业能源消耗强度 | 0.33070 (0.6296) | 4.41371 (1.0000) | 7.60779 (0.9981) | -6.44818 (0.0000) | 36.3023 (0.0282) | 53.8604 (0.0002) | -5.21617 (0.0000) | 43.6924 (0.0039) | 108.599 (0.0000) |
| 旅游业能源消费结构 | -5.26248 (0.0000) | 27.6656 (0.1870) | 14.1816 (0.8949) | -6.70766 (0.0000) | 45.2131 (0.0025) | 66.9470 (0.0000) | -6.99372 (0.0000) | 47.3012 (0.0013) | 116.375 (0.0000) |
注:括号外的数字分别是表示对应单位根检验的统计值,括号内的数据为对应统计量的P值。 |
表8 面板数据模型回归结果Tab.8 Panel data model regression results |
| 解释变量 | 混合效应模型 | 个体固定效应模型 | 个体随机效应模型 | |||||
|---|---|---|---|---|---|---|---|---|
| Coefficient | t-Statistic | Coefficient | t-Statistic | Coefficient | t-Statistic | |||
| 常数项 | 0.8882*** | 17.918300 | 0.8882*** | 17.0173 | 0.8882*** | 17.0173 | ||
| 地区经济发展水平 | -0.0841*** | -4.474400 | -0.0841*** | -4.2494 | -0.0841*** | -4.2494 | ||
| 地区环境污染治理水平 | -0.0271*** | -22.218480 | -0.0271*** | -21.1013 | -0.0271*** | -21.1013 | ||
| 旅游业经济规模 | 0.0954*** | 8.332673 | 0.0954*** | 7.9137 | 0.0954*** | 7.9137 | ||
| 旅游产业结构 | -0.1088*** | -21.141980 | -0.1088*** | -20.0789 | -0.1088*** | -20.0789 | ||
| 旅游业人数规模 | 0.0844*** | 11.972460 | 0.0844*** | 11.3704 | 0.0844*** | 11.3704 | ||
| 旅游业能源消耗强度 | 0.9927*** | 496.619300 | 0.9927*** | 471.6474 | 0.9927*** | 471.6474 | ||
| 旅游业能源消费结构 | 0.0530*** | 16.975960 | 0.0530*** | 16.1224 | 0.0530*** | 16.1224 | ||
| R-squared | 0.9999 | 1.0000 | 1.0000 | |||||
| Adjusted R-squared | 0.9999 | 1.0000 | 1.0000 | |||||
| Prob(F-statistic) | 0.0000 | 0.0000 | 0.0000 | |||||
注:“***”表示1%的显著性水平。 |
| [1] |
|
| [2] |
|
| [3] |
|
| [4] |
|
| [5] |
石培华, 吴普. 中国旅游业能源消耗与CO2排放量的初步估算[J]. 地理学报, 2011, 66(2):235-243.
|
| [6] |
程占红, 韩玉姣. 2000—2012年山西省旅游业碳排放的时空差异[J]. 陕西师范大学学报:自然科学版, 2015, 43(6):77-82.
|
| [7] |
王凯, 肖燕, 李志苗, 等. 中国旅游业CO2排放区域差异的空间分析[J]. 中国人口·资源与环境, 2016, 26(5):83-90.
|
| [8] |
李强谊, 钟水映, 徐飞. 中国旅游业二氧化碳排放的地区差异与收敛性研究[J]. 经济问题探索, 2017(8):28-38.
|
| [9] |
|
| [10] |
谢园方, 赵媛. 长三角地区旅游业能源消耗的CO2排放测度研究[J]. 地理研究, 2012, 31(3):429-437.
|
| [11] |
韩元军, 吴普. 京津冀地区旅游业的碳排放测算与比较研究[J]. 人文地理, 2016, 31(4):127-134.
|
| [12] |
|
| [13] |
|
| [14] |
肖建红, 于爱芬, 王敏. 旅游过程碳足迹评估——以舟山群岛为例[J]. 旅游科学, 2011, 25(4):58-66.
|
| [15] |
姜东晖, 靳雪. 基于终端消费的山东省旅游碳足迹研究[J]. 中国人口·资源与环境, 2015, 25(S1):450-453.
|
| [16] |
姚治国, 陈田. 基于碳足迹模型的旅游碳排放实证研究——以海南省为案例[J]. 经济管理, 2016, 38(2):151-159.
|
| [17] |
|
| [18] |
|
| [19] |
陶玉国, 黄震方, 吴丽敏, 等. 江苏省区域旅游业碳排放测度及其因素分解[J]. 地理学报, 2014, 69(10):1 438-1 448.
|
| [20] |
潘植强, 梁保尔. 旅游业碳排放强度分布及其驱动因子的时空异质研究——基于30个省(市、区)2005—2014年的面板数据分析[J]. 人文地理, 2016, 31(6):152-158.
|
| [21] |
王凯, 邵海琴, 周婷婷, 等. 基于STIRPAT模型的中国旅游业碳排放影响因素分析[J]. 环境科学学报, 2017, 37(3):1 185-1 192.
|
| [22] |
查建平, 舒皓羽, 李园园, 等. 中国旅游业碳排放及其影响因素研究——来自2005—2015年省级面板数据的证据[J]. 旅游科学, 2017, 31(5):1-16.
|
| [23] |
赵先超, 滕洁. 基于LMDI的湖南省旅游业碳排放影响因素分解[J]. 环境科学与技术, 2018, 41(9):192-199.
|
| [24] |
曾国军, 蔡建东. 中国旅游产业对国民经济的贡献研究[J]. 旅游学刊, 2012, 5(27):23-30.
|
| [25] |
李江帆, 李美云. 旅游业与旅游增加值的测算[J]. 旅游学刊, 1999(5):16-19.
|
| [26] |
冯宗宪, 王凯莹. 中国省域碳强度集群的空间统计分析[J]. 资源科学, 2014, 36(7):1 462-1 468.
|
| [27] |
陈飞, 诸大建. 低碳城市研究的理论方法与上海实证分析[J]. 城市发展研究, 2009, 16(10):71-79.
|
| [28] |
王强, 伍世代, 李婷婷. 中国工业经济转型过程中能源消费与碳排放时空特征研究[J]. 地理科学, 2011, 31(1):36-41.
|
/
| 〈 |
|
〉 |