
Spatial Structure and Traffic Accessibility of Tourism Resources in Yangtze River Economic Belt
Received date: 2019-02-23
Revised date: 2019-08-06
Online published: 2025-04-17
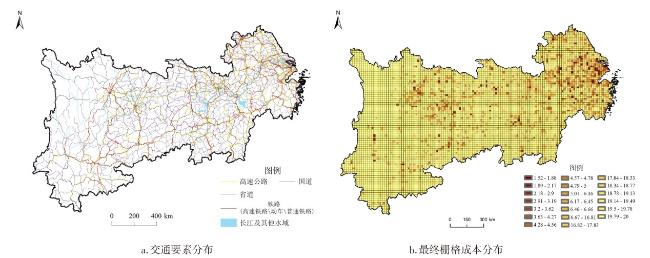
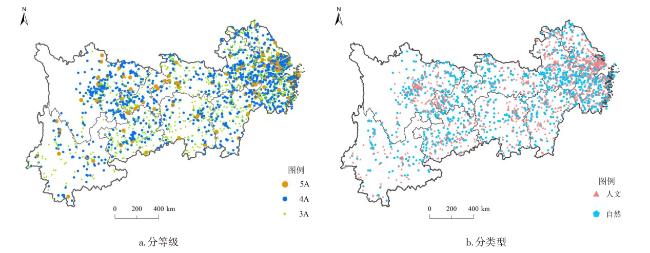
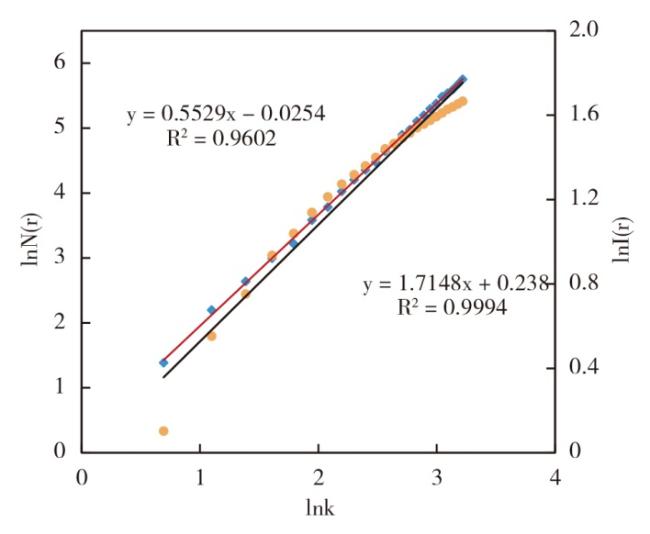
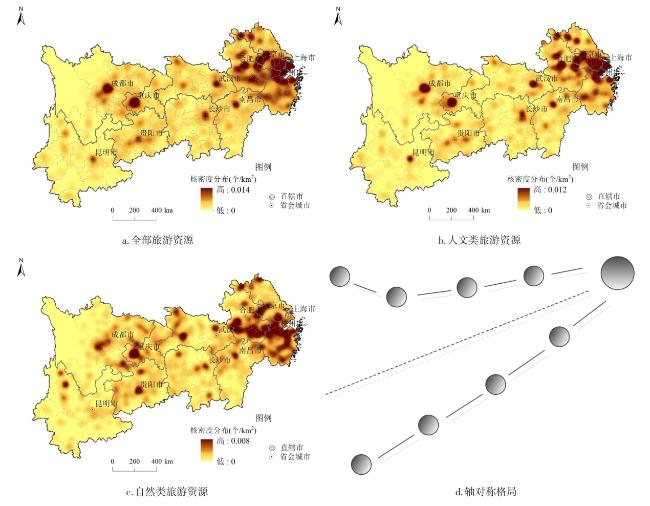
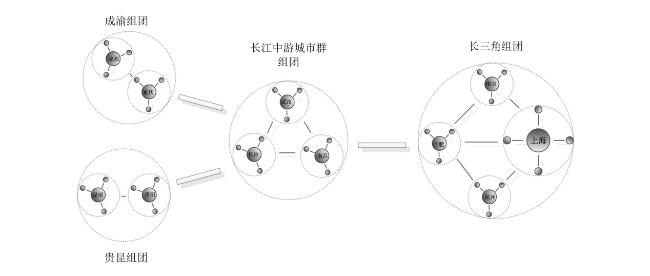
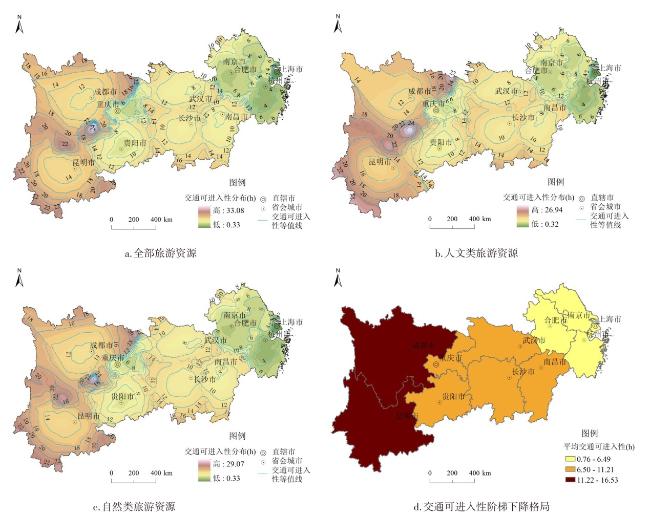
Taking the scenic spots of grade 3A and above in the Yangtze River Economic Belt as an example, the spatial structure of tourism resources in the Yangtze River Economic Belt was analyzed by using the nearest neighbor index, Kernel density analysis and weighted grid dimension. By constructing the tourism attraction coefficient model, a traffic grid cost dataset considering the preferences of tourists was built, then the traffic accessibility of tourism resources in the Yangtze River Economic Belt was evaluated by using the cost distance tool. The result shows that: 1) The spatial distribution of tourism resources is Dense in the east while sparse in the west. The spatial agglomeration has obvious population and socio-economic preferences, and a significant gathering area of tourism resources is formed around the provincial capitals and surrounding areas. 2) The spatial agglomeration of tourism resources presents an axisymmetric shape, and forms four supportive groups with Shanghai as the core, and a multi-center synergistic spatial structure. 3) The overall traffic accessibility of tourism resources is good, but there are obvious spatial differences between the east and west in this area, showing a step-like decline pattern from east to west. 4) The accessibility of tourism resources shows significant differences in grades and types. At the same time, high-traffic accessible tourism resources are clustered within the province's internal space, forming a core-peripheral structure within the province that is centered on the provincial capital.
TIAN Ye , LUO Jing , CUI Jiaxing , JIANG Liang , WU Yikun . Spatial Structure and Traffic Accessibility of Tourism Resources in Yangtze River Economic Belt[J]. Economic geography, 2019 , 39(11) : 203 -213 . DOI: 10.15957/j.cnki.jjdl.2019.11.024
表1 长江经济带旅游资源空间分布与基本统计特征Tab.1 Distribution of the tourism resources and its basic statistical characteristics in Yangtze River Economic Belt |
| 分区 | 省份 | 3A(个) | 4A(个) | 5A(个) | 人文(个) | 自然(个) | 总计(个) | 占比(%) | 密度(个/km2) | 分区占比(%) | 分区密度(个/km2) |
|---|---|---|---|---|---|---|---|---|---|---|---|
| 东部 | 上海市 | 47 | 59 | 3 | 98 | 11 | 109 | 4.00 | 171.92 | 31.48 | 43.79 |
| 浙江省 | 227 | 187 | 16 | 237 | 193 | 430 | 15.00 | 42.34 | |||
| 江苏省 | 151 | 196 | 23 | 263 | 107 | 370 | 13.00 | 37.12 | |||
| 中部 | 安徽省 | 204 | 190 | 11 | 246 | 162 | 408 | 14.00 | 29.56 | 37.47 | 15.23 |
| 湖北省 | 133 | 99 | 9 | 126 | 115 | 241 | 8.00 | 13.07 | |||
| 湖南省 | 129 | 80 | 7 | 124 | 92 | 216 | 7.00 | 9.95 | |||
| 江西省 | 96 | 112 | 9 | 132 | 85 | 217 | 8.00 | 12.68 | |||
| 西部 | 四川省 | 115 | 201 | 13 | 173 | 156 | 329 | 11.00 | 6.82 | 31.09 | 7.80 |
| 云南省 | 79 | 77 | 8 | 91 | 73 | 164 | 6.00 | 4.06 | |||
| 贵州省 | 137 | 95 | 16 | 132 | 104 | 236 | 8.00 | 12.98 | |||
| 重庆市 | 77 | 84 | 8 | 95 | 74 | 169 | 6.00 | 20.52 | |||
| 全带 | 1 394 | 1 380 | 114 | 1 716 | 1 172 | 2 888 | 100.00 | 13.96 | 100.00 | 13.96 | |
表2 长江经济带旅游资源交通可进入性时段分布Tab.2 Accessibility time distribution of the tourism resources in Yangtze River Economic Belt |
| 类型 | 统计 | 可进入性时段分布(h) | |||||||||
|---|---|---|---|---|---|---|---|---|---|---|---|
| 0~3 | 3~6 | 6~9 | 9~12 | 12~15 | 15~18 | 18~21 | 21~24 | 27~30 | 30~33 | ||
| 全部 | 个数(个) | 108 | 876 | 735 | 603 | 322 | 144 | 74 | 25 | 1 | 1 |
| 累计占比(%) | 3.74 | 34.06 | 59.50 | 80.37 | 91.52 | 96.50 | 99.07 | 99.93 | 99.97 | 100.00 | |
| 人文类 | 个数(个) | 97 | 521 | 450 | 364 | 178 | 66 | 25 | 15 | 1 | 0 |
| 累计占比(%) | 5.65 | 35.99 | 62.20 | 83.40 | 93.77 | 97.61 | 99.07 | 99.94 | 100.00 | 100.00 | |
| 自然类 | 个数(个) | 11 | 355 | 285 | 239 | 144 | 78 | 49 | 10 | 0 | 1 |
| 累计占比(%) | 0.94 | 31.23 | 55.55 | 75.94 | 88.23 | 94.88 | 99.06 | 99.91 | 100.00 | 100.00 | |
表3 长江经济带旅游资源交通可进入性空间分布(h)Tab.3 Spatial,grade and type distribution of the tourism resources' accessibility in Yangtze River Economic Belt |
| 分区 | 省份 | 3A | 4A | 5A | 人文 | 自然 | 分省 | 分区 |
|---|---|---|---|---|---|---|---|---|
| 东部 | 上海市 | 0.80 | 0.75 | 0.44 | 0.71 | 1.23 | 0.76 | 4.80 |
| 浙江省 | 4.41 | 4.33 | 3.71 | 4.36 | 4.40 | 4.38 | ||
| 江苏省 | 6.67 | 6.38 | 6.16 | 6.42 | 6.65 | 6.49 | ||
| 中部 | 安徽省 | 6.07 | 5.78 | 5.41 | 5.91 | 5.94 | 5.92 | 8.77 |
| 湖北省 | 10.58 | 10.24 | 9.70 | 10.24 | 10.59 | 10.41 | ||
| 湖南省 | 11.34 | 11.05 | 10.57 | 11.07 | 11.39 | 11.21 | ||
| 江西省 | 11.16 | 10.11 | 9.47 | 9.81 | 9.98 | 9.87 | ||
| 西部 | 四川省 | 15.04 | 14.42 | 13.25 | 13.82 | 15.52 | 14.63 | 12.12 |
| 云南省 | 16.54 | 16.49 | 15.73 | 16.44 | 16.64 | 16.53 | ||
| 贵州省 | 9.07 | 8.91 | 8.39 | 9.05 | 8.92 | 8.99 | ||
| 重庆市 | 7.69 | 6.94 | 5.08 | 7.36 | 7.31 | 7.34 | ||
| 全带 | 8.76 | 7.57 | 6.54 | 8.15 | 9.18 | 8.56 | 8.56 | |
| [1] |
中国国务院. 国务院关于加快发展旅游业的意见(国发〔2009〕41号)[EB/OL]. http://www.gov.cn/gongbao/content/2009/content_1481647.htm.
|
| [2] |
中国国务院. 国务院关于依托黄金水道推动长江经济带发展的指导意见(国发〔2014〕39号)[EB/OL]. http://www.gov.cn/zhengce/content/2014-09/25/content_9092.htm.
|
| [3] |
杨友宝, 王荣成, 李秋雨, 等. 东北地区旅游资源赋存演化特征与旅游业空间重构[J]. 经济地理, 2015, 35(10):194-201.
|
| [4] |
|
| [5] |
|
| [6] |
|
| [7] |
|
| [8] |
|
| [9] |
|
| [10] |
|
| [11] |
|
| [12] |
|
| [13] |
毛小岗, 宋金平, 于伟. 北京市A级旅游景区空间结构及其演化[J]. 经济地理, 2011, 31(8):1 381-1 386.
|
| [14] |
赵磊, 丁烨, 杨宏浩. 浙江省旅游景区空间分布差异化研究[J]. 经济地理, 2013, 33(9):177-183.
|
| [15] |
黄金火, 吴必虎. 区域旅游系统空间结构的模式与优化——以西安地区为例[J]. 地理科学进展, 2005, 24(1):116-126.
|
| [16] |
崔大树, 孙杨. 基于分形维数的湖州旅游景区系统空间结构优化研究[J]. 地理科学, 2011, 31(3):337-343.
|
| [17] |
王恒, 李悦铮. 大连市旅游景区空间结构分析与优化[J]. 地域研究与开发, 2010, 29(1):84-89.
|
| [18] |
谢志华, 吴必虎. 中国资源型景区旅游空间结构研究[J]. 地理科学, 2008, 28(6):748-753.
|
| [19] |
吴杨, 倪欣欣, 马仁锋, 等. 上海工业旅游资源的空间分布与联动特征[J]. 资源科学, 2015, 37(12):2 362-2 370.
|
| [20] |
吴荣华, 张宏磊, 张捷, 等. 城市历史文化旅游地的小尺度空间结构及关联——以南京夫子庙景区为例[J]. 地理研究, 2014, 33(12):2 427-2 436.
|
| [21] |
潘竟虎, 从忆波. 中国4A级及以上旅游景点(区)空间可达性测度[J]. 地理科学, 2012, 32(11):1 321-1 327.
|
| [22] |
孙建伟, 田野, 崔家兴, 等. 湖北省旅游空间结构识别与可达性测度[J]. 经济地理, 2017, 37(4):208-217.
|
| [23] |
王绍博, 郭建科. 中国风景名胜区交通可达性及市场潜力空间测度[J]. 地理研究, 2016, 35(9):1 714-1 726.
|
| [24] |
曹芳东, 黄震方, 吴江, 等. 国家级风景名胜区旅游效率测度与区位可达性分析[J]. 地理学报, 2012, 67(12):1 686-1 697.
|
| [25] |
李保超, 王朝辉, 李龙, 等. 高速铁路对区域内部旅游可达性影响——以皖南国际文化旅游示范区为例[J]. 经济地理, 2016, 36(9):182-191.
|
| [26] |
潘竟虎, 李俊峰. 中国A级旅游景点空间结构的计量地理分析[J]. 经济地理, 2013, 33(9):154-160.
|
| [27] |
佘冰, 朱欣焰, 呙维, 等. 基于空间点模式分析的城市管理事件空间分布及演化——以武汉市江汉区为例[J]. 地理科学进展, 2013, 32(6):924-931.
|
| [28] |
田野, 罗静, 孙建伟, 等. 区域可达性改善与交通联系网络结构演化——以湖北省为例[J]. 经济地理, 2018, 38(3):72-81.
|
| [29] |
孙枫, 汪德根, 牛玉. 高速铁路与汽车和航空的竞争格局分析[J]. 地理研究, 2017, 36(1):171-187.
|
| [30] |
|
| [31] |
叶大年. 城市的对称分布与中国城市化趋势[M]. 合肥: 安徽教育出版社, 2011.
|
| [32] |
|
/
| 〈 |
|
〉 |