
Can Urban Agglomeration Drive Regional Economic Growth?Empirical Analysis Based on Seven State-level Urban Agglomerations
Received date: 2020-10-23
Revised date: 2021-05-21
Online published: 2025-04-17
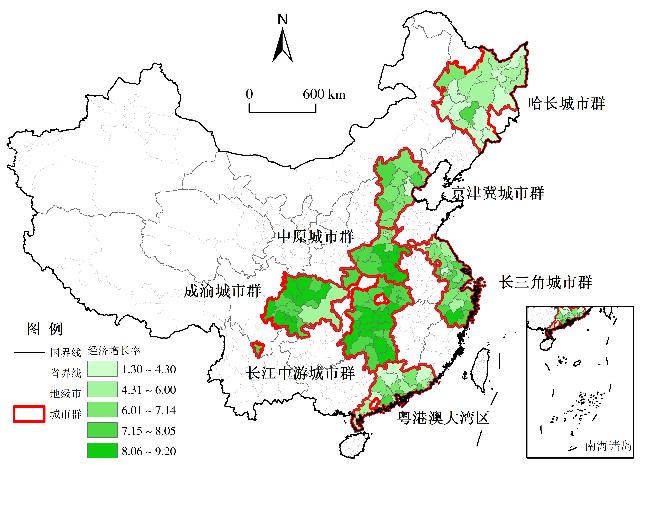
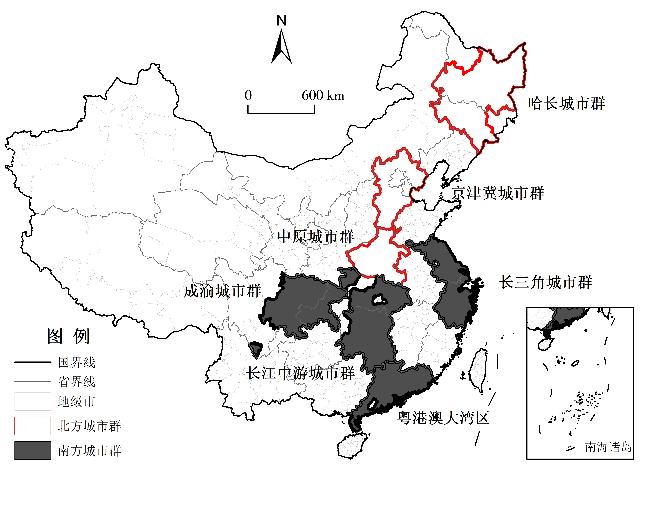
This paper regards urban agglomeration as a regional economic policy,and evaluates the effect of this policy on regional economic growth by using differences-in-differences model. The results show that: 1) Urban agglomeration can effectively promote regional economic growth,and the promotion effect of seven state-level urban agglomerations is about 0.56% per year. Among them,the four urban agglomerations in the south of China have a very obvious effect on the regional economic growth,the annual economic growth rate of the cities joining the urban agglomeration is 0.92% higher than the cities not joining. 2) The effect of the three urban agglomerations in the north on the regional economic growth is not obvious. 3) The impact of urban agglomeration on regional economic growth is affected by spillover effect and siphon effect of core cities. It is related to spatial distance and economic level of core cities. 4) The influence of seven state-level urban agglomerations,southern urban agglomerations and northern urban agglomerations on regional economic growth and their spatial distances shows the characteristics of "inverted N-shaped" curve,"inverted U-shaped" curve and "U-shaped" curve. 5) The higher the economic level of core cities or the stronger competitiveness of core cities,the greater the effect of urban agglomeration on regional economic growth. Based on the research conclusions,this paper puts forward four policy suggestions: scientific choice of urban agglomeration location,reasonable planning of urban agglomeration spatial scope,coordination of city relations within urban agglomeration and coordinated development of regional economy.
DING Renzhong , XU Boyin , ZHANG Hang . Can Urban Agglomeration Drive Regional Economic Growth?Empirical Analysis Based on Seven State-level Urban Agglomerations[J]. Economic geography, 2021 , 41(5) : 37 -45 . DOI: 10.15957/j.cnki.jjdl.2021.05.005
表1 国家级城市群及其批复时间Tab.1 State-level urban agglomeration and its approval time |
| 城市群 | 批复时间 | 相关文件 |
|---|---|---|
| 京津冀城市群 | 2015年 | 京津冀协同发展规划纲要 |
| 长江中游城市群 | 2015年 | 长江中游城市群发展规划 |
| 粤港澳大湾区 (珠三角城市群) | 2018年 (2015年) | 粤港澳大湾区发展规划 |
| 成渝城市群 | 2016年 | 成渝城市群发展规划 |
| 长三角城市群 | 2016年 | 长江三角洲城市群发展规划 |
| 中原城市群 | 2016年 | 中原城市群发展规划 |
| 哈长城市群 | 2016年 | 哈长城市群发展规划 |
| 北部湾城市群 | 2017年 | 北部湾城市群发展规划 |
| 关中平原城市群 | 2018年 | 关中平原城市群发展规划 |
| 呼包鄂榆城市群 | 2018年 | 呼包鄂榆城市群发展规划 |
| 兰西城市群 | 2018年 | 兰州—西宁城市群发展规划 |
表2 各变量描述性分析Tab.2 Descriptive analysis of variables |
| 变量名称 | 符号 | 单位 | 样本数 | 平均值 | 最小值 | 最大值 | 标准差 |
|---|---|---|---|---|---|---|---|
| 实际经济增长率 | r | % | 2 100 | 11.30 | -19.38 | 32.9 | 4.57 |
| 人口数量 | pop | 万人 | 2 100 | 517.88 | 78.00 | 3 404.00 | 362.29 |
| 工业化程度 | ind | % | 2 100 | 47.65 | 14.95 | 85.92 | 10.28 |
| 对外开放程度 | fdi | % | 2 100 | 2.15 | 0 | 19.82 | 2.08 |
| 投资水平 | inv | % | 2 100 | 64.88 | 11.97 | 255.00 | 88.22 |
| 创新水平 | inn | % | 2 100 | 9.40 | 0 | 38.64 | 17.23 |
| 交通水平 | proad | m2 | 2 100 | 10.96 | 0.36 | 73.04 | 7.42 |
| 政府支出 | gov | % | 2 100 | 15.02 | 0.93 | 63.88 | 16.18 |
表3 多期DID模型基准回归结果Tab.3 The base regression results of multi period DID model |
| 变量 | r | |||
|---|---|---|---|---|
| (1) | (2) | (3) | (4) | |
| D | 0.4582 (0.3318) | 0.5594* (0.3300) | 0.9265*** (0.3477) | 0.1636 (0.6907) |
| pop | - | 0.0105*** (0.0033) | 0.0844*** (0.0035) | 0.0141** (0.0064) |
| ind | - | 0.1422*** (0.0269) | 0.0913** (0.0214) | 0.1172 (0.0765) |
| fdi | - | 0.0882 (0.0784) | 0.4275*** (0.0928) | 0.0002 (0.0927) |
| inv | - | 0.0045** (0.0022) | 0.0039* (0.0022) | 0.0535*** (0.0167) |
| inn | - | -0.0402 (0.1002) | -0.1592 (0.1035) | 0.3492 (0.2434) |
| proad | - | 0.0047 (0.0242) | 0.0026 (0.0244) | -0.0016 (0.0437) |
| gov | - | -0.0221* (0.0130) | -0.0247* (0.0138) | 0.0954* (0.0523) |
| _cons | 13.8307*** (0.2110) | 1.8367 (2.3151) | 4.1891* (2.3793) | -1.3309 (5.3434) |
| 个体固定效应 | 控制 | 控制 | 控制 | 控制 |
| 时间固定效应 | 控制 | 控制 | 控制 | 控制 |
| Within R-Sq | 0.4382 | 0.4623 | 0.4146 | 0.6091 |
| Number of obs | 2 100 | 2 100 | 1 350 | 750 |
注:***、**、*分别表示1%、5%、10%的显著性水平,括号内为稳健标准误差。 |
表4 变更政策时间的稳健性检验结果Tab.4 Robustness test results of changing policy time |
| 变量 | r | |||||
|---|---|---|---|---|---|---|
| (1) | (2) | (3) | (4) | (5) | (6) | |
| D | 0.1511(0.4866) | 0.2172(0.5712) | 0.6050(0.6989) | 0.0285(0.4833) | 0.2261(0.5235) | 1.1430(0.7679) |
| _cons | 1.8772(2.3326) | 4.1490(2.3408) | -1.5944(5.3830) | 1.9023(2.3403) | 4.2267(2.3224) | -1.9252(5.3597) |
| 控制变量 | 控制 | 控制 | 控制 | 控制 | 控制 | 控制 |
| 个体固定效应 | 控制 | 控制 | 控制 | 控制 | 控制 | 控制 |
| 时间固定效应 | 控制 | 控制 | 控制 | 控制 | 控制 | 控制 |
| Within R-Sq | 0.4616 | 0.4125 | 0.6098 | 0.4616 | 0.4125 | 0.6120 |
| Number of obs | 2 100 | 1 350 | 750 | 2 100 | 1 350 | 750 |
表6 机制检验1(七大城市群)Tab.6 Mechanism test 1 (seven urban agglomerations) |
| 变量 | (1) | (2) | (3) | (4) | (5) |
|---|---|---|---|---|---|
| r | r(d<100) | r(100<d<200) | r(200<d<400) | r(d>400) | |
| D | 1.1410***(0.4079) | -0.8621*(0.4888) | 2.4211***(0.5876) | 0.0837*(0.0487) | -0.2292(1.0419) |
| D·d | -0.0031**(0.0018) | - | - | - | - |
| _cons | 2.1710(2.1927) | -1.9237(4.7024) | 14.1339***(4.5899) | 0.8599(5.0026) | 0.1970(3.9212) |
| 控制变量 | 控制 | 控制 | 控制 | 控制 | 控制 |
| 个体固定效应 | 控制 | 控制 | 控制 | 控制 | 控制 |
| 时间固定效应 | 控制 | 控制 | 控制 | 控制 | 控制 |
| Within R-Sq | 0.4631 | 0.7988 | 0.7500 | 0.6493 | 0.3212 |
| Number of obs | 2 100 | 150 | 390 | 690 | 765 |
表7 机制检验2(七大城市群)Tab.7 Mechanism test 2 (seven urban agglomerations) |
| 变量 | r | ||||
|---|---|---|---|---|---|
| (1) | (2) | (3) | (4) | (5) | |
| D | 3.2046**(1.5632) | 4.9722(3.9957) | 3.5556*(2.0640) | 4.4916(3.3528) | 2.2307***(0.6257) |
| D core | 0.3349*(0.1980) | 0.4992(0.3683) | 0.5139**(0.2483) | 0.4562(0.3100) | -0.4647***(0.1607) |
| _cons | 2.4557(2.3255) | 2.0957(2.3022) | 2.6754(2.2977) | 2.1316(2.2984) | 2.7853(2.1878) |
| 控制变量 | 控制 | 控制 | 控制 | 控制 | 控制 |
| 个体固定效应 | 控制 | 控制 | 控制 | 控制 | 控制 |
| 时间固定效应 | 控制 | 控制 | 控制 | 控制 | 控制 |
| Within R-Sq | 0.4626 | 0.4624 | 0.4630 | 0.4624 | 0.4655 |
| Number of obs | 2 100 | 2 100 | 2 100 | 2 100 | 2 100 |
| [1] |
|
| [2] |
|
| [3] |
|
| [4] |
|
| [5] |
|
| [6] |
|
| [7] |
|
| [8] |
|
| [9] |
|
| [10] |
李献波, 林雄斌, 孙东琪. 中国区域产业结构变动对经济增长的影响[J]. 经济地理, 2016, 36(5):100-106.
|
| [11] |
苏红键, 魏后凯, 邓明. 城市集聚经济的多维性及其实证检验[J]. 财贸经济, 2014(5):115-126.
|
| [12] |
刘修岩. 空间效率与区域平衡:对中国省级层面集聚效应的检验[J]. 世界经济, 2014, 37(1):55-80.
|
| [13] |
吴福象, 刘志彪. 城市化群落驱动经济增长的机制研究——来自长三角16个城市的经验证据[J]. 经济研究, 2008, 43(11):126-136.
|
| [14] |
毕秀晶, 宁越敏. 长三角大都市区空间溢出与城市群集聚扩散的空间计量分析[J]. 经济地理, 2013, 33(1):46-53.
|
| [15] |
孙斌栋, 丁嵩. 大城市有利于小城市的经济增长吗?——来自长三角城市群的证据[J]. 地理研究, 2016, 35(9):1615-1625.
|
| [16] |
陈玉, 孙斌栋. 京津冀存在“集聚阴影”吗——大城市的区域经济影响[J]. 地理研究, 2017, 36(10):1936-1946.
|
| [17] |
姚常成, 宋冬林. 借用规模、网络外部性与城市群集聚经济[J]. 产业经济研究, 2019(2):76-87.
|
| [18] |
孙铁山. 中国三大城市群集聚空间结构演化与地区经济增长[J]. 经济地理, 2016, 36(5):63-70.
|
| [19] |
曹清峰. 国家级新区对区域经济增长的带动效应——基于70大中城市的经验证据[J]. 中国工业经济, 2020(7):43-60.
|
| [20] |
刘倩, 朱书尚, 吴非. 城市群政策能否促进区域金融协调发展?——基于方言视角下的实证检验[J]. 金融研究, 2020(3):39-57.
|
| [21] |
王德利, 王岩. 中国城市群经济增长方式识别及分异特征[J]. 经济地理, 2017, 37(9):80-86.
|
| [22] |
方创琳. 中国城市群形成发育的政策影响过程与实施效果评价[J]. 地理科学, 2012, 32(3):257-264.
|
| [23] |
李煜伟, 倪鹏飞. 外部性、运输网络与城市群经济增长[J]. 中国社会科学, 2013, 34(3):174-194.
|
| [24] |
刘修岩, 陈子扬. 城市体系中的规模借用与功能借用——基于网络外部性视角的实证检验[J]. 城市问题, 2017(12):12-19.
|
| [25] |
|
| [26] |
盛来运, 郑鑫, 周平, 等. 我国经济发展南北差距扩大的原因分析[J]. 管理世界, 2018, 34(9):16-24.
|
| [27] |
刘瑞明, 赵仁杰. 国家高新区推动了地区经济发展吗?——基于双重差分方法的验证[J]. 管理世界, 2015(8):30-38.
|
| [28] |
方创琳, 鲍超, 马海涛. 2016中国城市群发展报告[M]. 北京: 科学出版社, 2016.
|
/
| 〈 |
|
〉 |
