
Spatial-temporal Characteristics and Driving Factors of Green Innovation Efficiency in Guangdong-Hong Kong-Macao Greater Bay Area
Received date: 2020-07-31
Revised date: 2021-03-18
Online published: 2025-04-17
This paper explores the spatial distribution,evolution law and driving factors of green innovation efficiency in the Guangdong-Hong Kong-Macao Greater Bay Area from 2009 to 2019 applying the unexpected super-efficiency SBM model,exploratory spatial data analysis (ESDA) and spatial Durbin Model (SDM). The results show that: 1) The green innovation efficiency has a benign development trend and experiences three stages successively: growth period,recession period and recovery period,it shows the distribution characteristics of urban gradient and mid-stream drive. 2) The green innovation efficiency in the Greater Bay Area has obvious negative spatial correlation,which is mainly manifested in the characteristics of high-high agglomeration,low-high agglomeration and high-low agglomeration. The "polarization" phenomenon of green innovation efficiency leads to poor spatial distribution pattern stability. It has significantly increased their spillovers in Hong Kong and Macao,and urban agglomerations in the Pearl River Delta region have basically achieved interconnected development in green innovation. 3)Government support,degree of openness,environmental regulations and education level promote the efficiency of green innovation besides the industrial structure. The educational level and industrial structure have positive spatial spillover effect, the degree of openness has negative spatial spillover effect,and the other factors have insignificant spatial spillover effect. Finally,based on the research conclusions,it puts forward some proposals for green innovation in the Guangdong-Hong Kong-Macao Greater Bay Area: accelerating the formation of a long-term mechanism for the implementation and transformation of green innovation achievements,promoting the effective connection of green innovation with industrial chain,education chain and talent chain,and reducing the transaction cost of inter-regional collaborative innovation system.
DONG Huizhong , LI Xuan , ZHANG Renjie . Spatial-temporal Characteristics and Driving Factors of Green Innovation Efficiency in Guangdong-Hong Kong-Macao Greater Bay Area[J]. Economic geography, 2021 , 41(5) : 134 -144 . DOI: 10.15957/j.cnki.jjdl.2021.05.015
表1 粤港澳大湾区绿色创新效率衡量指标Tab.1 Indicators of green innovation efficiency in Guangdong-Hong Kong-Macao Greater Bay Area |
| 指标类型 | 指标构成 | 变量 | 单位 |
|---|---|---|---|
| 投入 | 资本投入 | R&D资本存量 | 万元 |
| 人力投入 | R&D从业人员全时当量 | 人 | |
| 能源投入 | 工业能源消费总量 | 万t标煤 | |
| 产出 | 经济产出 | 新产品销售收入 | 万元 |
| 技术产出 | 专利授权量 | 件 | |
| 生态产出 | 建成区绿化覆盖率 | % | |
| 非期望产出 | 工业SO2排放量 | 万t | |
| 工业废水排放量 | 万t | ||
| 工业固体废弃物排放量 | 万t |
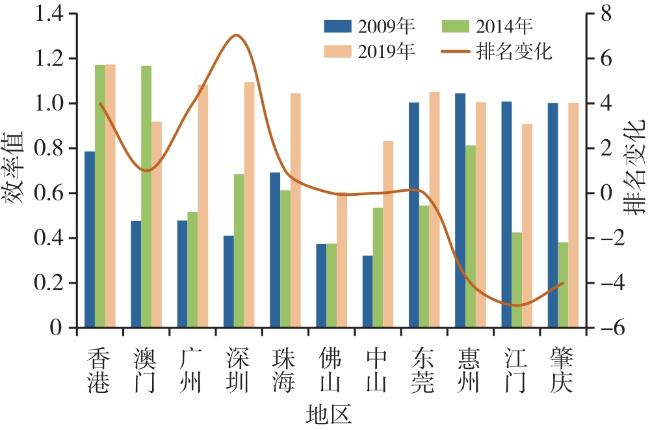
表2 粤港澳大湾区绿色创新效率综合评价结果Tab.2 Comprehensive evaluation results of green innovation efficiency |
| 城市 | 2009 | 2010 | 2011 | 2012 | 2013 | 2014 | 2015 | 2016 | 2017 | 2018 | 2019 |
|---|---|---|---|---|---|---|---|---|---|---|---|
| 香港 | 0.786 | 1.032 | 1.005 | 1.007 | 1.221 | 1.171 | 1.121 | 1.112 | 1.255 | 1.102 | 1.173 |
| 澳门 | 0.476 | 0.680 | 1.012 | 0.569 | 1.123 | 1.168 | 1.084 | 0.784 | 0.974 | 1.128 | 0.919 |
| 广州 | 0.478 | 0.494 | 0.495 | 0.473 | 0.557 | 0.516 | 0.748 | 1.044 | 0.733 | 1.022 | 1.084 |
| 深圳 | 0.410 | 0.537 | 0.645 | 0.637 | 0.670 | 0.685 | 1.011 | 1.023 | 1.015 | 1.035 | 1.095 |
| 珠海 | 0.692 | 0.543 | 0.580 | 0.619 | 0.605 | 0.613 | 0.609 | 0.884 | 0.848 | 0.856 | 1.045 |
| 佛山 | 0.374 | 0.354 | 0.281 | 0.238 | 0.367 | 0.375 | 0.446 | 0.476 | 0.393 | 0.606 | 0.606 |
| 中山 | 0.322 | 0.316 | 0.397 | 0.347 | 0.504 | 0.535 | 0.590 | 0.660 | 0.749 | 0.896 | 0.832 |
| 东莞 | 1.004 | 0.833 | 1.005 | 0.629 | 0.604 | 0.545 | 0.565 | 0.687 | 1.021 | 1.045 | 1.051 |
| 惠州 | 1.045 | 0.823 | 0.702 | 0.617 | 0.673 | 0.813 | 1.081 | 0.761 | 0.655 | 0.835 | 1.005 |
| 江门 | 1.008 | 1.014 | 0.688 | 0.480 | 0.457 | 0.425 | 0.511 | 0.884 | 0.890 | 0.856 | 0.908 |
| 肇庆 | 1.002 | 1.011 | 0.655 | 0.459 | 0.417 | 0.381 | 0.361 | 0.509 | 0.339 | 0.383 | 1.003 |
| 平均值 | 0.691 | 0.694 | 0.679 | 0.552 | 0.654 | 0.657 | 0.739 | 0.802 | 0.807 | 0.888 | 0.975 |
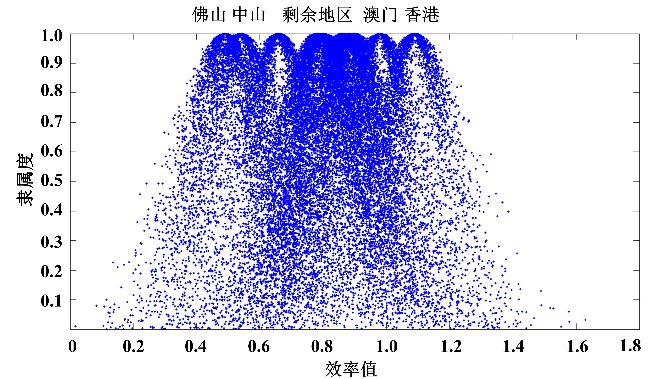
图1 粤港澳大湾区绿色创新效率正态云隶属度分布Fig.1 Distribution of normal cloud membership of green innovation efficiency |
表3 绿色创新效率影响因素Tab.3 Influencing factors of green innovation efficiency |
| 变量 | 指标 | 指标代码 | 单位 |
|---|---|---|---|
| 政府支持 | 政府财政支出 | GOVE | 亿元 |
| 开放程度 | 外商直接投资 | OPEN | 万美元 |
| 教育水平 | 在校大学生数量 | STU | 人 |
| 环境规制 | 工业污染治理投资 | ER | 亿元 |
| 产业结构 | 工业产值占比 | INS | % |
表4 空间计量回归结果Tab.4 Spatial measurement regression results |
| 变量 | OLS | 邻接距离矩阵(W) | 反距离矩阵(D) | 经济距离矩阵(G) | ||||||||
|---|---|---|---|---|---|---|---|---|---|---|---|---|
| SEM | SAR | SDM | SEM | SAR | SDM | SEM | SAR | SDM | ||||
| lnGOVE | 0.626** | 0.841* | 0.791* | 0.926* | 0.811* | 0.774* | 0.899* | 0.881* | 0.801* | 0.953* | ||
| lnOPEN | 0.412* | 0.458* | -0.567 | 0.234** | 0.428* | -0.544 | 0.252** | 0.420* | -0.520 | 0.277** | ||
| lnSTU | 1.240*** | -0.635 | 0.839** | 1.213*** | -0.558 | 0.818** | 1.131*** | -0.661 | 0.811** | 1.288*** | ||
| lnINS | -0.855* | -0.652* | -0.772* | -0.793** | -0.622 | -0.744* | -0.751** | -0.628* | -0.743* | -0.730** | ||
| lnER | 0.256* | 0.368** | 0.325* | 0.388* | -0.671* | 0.362* | 0.361* | 0.337** | 0.352* | 0.311* | ||
| lnGOVE·W | - | - | - | 1.288 | 0.344** | 0.731* | 0.952* | 0.782* | 0.817* | 0.942* | ||
| lnOPEN·W | - | - | - | -0.686** | 1.022 | 1.322 | ||||||
| lnSTU·W | - | - | - | 0.789* | -0.655** | -0.651** | ||||||
| lnINS·W | - | - | - | 0.032* | 0.746* | 0.720* | ||||||
| lnER·W | - | - | - | -1.499 | 0.051* | 0.043* | ||||||
| ρ | - | - | 0.245** | 0.116*** | - | 0.620 | 0.114*** | - | 0.535 | 0.118*** | ||
| R2-ad | 0.815 | 0.867 | 0.892 | 0.907 | 0.844 | 0.873 | 0.891 | 0.865 | 0.887 | 0.896 | ||
| Log-likelihood | - | 246.321 | 249.972 | 259.661 | 245.583 | 247.667 | 252.814 | 246.336 | 252.771 | 255.181 | ||
| 时间效应 | 固定 | 固定 | 固定 | 固定 | 固定 | 固定 | 固定 | 固定 | 固定 | 固定 | ||
| 个体效应 | 固定 | 固定 | 固定 | 固定 | 固定 | 固定 | 固定 | 固定 | 固定 | 固定 | ||
| 样本数 | 121 | 121 | 121 | 121 | 121 | 121 | 121 | 121 | 121 | 121 | ||
注:*、**、***分别表示在10%、5%、1%置信水平下显著。 |
| [1] |
王晓红. 关于建设粤港澳大湾区创新设计圈的建议[J]. 开放导报, 2017(4):29-31.
|
| [2] |
|
| [3] |
|
| [4] |
任耀, 牛冲槐, 牛彤, 等. 绿色创新效率的理论模型与实证研究[J]. 管理世界, 2014(7):176-177.
|
| [5] |
张峰, 任仕佳, 殷秀清. 高技术产业绿色技术创新效率及其规模质量门槛效应[J]. 科技进步与对策, 2020, 37(7):59-68.
|
| [6] |
韩晶. 中国区域绿色创新效率研究[J]. 财经问题研究, 2012(11):130-137.
|
| [7] |
冯志军. 中国工业企业绿色创新效率研究[J]. 中国科技论坛, 2013(2):82-88.
|
| [8] |
张菲菲, 张在旭, 马莹莹. 制造业绿色创新效率及增长趋势研究[J]. 技术经济与管理研究, 2020(2):101-107.
|
| [9] |
吴旭晓. 中国区域绿色创新效率演进轨迹及形成机理研究[J]. 科技进步与对策, 2019, 36(23):36-43.
|
| [10] |
胡玉凤, 丁友强. 碳排放权交易机制能否兼顾企业效益与绿色效率?[J]. 中国人口·资源与环境, 2020, 30(3):56-64.
|
| [11] |
吕岩威, 谢雁翔, 楼贤骏. 中国区域绿色创新效率时空跃迁及收敛趋势研究[J]. 数量经济技术经济研究, 2020, 37(5):78-97.
|
| [12] |
钱丽, 肖仁桥, 陈忠卫. 我国工业企业绿色技术创新效率及其区域差异研究——基于共同前沿理论和DEA模型[J]. 经济理论与经济管理, 2015(1):26-43.
|
| [13] |
彭甲超, 许荣荣, 付丽娜, 等. 长江经济带工业企业绿色创新效率的演变规律[J]. 中国环境科学, 2019, 39(11):4886-4900.
|
| [14] |
邝嫦娥, 文泽宙, 彭文斌. 影子经济影响绿色创新效率的门槛效应[J]. 经济地理, 2019, 39(7):184-193.
|
| [15] |
陈斌, 李拓. 财政分权和环境规制促进了中国绿色技术创新吗?[J]. 统计研究, 2020, 37(6):27-39.
|
| [16] |
郭进. 环境规制对绿色技术创新的影响——“波特效应”的中国证据[J]. 财贸经济, 2019, 40(3):147-160.
|
| [17] |
霍伟东, 李杰锋, 陈若愚. 绿色发展与FDI环境效应——从“污染天堂”到“污染光环”的数据实证[J]. 财经科学, 2019(4):106-119.
|
| [18] |
乔美华. 对外贸易对工业企业绿色创新效率的异质门槛效应[J]. 中国科技论坛, 2019(11):93-102.
|
| [19] |
肖仁桥, 沈路, 钱丽. “一带一路”沿线省份工业企业绿色创新效率及其影响因素研究[J]. 软科学, 2020, 34(8):37-43.
|
| [20] |
刘心怡. 粤港澳大湾区城市创新网络结构与分工研究[J]. 地理科学, 2020, 40(6):874-881.
|
| [21] |
吴志才, 张凌媛, 黄诗卉. 粤港澳大湾区旅游经济联系的空间结构及协同合作模式[J]. 地理研究, 2020, 39(6):1370-1385.
|
| [22] |
|
| [23] |
辜胜阻, 曹冬梅, 杨嵋. 构建粤港澳大湾区创新生态系统的战略思考[J]. 中国软科学, 2018(4):1-9.
|
| [24] |
张峰, 宋晓娜, 董会忠. 粤港澳大湾区制造业绿色竞争力指数测度与时空格局演化特征分析[J]. 中国软科学, 2019(10):70-89.
|
| [25] |
|
| [26] |
王巧, 佘硕, 曾婧婧. 国家高新区提升城市绿色创新效率的作用机制与效果识别——基于双重差分法的检验[J]. 中国人口·资源与环境, 2020, 30(2):129-137.
|
| [27] |
张仁杰, 董会忠. 基于省级尺度的中国工业生态效率的时空演变及影响因素[J]. 经济地理, 2020, 40(7):124-132,173.
|
| [28] |
李雪松, 曾宇航. 中国区域创新型绿色发展效率测度及其影响因素[J]. 科技进步与对策, 2020, 37(3):33-42.
|
| [29] |
易明, 程晓曼. 长江经济带城市绿色创新效率时空分异及其影响因素[J]. 城市问题, 2018(8):31-39.
|
| [30] |
朱金鹤, 王雅莉. 创新补偿抑或遵循成本?污染光环抑或污染天堂?——绿色全要素生产率视角下双假说的门槛效应与空间溢出效应检验[J]. 科技进步与对策, 2018, 35(20):46-54.
|
| [31] |
周杰琦, 梁文光, 张莹. 全球化、自主研发与雾霾污染——机理分析及中国经验[J]. 科技进步与对策, 2020(18):18-27.
|
| [32] |
张利国, 冷浪平, 曾永明. 长江经济带城市创新能力时空演变及驱动因素分析——基于流动人力资本视角[J]. 当代财经, 2020(2):14-26.
|
| [33] |
熊曦, 张陶, 段宜嘉, 等. 长江中游城市群绿色化发展水平测度及其差异[J]. 经济地理, 2019, 39(12):96-102.
|
| [34] |
陈立泰, 李金林, 叶长华, 等. 长江经济带城市群产业结构变迁对生态效率的影响研究:2006—2014[J]. 数理统计与管理, 2020, 39(2):206-222.
|
| [35] |
于鹏, 李鑫, 张剑, 等. 环境规制对技术创新的影响及其区域异质性研究——基于中国省级面板数据的实证分析[J]. 管理评论, 2020, 32(5):87-95.
|
/
| 〈 |
|
〉 |