
Spatiotemporal Characteristics of Intercity Technology Transfer Network in the Yellow River Basin
Received date: 2019-12-27
Revised date: 2020-03-05
Online published: 2025-04-17
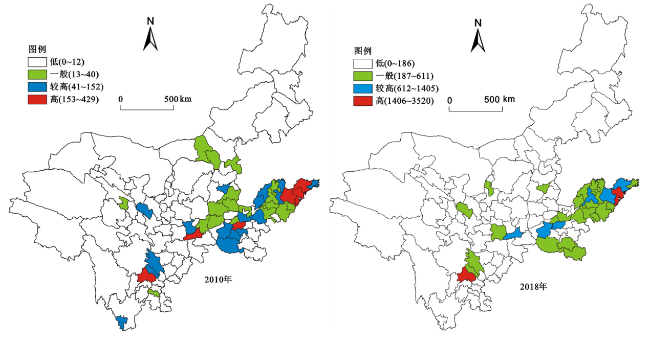
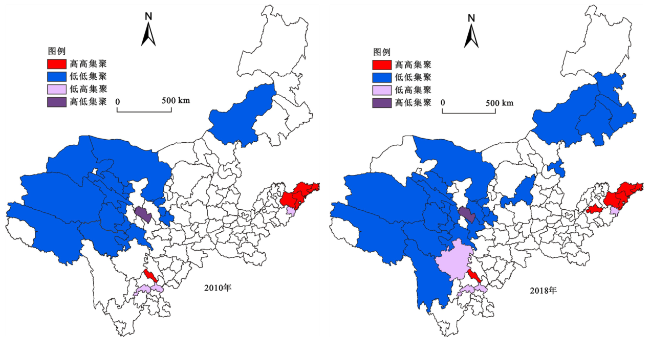
Based on the patent transaction data in 2010 and 2018,the spatial distribution pattern and social network structure characteristics of inter city technology transfer in the Yellow River Basin are studied by integrating GIS spatial analysis,spatial autocorrelation and social network analysis methods. The results show that: 1) The spatial polarization of inter city technology transfer intensity in the Yellow River Basin is significant. The high value areas are mainly distributed in Shandong,Henan and other provinces,while the low value areas are mainly distributed in Gansu,Qinghai,Inner Mongolia,Ningxia and other western provinces; 2) The spatial agglomeration characteristics of technology transfer activities in the Yellow River Basin are obvious. The spatial agglomeration patterns of technology transfer in and technology transfer out are similar. High and high agglomeration areas are mainly located in Deyang of Sichuan Province and some cities in the east of Shandong Province,while low and low agglomeration areas are mainly located in Qinghai,Sichuan,Gansu,Inner Mongolia and other provinces and cities; 3) From the perspective of regional interior,Chengdu,Xi'an,Zhengzhou and other provincial capitals are the core cities of the internal technology transfer network,with prominent core edge structure and less internal overall network density than the external ones; 4) The geographical proximity of technology transfer within the region is obvious. Technology transfer is mainly to the neighboring cities and cities,and the proportion of technology transfer within the cities is large in the total amount of technology transfer; 5) External perspective,both the Yellow River Basin from 2010 to 2018 for technology transfer,outside the territory or outside the area of the Yellow River Basin technology transfer,technology transfer and the number of strength are increased obviously,Jinan,Qingdao,Xi 'an,Zhengzhou,Chengdu to occupy the important position in the technology transfer outside the territory,and Beijing,Shenzhen,Guangzhou,Shanghai is one of the important node external to technology transfer in the Yellow River.
ZHANG Jianwei , LIANG Changan , HU Zhengyu , MA Huidan , MIAO Changhong . Spatiotemporal Characteristics of Intercity Technology Transfer Network in the Yellow River Basin[J]. Economic geography, 2020 , 40(5) : 58 -69 . DOI: 10.15957/j.cnki.jjdl.2020.05.007
表1 黄河流域内部技术转移网络点中心度Tab.1 Point centrality of technology transfer network in the Yellow River Basin |
| 2010年 | 2018年 | |||||||
|---|---|---|---|---|---|---|---|---|
| 地市 | 度数中心度 | 接近中心度 | 中间中心度 | 地市 | 度数中心度 | 接近中心度 | 中间中心度 | |
| 成都 | 16.667 | 1.895 | 17.042 | 成都 | 62.609 | 10.748 | 26.980 | |
| 青岛 | 9.649 | 1.889 | 8.986 | 青岛 | 46.957 | 10.570 | 9.064 | |
| 西安 | 8.772 | 1.892 | 12.287 | 郑州 | 43.478 | 10.522 | 9.464 | |
| 郑州 | 7.018 | 1.879 | 6.219 | 西安 | 35.652 | 10.445 | 6.428 | |
| 烟台 | 5.263 | 1.882 | 1.969 | 济南 | 28.696 | 10.370 | 2.210 | |
| 潍坊 | 4.386 | 1.876 | 3.196 | 潍坊 | 27.826 | 10.360 | 2.445 | |
| 兰州 | 4.386 | 1.877 | 4.070 | 济宁 | 26.087 | 10.342 | 2.597 | |
| 太原 | 4.386 | 0.909 | 0.155 | 临沂 | 25.217 | 10.314 | 1.379 | |
| 威海 | 3.509 | 1.874 | 0.320 | 太原 | 25.217 | 10.305 | 3.437 | |
| 许昌 | 3.509 | 1.875 | 2.180 | 淄博 | 23.478 | 10.277 | 3.176 | |
| 咸阳 | 2.632 | 1.875 | 0.565 | 烟台 | 22.609 | 10.268 | 0.700 | |
| 南阳 | 2.632 | 1.884 | 4.815 | 东营 | 20.000 | 10.250 | 1.845 | |
| 东营 | 1.754 | 1.862 | 1.140 | 洛阳 | 19.130 | 10.231 | 0.488 | |
| 临沂 | 1.754 | 1.871 | 0.081 | 新乡 | 19.130 | 10.240 | 0.786 | |
| 洛阳 | 1.754 | 1.863 | 0.016 | 滨州 | 18.261 | 10.177 | 0.916 | |
| 淄博 | 0.877 | 1.870 | 0.000 | 泰安 | 17.391 | 10.204 | 0.346 | |
| 德州 | 0.877 | 0.909 | 0.000 | 许昌 | 16.522 | 10.141 | 0.564 | |
| 新乡 | 0.877 | 1.845 | 0.000 | 绵阳 | 14.783 | 10.159 | 0.996 | |
| 绵阳 | 0.877 | 1.875 | 0.000 | 威海 | 13.043 | 10.159 | 0.155 | |
| 德阳 | 0.877 | 1.875 | 0.000 | 德阳 | 7.826 | 9.957 | 0.315 | |
表2 黄河流域内部技术转移网络整体网络密度Tab.2 The overall network density of the technology transfer network in the Yellow River Basin |
| 年份 | 网络关系数量(Ties) | 整体网络密度 | 整体网络关系标准差 |
|---|---|---|---|
| 2010 | 90 | 0.007 | 0.083 |
| 2018 | 638 | 0.048 | 0.213 |
表3 黄河流域内部技术转移网络核心—边缘分析结果Tab.3 Analysis results of core-edge of technology transfer network in the Yellow River Basin |
| 年份 | 区域 | 地市 | 联结密度 | |
|---|---|---|---|---|
| 2010 | 核心区 | 菏泽、西安、咸阳 | 13.167 | 0.030 |
| 边缘区 | 济南、青岛、烟台、兰州、酒泉、太原等113个城市 | 0.071 | 0.016 | |
| 2018 | 核心区 | 济南、青岛、潍坊、临沂、西安、郑州、成都 | 11.286 | 2.030 |
| 边缘区 | 淄博、枣庄、东营、烟台、济宁、泰安等108个城市 | 0.307 | 0.074 | |
表4 黄河流域与外部各地市构成的技术转移网络点中心度Tab.4 Technology transfer network point centrality of the Yellow River Basin and the cities outside |
| 2010年 | 2018年 | |||||||
|---|---|---|---|---|---|---|---|---|
| 地市 | 度数中心度 | 接近中心度 | 中间中心度 | 地市 | 度数中心度 | 接近中心度 | 中间中心度 | |
| 北京市 | 22.513 | 1.862 | 22.782 | 北京市 | 26.168 | 11.363 | 4.321 | |
| 深圳市 | 6.806 | 1.848 | 5.940 | 深圳市 | 25.857 | 11.347 | 4.614 | |
| 上海市 | 11.518 | 1.853 | 8.265 | 广州市 | 20.249 | 11.189 | 2.275 | |
| 哈尔滨市 | 1.571 | 1.829 | 0.827 | 上海市 | 21.495 | 11.220 | 2.323 | |
| 广州市 | 5.759 | 1.843 | 2.189 | 绍兴市 | 23.676 | 11.283 | 2.930 | |
| 台州市 | 0.524 | 1.828 | 0.000 | 重庆市 | 19.626 | 11.173 | 1.599 | |
| 杭州市 | 3.665 | 1.841 | 1.561 | 泉州市 | 19.003 | 11.157 | 1.678 | |
| 天津市 | 5.236 | 1.839 | 2.611 | 南通市 | 21.495 | 11.236 | 2.299 | |
| 保定市 | 2.094 | 1.834 | 0.382 | 温州市 | 21.184 | 11.220 | 2.145 | |
| 重庆市 | 3.141 | 1.832 | 2.628 | 佛山市 | 16.199 | 11.096 | 1.118 | |
| 南京市 | 3.665 | 1.836 | 1.288 | 苏州市 | 17.134 | 11.119 | 1.328 | |
| 无锡市 | 3.665 | 1.837 | 1.229 | 天津市 | 17.757 | 11.127 | 1.605 | |
| 珠海市 | 1.047 | 1.816 | 0.059 | 保定市 | 8.411 | 10.856 | 0.305 | |
| 郴州市 | 0.524 | 0.524 | 0.000 | 杭州市 | 13.707 | 11.020 | 0.948 | |
| 东莞市 | 2.618 | 1.835 | 0.376 | 台州市 | 16.511 | 11.103 | 1.361 | |
| 福州市 | 2.094 | 1.834 | 0.239 | 东莞市 | 15.265 | 11.065 | 1.206 | |
| 沈阳市 | 2.094 | 1.833 | 1.299 | 南京市 | 14.019 | 11.020 | 0.876 | |
| 苏州市 | 3.141 | 1.836 | 0.542 | 合肥市 | 14.330 | 11.042 | 0.942 | |
| 温州市 | 3.141 | 1.834 | 1.437 | 宁波市 | 16.199 | 11.088 | 1.087 | |
| 厦门市 | 1.047 | 1.806 | 0.029 | 武汉市 | 12.150 | 10.982 | 0.669 | |
表5 黄河流域与外部技术转移网络之间的整体网络密度Tab.5 The overall network density between the Yellow River Basin and the external technology transfer network |
| 年份 | 网络关系数量(Ties) | 整体网络密度 | 整体网络关系标准差 |
|---|---|---|---|
| 2010 | 261 | 0.014 | 0.118 |
| 2018 | 3 145 | 0.061 | 0.239 |
表6 黄河流域内外部技术转移网络核心—边缘分析结果Tab.6 Results of core-edge analysis of technology transfer network in and outside the Yellow River Basin |
| 时间 | 区域 | 地市 | 联结密度 | |
|---|---|---|---|---|
| 2010 | 核心区 | 北京、深圳、西安、晋城、成都 | 9.000 | 0.429 |
| 边缘区 | 济南、青岛、太原、绵阳、南京、苏州、金华、宁波、绍兴、中山、东莞、厦门、重庆、长沙、滨州、宜宾、清远、无锡、廊坊、武汉…… | 0.429 | 0.019 | |
| 2018 | 核心区 | 北京、青岛、广州、西安、深圳、成都 | 76.400 | 0.042 |
| 边缘区 | 重庆、拉萨、佛山、珠海、南京、扬州、湖州、宁波、太原、沈阳、临沂、菏泽、咸阳、南充、廊坊、长沙、桂林、台湾、武汉、厦门…… | 3.421 | 0.164 | |
| [1] |
杜德斌. 全球科技创新中心:动力与模式[M]. 上海: 上海人民出版社, 2015.
|
| [2] |
|
| [3] |
刘承良, 桂钦昌, 段德忠, 等. 全球科研论文合作网络的结构异质性及其邻近性机理[J]. 地理学报, 2017, 72(4):737-752.
|
| [4] |
|
| [5] |
|
| [6] |
|
| [7] |
|
| [8] |
|
| [9] |
吕拉昌, 梁政骥, 黄茹. 中国主要城市间的创新联系研究[J]. 地理科学, 2015, 35(1):30-37.
|
| [10] |
李丹丹, 汪涛, 周辉. 基于不同时空尺度的知识溢出网络结构特征研究[J]. 地理科学, 2013, 33(10):1180-1 187.
|
| [11] |
李丹丹, 汪涛, 魏也华, 等. 中国城市尺度科学知识网络与技术知识网络结构的时空复杂性[J]. 地理研究, 2015, 34(3):525-540.
|
| [12] |
|
| [13] |
马海涛. 基于人才流动的城市网络关系构建[J]. 地理研究, 2017, 36(1):161-170.
|
| [14] |
盛亚. 中国技术转移的理论与实际问题[J]. 科学管理研究, 1994, 12(6):40-43.
|
| [15] |
陈艾华, Patton Donald, Kenney Martin. 中国大学技术转移前沿理论动态:学术背景与理论焦点[J]. 科学学与科学技术管理, 2017, 38(4):16-23.
|
| [16] |
饶凯, 孟宪飞,
|
| [17] |
饶凯, 孟宪飞,
|
| [18] |
罗德明, 周嫣然, 史晋川. 南北技术转移、专利保护与经济增长[J]. 经济研究, 2015(6):46-58.
|
| [19] |
罗思平, 于永达. 技术转移、“海归”与企业技术创新:基于中国光伏产业的实证研究[J]. 管理世界, 2012(11):124-132.
|
| [20] |
|
| [21] |
|
| [22] |
|
| [23] |
|
| [24] |
刘承良, 管明明, 段德忠. 中国城际技术转移网络的空间格局及影响因素[J]. 地理学报, 2018, 73(8):1462-1 477.
|
| [25] |
段德忠, 杜德斌, 谌颖, 等. 中国城市创新技术转移格局与影响因素[J]. 地理学报, 2018, 73(4):738-754.
|
| [26] |
刘承良, 牛彩澄. 东北三省城际技术转移网络的空间演化及影响因素[J]. 地理学报, 2019, 74(10):2092-2 107.
|
| [27] |
李天放, 冯锋. 跨区域技术转移网络测度与治理研究:基于共生理论视角[J]. 科学学研究, 2013, 31(5):684-693.
|
| [28] |
任龙, 姜学民, 傅晓晓. 基于专利权转移的中国区域技术流动网络研究[J]. 科学学研究, 2016, 34(7):993-1 004.
|
| [29] |
段德忠, 杜德斌, 谌颖, 等. 中国城市创新技术转移格局与影响因素[J]. 地理学报, 2018, 73(4):738-754.
|
| [30] |
苏建军, 朱海艳. 中国旅游投资水平的时空格局演变及驱动因素分析[J]. 世界地理研究, 2019, 28(4):144-155.
|
| [31] |
王雪峰, 温彦平. 湖南省人口城镇化与土地城镇化空间格局演化及协调性研究[J]. 湖南师范大学自然科学学报, 2019, 42(5):34-43.
|
| [32] |
韩兆洲, 操咏慧, 方泽润. 区域创新水平综合评价及空间相关性研究——以粤港澳大湾区为例[J]. 统计与决策, 2019, 35(23):128-133.
|
| [33] |
|
/
| 〈 |
|
〉 |


