
Relationship between Different Agglomeration Types and the Dynamics of New Enterprises in the Central Region
Received date: 2019-07-04
Revised date: 2020-02-23
Online published: 2025-04-17
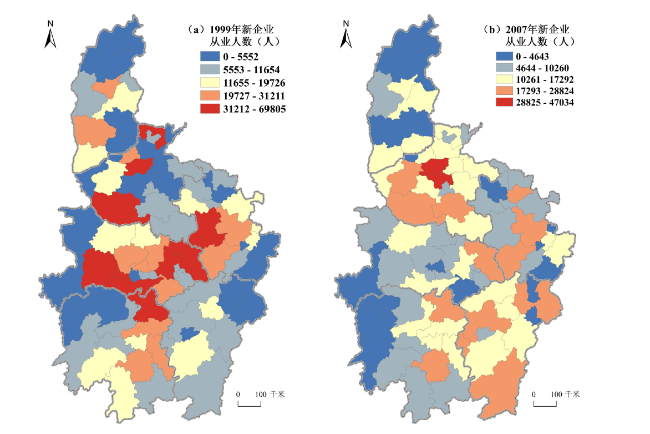
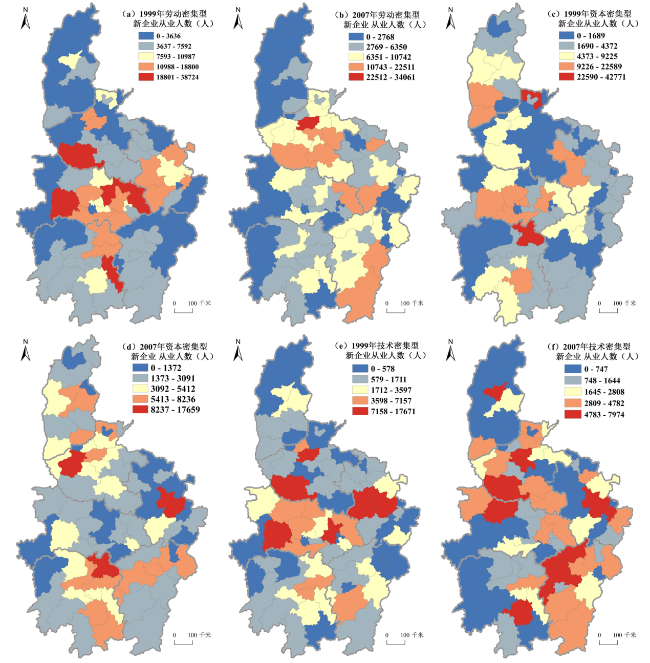
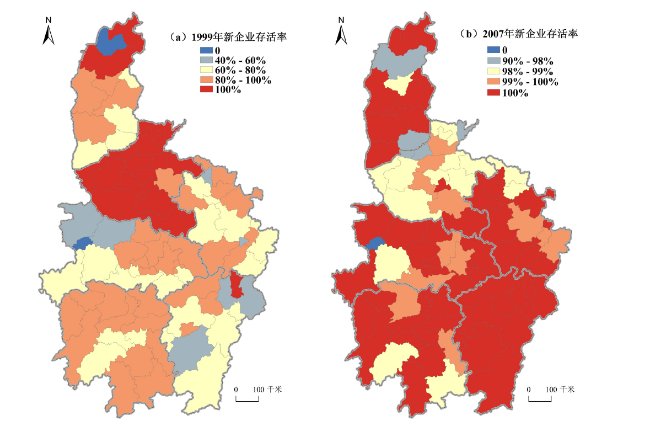
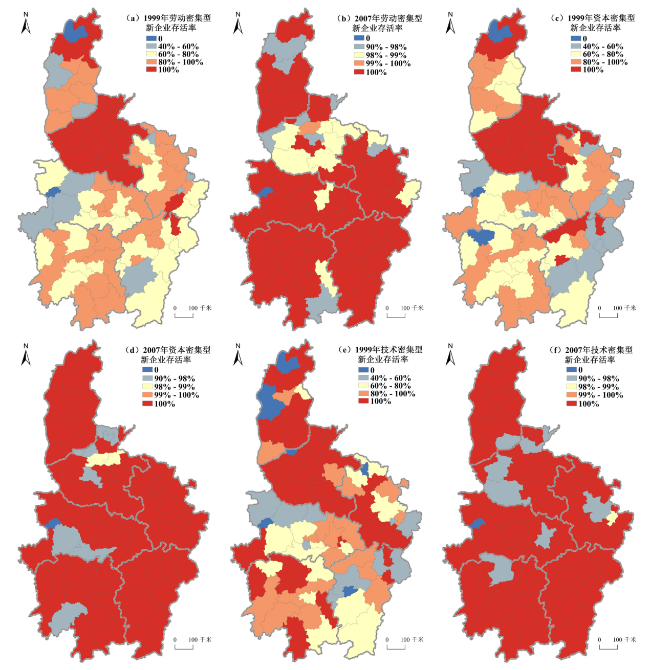
This paper studies the temporal and spatial characteristics of the dynamic changes of new enterprises in the central cities from 1999 to 2007 from the perspectives of new enterprise entry and survival. Further,the econometric model is constructed to examine the relationship between different agglomeration types and new enterprise dynamics. The study found the following conclusions: 1) New enterprises in Hubei and Anhui have a large scale of new enterprise entry,while those in Jiangxi and Henan have obvious improvement. The spatial distribution characteristics of labor-intensive and capital-intensive new enterprises are similar,and the concentration of technology-intensive new enterprises is higher,mainly distributed in regional central cities. From 1999 to 2007,the average survival rate of the manufacturing industry and different intensive new enterprises has greatly improved;among them,the survival rate of new enterprises in Henan was significantly higher in 1999,while the survival rates of Shanxi,Hubei,Hunan,Anhui and Jiangxi increased significantly in 2007. 2) Different types of agglomeration can promote the entry and survival of new enterprises,but the positive impact of diversity and related diversity on the entry and survival of new enterprises is greater than that of specialization. From the perspective of different industry types,specialization,diversity and related diversity have a greater positive impact on the entry of technology-intensive new enterprises than non-technology-intensive new enterprises,and the related diversity is more conducive to the survival of new technology-intensive enterprises. 3) In the process of undertaking the transfer of industries,the central region should actively introduce new industries with development potential according to regional endowments and increase the level of regional industrial diversity. It is also necessary to strengthen the selection of new enterprises on the basis of the characteristics of regional industrial structure,and focus on introducing or developing industries with a high degree of relevance to local technology. For new enterprises with high technology intensity,more attention should be paid to the effects of industrial diversity and technological relatedness on enterprise entry and survival.
ZHANG Yan , HU Zhiqiang , MIAO Changhong . Relationship between Different Agglomeration Types and the Dynamics of New Enterprises in the Central Region[J]. Economic geography, 2020 , 40(5) : 155 -164 . DOI: 10.15957/j.cnki.jjdl.2020.05.017
表1 变量定义与解释Tab.1 Variable definition and interpretation |
| 变量类型 | 变量 | 指标 | 变量代码 | |
|---|---|---|---|---|
| 模型1 | 被解释变量 | 新企业进入 | 新企业从业人员数 | entry |
| 解释变量 | 专业化 | 专业化指数 | rzi | |
| 多样性 | 多样性指数 | rdi | ||
| 相关多样性 | 技术关联指数 | relation | ||
| 控制变量 | 外资比重 | 外资企业数量占所在三位数行业所有企业的比重 | fdi | |
| 补贴比例 | 补贴企业数量占所在三位数行业所有企业的比重 | subsidy | ||
| 大企业比重 | 大企业数量占所在三位数行业所有大企业的比重 | scale | ||
| 模型2 | 被解释变量 | 新企业存活 | 新企业在t+1年是否存活 | survival |
| 解释变量 | 专业化 | 专业化指数 | rzi | |
| 多样性 | 多样性指数 | rdi | ||
| 相关多样性 | 技术关联指数 | relation | ||
| 控制变量 | 外资 | 是否为外资企业 | wfdi | |
| 补贴 | 是否为补贴企业 | wsubsidy | ||
| 企业规模 | 就业人数 | wscale |
表2 新企业进入模型的自变量相关系数Tab.2 Independent variable correlation coefficient of new enterprise entry model |
| 变量 | rzi | lnrdi | relation | scale | fdi | bt |
|---|---|---|---|---|---|---|
| rzi | 1.0000 | |||||
| lnrdi | -0.1740*** | 1.0000 | ||||
| relation | -0.0108*** | 0.5081*** | 1.0000 | |||
| scale | 0.2364*** | 0.0474*** | 0.0519*** | 1.0000 | ||
| fdi | 0.0344*** | 0.0589*** | 0.0434*** | 0.0754*** | 1.0000 | |
| bt | 0.0514*** | 0.0384*** | 0.0197*** | 0.1567*** | 0.0790*** | 1.0000 |
表3 新企业存活模型的自变量相关系数Tab.3 Independent variable correlation coefficient of new enterprise survival model |
| 变量 | rzi | lnrdi | relation | scale | fdi | bt |
|---|---|---|---|---|---|---|
| rzi | 1.0000 | |||||
| lnrdi | -0.1991*** | 1.0000 | ||||
| relation | -0.0836*** | 0.6056*** | 1.0000 | |||
| scale | 0.0901*** | -0.0088*** | -0.0210*** | 1.0000 | ||
| fdi | 0.0114*** | 0.0309*** | 0.0308*** | 0.0584*** | 1.0000 | |
| bt | -0.0068*** | 0.0177*** | -0.0009*** | 0.1119*** | 0.0454*** | 1.0000 |
表4 专业化、多样性、相关多样性与新企业进入的回归结果Tab.4 Regression results of specialization, diversity,related diversity and new enterprise entry |
| 模型1(OUTPUT) | ||
|---|---|---|
| rzi | 0.047*** | |
| rdi | 0.167*** | |
| relation | 1.136*** | |
| scale | 1.845*** | 2.008*** |
| fdi | -0.020 | 0.017 |
| subsidy | -0.034 | -0.005 |
| Con | 2.557*** | 4.078*** |
| R-squared | 0.225 | 0.209 |
| F-statistic | 1 523.886 | 1 729.757 |
| Prob(F-statistic) | 0.000 | 0.000 |
| 回归样本 | 26 746 | 26 746 |
表5 专业化、多样性、相关多样性与新企业生存的回归结果Tab.5 Regression results of specialization,diversity,related diversity and new enterprise survival |
| 模型2(SURVIVAL) | ||
|---|---|---|
| rzi | 0.004*** | |
| rdi | 0.020** | |
| relation | 0.312*** | |
| wscale | 0.052*** | 0.055*** |
| wfdi | 0.008 | 0.005 |
| wsubsidy | 0.122*** | 0.123*** |
| Con | 0.750*** | 0.860*** |
| Loglikelihood | -27 787.610 | -27 721.910 |
| LR-statistic | 53.749 | 81.489 |
| Prob(LR-statistic) | 0.000 | 0.000 |
| 回归样本 | 64 076 | 64 076 |
表6 专业化、多样性、技术关联与不同类型新企业进入的回归结果Tab.6 Regression results of specialization,diversity,related diversity and different types of new enterprise entry |
| 模型3(OUTPUT) | ||||
|---|---|---|---|---|
| 技术密集型 | 非技术密集型 | |||
| rzi | 0.051*** | 0.046*** | ||
| rdi | 0.198*** | 0.168** | ||
| relation | 1.168*** | 1.130*** | ||
| scale | 1.682*** | 1.878*** | 1.885*** | 2.043*** |
| fdi | 0.211* | 0.256** | -0.077 | -0.042 |
| subsidy | 0.118 | 0.167** | -0.060 | -0.038 |
| Con | 2.082*** | 3.958*** | 2.574*** | 4.104*** |
| R-squared | 0.234 | 0.215 | 0.225 | 0.209 |
| F-statistic | 314.284 | 350.372 | 1 228.182 | 1 395.668 |
| Prob(F-statistic) | 0.000 | 0.000 | 0.000 | 0.000 |
| 回归样本 | 5 275 | 5 275 | 21 471 | 21 471 |
表7 专业化、多样性、技术关联与不同类型新企业生存的回归结果Tab.7 Regression results of specialization,diversity,related diversity and different types of new enterprise survival |
| 模型4(SURVIVAL) | ||||
|---|---|---|---|---|
| 技术密集型 | 非技术密集型 | |||
| rzi | 0.008*** | 0.003** | ||
| rdi | -0.025 | 0.028*** | ||
| relation | 0.392*** | 0.297*** | ||
| wscale | 0.004 | 0.065 | 0.061*** | 0.055*** |
| wfdi | 0.013 | 0.134 | 0.006 | -0.035 |
| wsubsidy | 0.087 | 0.047 | 0.129*** | 0.137*** |
| Con | 1.295*** | 0.885 | 0.646 | 0.855 |
| Loglikelihood | -4 435.329 | -4 292.159 | -23 344.200 | -23 417.750 |
| LR-statistic | 13.217 | 18.385 | 51.328 | 67.550 |
| Prob(LR-statistic) | 0.021 | 0.001 | 0.000 | 0.000 |
| 回归样本 | 10 543 | 10 543 | 53 533 | 53 533 |
| [1] |
|
| [2] |
朱晟君, 王翀. 制造业重构背景下的中国经济地理研究转向[J]. 地理科学进展, 2018, 37(7):865-879.
|
| [3] |
|
| [4] |
|
| [5] |
|
| [6] |
|
| [7] |
梁强, 邹立凯, 宋丽红, 等. 组织印记、生态位与新创企业成长——基于组织生态学视角的质性研究[J]. 管理世界, 2017(6):141-154.
|
| [8] |
|
| [9] |
|
| [10] |
|
| [11] |
|
| [12] |
周浩, 余壮雄, 杨铮. 可达性、集聚和新建企业选址——来自中国制造业的微观证据[J]. 经济学(季刊), 2015, 14(4):1393-1 416.
|
| [13] |
史进, 贺灿飞. 中国新企业成立空间差异的影响因素——以金属制品业为例[J]. 地理研究, 2018, 37(7):1282-1 296.
|
| [14] |
|
| [15] |
|
| [16] |
黎斌, 贺灿飞, 周沂. 相关多样化、地方政府竞争与中国重化工业企业动态[J]. 经济地理, 2016, 36(6):91-99.
|
| [17] |
|
| [18] |
|
| [19] |
|
| [20] |
|
| [21] |
|
| [22] |
|
| [23] |
|
| [24] |
薄文广. 外部性与产业增长:来自中国省级面板数据的研究[J]. 中国工业经济, 2007(1):37-44.
|
| [25] |
史进, 贺灿飞. 企业空间动态研究进展[J]. 地理科学进展, 2014, 33(10):1342-1 353.
|
| [26] |
阳立高, 龚世豪, 王铂, 等. 人力资本、技术进步与制造业升级[J]. 中国软科学, 2018(1):138-148.
|
| [27] |
|
| [28] |
|
| [29] |
|
| [30] |
|
| [31] |
刘鑫, 贺灿飞. 技术关联与城市产业增长研究[J]. 地理研究, 2016, 35(4):717-730.
|
| [32] |
文东伟. FDI、出口开放与中国省区产业增长[J]. 金融研究, 2013(6):104-117.
|
/
| 〈 |
|
〉 |