
Temporal and Spatial Coupling Coordination of Green Utilization Efficiency of Tourism Resources and New Urbanization in the Yangtze River Economic Belt
Received date: 2020-05-21
Revised date: 2021-03-26
Online published: 2025-04-13
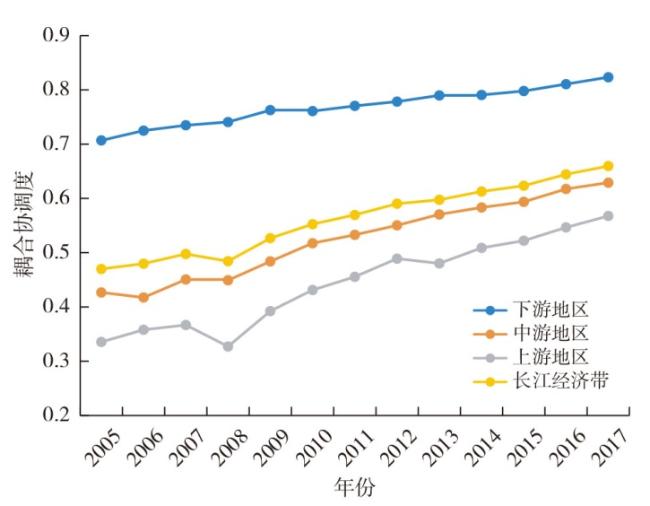
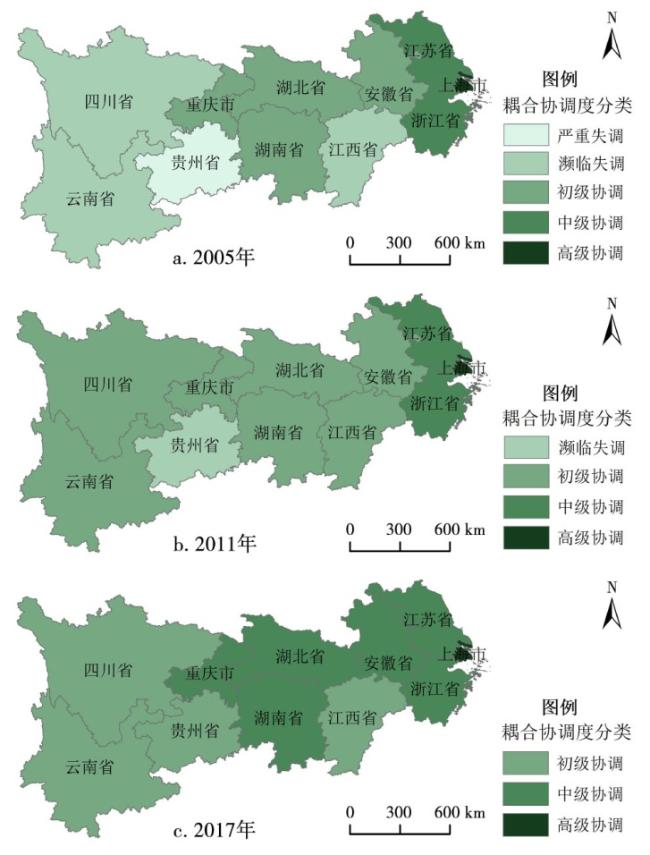
Taking the Yangtze River Economic Belt as the research object, this paper measures the development level of green utilization efficiency of tourism resources and new urbanization in the Yangtze River Economic Belt from 2005 to 2017 based on the super efficiency SBM model and entropy method. On this basis,the Markov chain is adopted to reveal the spatio-temporal evolution of their coupling coordinated development. The results show that: 1) The green utilization efficiency of tourism resources and new urbanization in the Yangtze River Economic Belt shows a fluctuating upward trend in 2005-2017,but their development level is still low,showing a large space for improvement and a prominent problem of unbalanced development. 2) During the study period,the coupling coordination degree between the green utilization efficiency of tourism resources and new-type urbanization in the Yangtze River Economic Belt presents a good development trend of fluctuation growth,what's more,the coupling coordination degree in the downstream region is high and the change trend is relatively gentle,with an average annual growth rate of only 1.28%. While the coupling coordination degree in the middle and upstream regions is low but the change range is relatively large,with an average annual growth rate of 3.29% and 4.48% respectively. 3) The spatial distribution of coupling coordination degree has remarkable regional difference, showing a gradual decreasing rule from the lower reaches to the upper reaches,and has obvious spatial agglomeration characteristics. The spatial evolution of coupling coordination types is large in middle and upper reaches of Yangtze River Economic Belt, and is stable in lower reaches. 4) The phenomenon of "club convergence" exists in the coupling coordination degree between green utilization efficiency of tourism resources and new-type urbanization in the Yangtze River Economic Belt,which has the stability on maintaining the original state. Moreover,its dynamic evolution is a relatively continuous and gradual process,and it is difficult to realize the leapfrog development in the short term.
SHAO Haiqin , WU Wei , WANG Zhaofeng . Temporal and Spatial Coupling Coordination of Green Utilization Efficiency of Tourism Resources and New Urbanization in the Yangtze River Economic Belt[J]. Economic geography, 2021 , 41(8) : 204 -213 . DOI: 10.15957/j.cnki.jjdl.2021.08.024
表1 耦合协调度等级划分Tab.1 The ranking of coordinating degree |
| 耦合协调度区间 | 协调度等级 | 耦合协调度区间 | 协调度等级 | |
|---|---|---|---|---|
| 0≤D<0.2 | 严重失调 | 0.2≤D<0.4 | 濒临失调 | |
| 0.4≤D<0.6 | 初级协调 | 0.6≤D<0.8 | 中级协调 | |
| 0.8≤D<1.0 | 高级协调 |
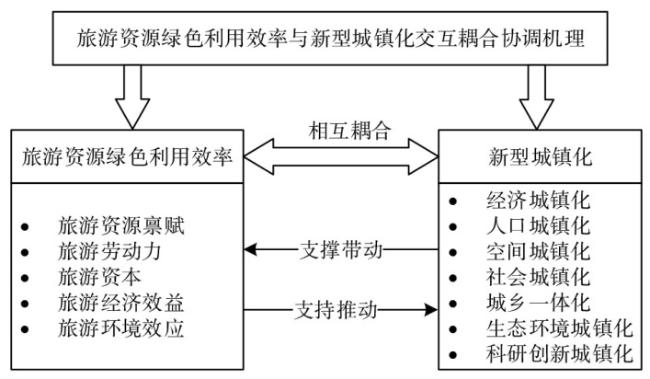
表2 旅游资源绿色利用效率与新型城镇化评价指标体系Tab.2 Evaluation index systems of green utilization efficiency of tourism resources and new urbanization |
| 目标层 | 准则层 | 指标层 | 指标属性 | 权重 |
|---|---|---|---|---|
| 旅游 资源 绿色 利用 效率 | 投入指标 | 旅游资源禀赋(个) | 正向 | \ |
| 旅游业从业人员数(人) | 正向 | \ | ||
| 旅游业固定资产投资额(万元) | 正向 | \ | ||
| 产出指标 | 旅游业总收入(亿元) | 正向 | \ | |
| 旅游业CO2排放量(万t) | 负向 | \ | ||
| 新 型 城 镇 化 水 平 | 人口城镇化 | 城镇人口比重(%) | 正向 | 0.034 |
| 全行业就业人数(万人) | 正向 | 0.032 | ||
| 第三产业就业人员比重(%) | 正向 | 0.016 | ||
| 每万人拥有大学生数(人) | 正向 | 0.026 | ||
| 经济城镇化 | 人均地区生产总值(元) | 正向 | 0.069 | |
| 第二产业占GDP比重(%) | 负向 | 0.023 | ||
| 第三产业占GDP比重(%) | 正向 | 0.036 | ||
| 人均社会消费品额(元) | 正向 | 0.053 | ||
| 城镇居民人均消费支出(元) | 正向 | 0.039 | ||
| 城镇居民人均可支配收入(元) | 正向 | 0.058 | ||
| 空间城镇化 | 建成区所占比重(%) | 正向 | 0.033 | |
| 人均拥有建成区面积(m2) | 正向 | 0.027 | ||
| 人均城市道路面积(m2) | 正向 | 0.031 | ||
| 社会城镇化 | 人均教育经费(元) | 正向 | 0.049 | |
| 教育经费占财政总支出比重(%) | 正向 | 0.032 | ||
| 每万人拥有卫生技术人员数(人) | 正向 | 0.043 | ||
| 每万人拥有医疗机构床位数(张) | 正向 | 0.033 | ||
| 每万人拥有公共交通车辆(标台) | 正向 | 0.018 | ||
| 城镇居民人均食品以外支出占比(%) | 正向 | 0.016 | ||
| 生态环境城镇化 | 污水处理率(%) | 正向 | 0.012 | |
| 城镇人均垃圾清运量(t) | 正向 | 0.046 | ||
| 建成区绿化覆盖率(%) | 正向 | 0.008 | ||
| 人均公园绿地面积(m2) | 正向 | 0.027 | ||
| 每万人拥有公共厕所(座) | 正向 | 0.030 | ||
| 城乡一体化 | 城乡居民人均可支配收入比(%) | 负向 | 0.016 | |
| 城乡居民人均消费水平比(%) | 负向 | 0.014 | ||
| 科研创新城镇化 | 科学支出占财政总支出比重(%) | 正向 | 0.087 | |
| 高等院校师生数(万人) | 正向 | 0.033 | ||
| 亿元GDP申请专利数(项) | 正向 | 0.059 |
表3 长江经济带旅游资源绿色利用效率与新型城镇化评价结果(2005—2017年)Tab.3 The green utilization efficiency of tourism resources and new urbanization in the Yangtze River Economic Belt(2005-2017) |
| 地区 | 2005 | 2009 | 2013 | 2017 | 均值 | ||||||||||
|---|---|---|---|---|---|---|---|---|---|---|---|---|---|---|---|
| 旅游资源绿 色利用效率 | 新型城镇 化水平 | 旅游资源绿 色利用效率 | 新型城镇 化水平 | 旅游资源绿 色利用效率 | 新型城镇 化水平 | 旅游资源绿 色利用效率 | 新型城镇 化水平 | 旅游资源绿 色利用效率 | 新型城镇 化水平 | ||||||
| 上海 | 1.832 | 0.531 | 1.913 | 0.627 | 1.853 | 0.637 | 1.931 | 0.685 | 1.900 | 0.604 | |||||
| 江苏 | 1.006 | 0.359 | 1.200 | 0.463 | 1.114 | 0.574 | 1.199 | 0.646 | 1.141 | 0.510 | |||||
| 浙江 | 1.027 | 0.425 | 1.059 | 0.496 | 1.098 | 0.603 | 1.124 | 0.681 | 1.070 | 0.544 | |||||
| 安徽 | 0.423 | 0.205 | 0.736 | 0.247 | 0.785 | 0.359 | 0.866 | 0.467 | 0.678 | 0.314 | |||||
| 江西 | 0.311 | 0.175 | 0.398 | 0.229 | 0.647 | 0.303 | 0.671 | 0.416 | 0.524 | 0.273 | |||||
| 湖北 | 0.466 | 0.287 | 0.440 | 0.300 | 0.768 | 0.375 | 0.818 | 0.471 | 0.626 | 0.350 | |||||
| 湖南 | 0.543 | 0.244 | 0.687 | 0.273 | 0.668 | 0.334 | 0.745 | 0.417 | 0.651 | 0.311 | |||||
| 四川 | 0.291 | 0.229 | 0.430 | 0.265 | 0.551 | 0.360 | 0.537 | 0.460 | 0.482 | 0.315 | |||||
| 重庆 | 0.556 | 0.180 | 0.553 | 0.236 | 0.600 | 0.351 | 0.750 | 0.437 | 0.615 | 0.299 | |||||
| 贵州 | 0.214 | 0.099 | 0.260 | 0.149 | 0.354 | 0.262 | 0.488 | 0.368 | 0.329 | 0.208 | |||||
| 云南 | 0.411 | 0.132 | 0.319 | 0.194 | 0.372 | 0.272 | 0.606 | 0.377 | 0.418 | 0.242 | |||||
| 上游 | 0.368 | 0.160 | 0.391 | 0.211 | 0.469 | 0.311 | 0.596 | 0.410 | 0.461 | 0.266 | |||||
| 中游 | 0.436 | 0.228 | 0.565 | 0.262 | 0.717 | 0.343 | 0.775 | 0.443 | 0.620 | 0.312 | |||||
| 下游 | 1.288 | 0.438 | 1.391 | 0.529 | 1.355 | 0.605 | 1.418 | 0.671 | 1.370 | 0.553 | |||||
| 长江经济带 | 0.644 | 0.260 | 0.727 | 0.316 | 0.801 | 0.403 | 0.885 | 0.493 | 0.767 | 0.361 | |||||
注:篇幅所限,没有列出全部年份的旅游资源绿色利用效率,表中均值是指算术平均值。 |
表4 2005—2017年长江经济带旅游资源绿色利用效率与新型城镇化耦合协调度的马尔科夫转移矩阵Tab.4 Markov chain matrix of the coordination degree of green utilization efficiency of tourism resources and new urbanization in the Yangtze River Economic Belt in 2005-2017 |
| t / t+1 | Ⅰ | Ⅱ | Ⅲ | Ⅳ | Ⅴ |
|---|---|---|---|---|---|
| Ⅰ | 0.866 | 0.134 | 0.000 | 0.000 | 0.000 |
| Ⅱ | 0.171 | 0.636 | 0.193 | 0.000 | 0.000 |
| Ⅲ | 0.000 | 0.172 | 0.591 | 0.237 | 0.000 |
| Ⅳ | 0.000 | 0.000 | 0.197 | 0.682 | 0.121 |
| Ⅴ | 0.000 | 0.000 | 0.000 | 0.091 | 0.909 |
| [1] |
王坤, 黄震方. 区域旅游经济与城镇化耦合协调发展空间格局及驱动机制——以长三角地区为例[J]. 南京师大学报:自然科学版, 2016, 39(1):101-107,116.
|
| [2] |
唐鸿, 刘雨婧, 麻学锋. 旅游业与新型城镇化协调发展效应评价——以张家界为例[J]. 经济地理, 2017, 37(2):216-223.
|
| [3] |
张广海, 龚荷. 江浙沪地区旅游发展不一致现象及旅游资源效率定量研究[J]. 资源开发与市场, 2015, 31(9):1131-1136.
|
| [4] |
孙才志, 姜坤, 赵良仕. 中国水资源绿色效率测度及空间格局研究[J]. 自然资源学报, 2017, 32(12):1999-2011.
|
| [5] |
|
| [6] |
|
| [7] |
葛敬炳, 陆林, 凌善金. 丽江市旅游城市化特征及机理分析[J]. 地理科学, 2009, 29(1):134-140.
|
| [8] |
黄郁成, 金茨萍. 旅游开发与农村城市化的现实模式研究——以江西井冈山市为例[J]. 地域研究与开发, 2009(3):76-79.
|
| [9] |
|
| [10] |
陆林, 於冉, 朱付彪, 等. 基于社会学视野的黄山市汤口镇旅游城市化特征和机制研究[J]. 人文地理, 2010, 25(6):19-24.
|
| [11] |
|
| [12] |
|
| [13] |
张广海, 赵韦舒. 中国新型城镇化与旅游化互动效应及其空间差异[J]. 经济地理, 2017, 37(1):196-204.
|
| [14] |
|
| [15] |
|
| [16] |
|
| [17] |
杨秀平, 张大成. 旅游经济与新型城镇化耦合协调关系研究——以兰州市为例[J]. 生态经济, 2018, 34(8):112-117.
|
| [18] |
|
| [19] |
余凤龙, 黄震方, 曹芳东. 中国城镇化进程对旅游经济发展的影响[J]. 自然资源学报, 2014, 29(8):1297-1309.
|
| [20] |
王坤, 黄震方, 余凤龙, 等. 中国城镇化对旅游经济影响的空间效应——基于空间面板计量模型的研究[J]. 旅游学刊, 2016, 31(5):15-25.
|
| [21] |
王新越, 刘二恋, 候娟娟. 山东省旅游城镇化响应的时空分异特征与类型研究[J]. 地理科学, 2017, 37(7):1087-1094.
|
| [22] |
麻学锋, 刘玉林. 基于三要素的张家界旅游城镇化响应测度及影响机制[J]. 地理科学, 2018, 38(8):1346-1356.
|
| [23] |
王兆峰, 余含. 基于交通改善的湘西旅游城镇化响应时空分异与机制研究[J]. 经济地理, 2013, 33(1):187-192.
|
| [24] |
王新越, 伍烨轩. 中国东部地区国内旅游消费与城镇化协调关系研究[J]. 地理科学, 2018, 38(7):1139-1147.
|
| [25] |
杨士弘, 廖重斌, 郑宗清. 城市生态环境学[M]. 北京: 科学出版社, 1996.
|
| [26] |
杨传开, 张凡, 宁越敏. 山东省城镇化发展态势及其新型城镇化路径[J]. 经济地理, 2015, 35(6):54-60.
|
| [27] |
张军涛, 吴俣. 旅游产业发展质量与新型城镇化耦合协调关系实证研究——以深圳市为例[J]. 辽宁大学学报:哲学社会科学版, 2017, 45(6):77-85.
|
| [28] |
|
| [29] |
肖黎明, 张仙鹏. 强可持续理念下绿色创新效率与生态福利绩效耦合协调的时空特征[J]. 自然资源学报, 2019, 34(2):312-324.
|
| [30] |
盛骤, 谢式千, 潘承毅. 概率论与数理统计(第二版)[M]. 北京: 高等教育出版社, 1989.
|
| [31] |
方叶林, 黄震方, 张宏, 等. 省域旅游发展的错位现象及旅游资源相对效率评价——以中国大陆31省市区2000—2009年面板数据为例[J]. 自然资源学报, 2013, 28(10):1754-1764.
|
| [32] |
马海良, 丁元卿, 王蕾. 绿色水资源利用效率的测度和收敛性分析[J]. 自然资源学报, 2017, 32(3):406-417.
|
| [33] |
王胜鹏, 乔花芳, 冯娟, 等. 黄河流域旅游生态效率时空演化及其与旅游经济互动响应[J]. 经济地理, 2020, 40(5):81-89.
|
| [34] |
王兆峰, 刘庆芳. 长江经济带旅游生态效率时空演变及其与旅游经济互动响应[J]. 自然资源学报, 2019, 34(9):1945-1961.
|
| [35] |
王凯, 邵海琴, 周婷婷, 等. 中国旅游业碳排放效率及其空间关联特征[J]. 长江流域资源与环境, 2018, 27(3):473-482.
|
| [36] |
王越新, 宋飏, 宋斐红, 等. 山东省新型城镇化的测度与空间分异研究[J]. 地理科学, 2014, 34(9):1069-1076.
|
/
| 〈 |
|
〉 |