
Dynamics of the City Rank-Size in Chengdu-Chongqing Urban Agglomeration: Based on the Rank Clock Approach
Received date: 2020-01-06
Revised date: 2020-09-30
Online published: 2025-04-11
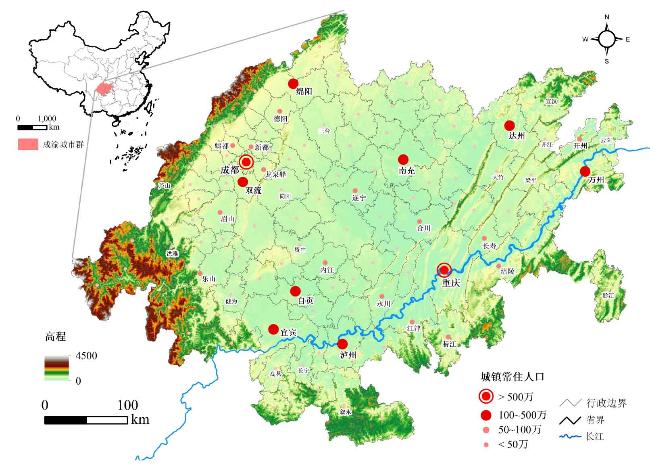
Based on the urban land data of Chengdu-Chongqing urban agglomeration from 1980 to 2015 and applying the rank clock approach,this paper analyzes the spatio-temporal dynamics of the city size in this urban agglomeration on different scales,and discusses the major driving factors. The results shows that the city rank of Chengdu-Chongqing urban agglomeration has fluctuated greatly since the Reform and Opening-up,with the average change in city rank reaching 20. Among all the cities,the ranks of mega-cities remain stable. Contrary to the medium-sized cities,the ranks of large and small cities keep declining. The annual average changes of the above four-type cities are 0,-14.9,1.8 and 3.8 respectively. Socioeconomic development,policies and geographical characteristics jointly affect the changes of the ranks among cities. The "siphon" effect of mega-cities is still prominent,while the "trickle-down" effect is not obvious. The ratios of average urban population to GDP in mega-cities and large cities were 7.6 and 5.4 respectively in 1990, and increased to 8.7 and 9.4 in 2015. Since 2000,a series of policies encouraging the development of small and medium-sized cities has driven the rise of medium-sized cities. However,due to restricted terrain and infrastructure,the ranks of small cities declined. In the future,attention should be paid to large cities such as Mianyang and Nanchong,which can assimilate the diffusion and transfer from megacities and drive the development of neighboring small and medium-sized cities.
HAN Jianping , HUANG Qingxu , HE Chunyang , ZHU Lei , GOU Siyuan . Dynamics of the City Rank-Size in Chengdu-Chongqing Urban Agglomeration: Based on the Rank Clock Approach[J]. Economic geography, 2020 , 40(12) : 48 -55 . DOI: 10.15957/j.cnki.jjdl.2020.12.006
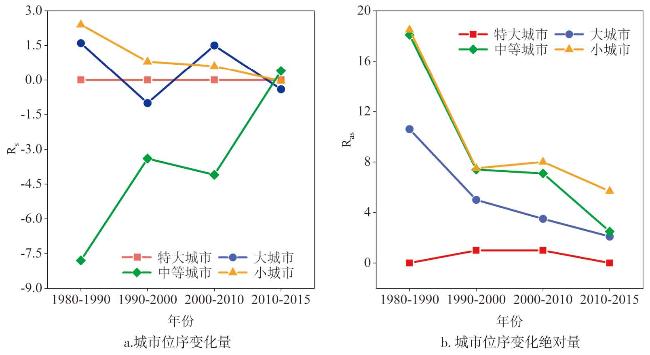
表1 成渝城市群1980—2015年城市位序变化Tab.1 City rank changes in Chengdu-Chongqing urban agglomeration in 1980-2015 |
| 时间 | 特大城市 | 大城市 | 中等城市 | 小城市 | 城市群 | |||||||||
|---|---|---|---|---|---|---|---|---|---|---|---|---|---|---|
| Rs | Ras | Rs | Ras | Rs | Ras | Rs | Ras | Rs | Ras | |||||
| 1980—2015 | 0 | 0 | 1.8 | 9.8 | -14.9 | 21.9 | 3.8 | 20.7 | 0 | 19.7 | ||||
| 1980—1990 | 0 | 0 | 1.6 | 10.6 | -7.8 | 18.1 | 2.4 | 18.5 | 0 | 17.5 | ||||
| 1990—2000 | 0 | 1 | -1.0 | 5.0 | -3.4 | 7.4 | 0.8 | 7.5 | 0 | 7.1 | ||||
| 2000—2010 | 0 | 1 | 1.5 | 3.5 | -4.1 | 7.1 | 0.6 | 8.0 | 0 | 7.4 | ||||
| 2010—2015 | 0 | 0 | -0.4 | 2.1 | 0.4 | 2.5 | -0.04 | 5.7 | 0 | 4.9 | ||||
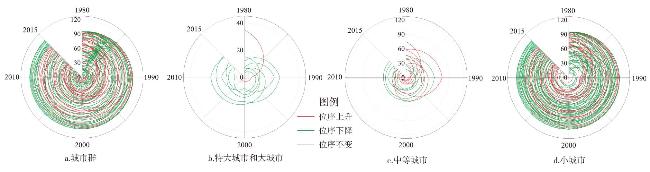
图2 成渝城市群1980—2015年位序钟Fig.2 The rank clock of cities in Chengdu-Chongqing urban agglomeration in 1980-2015 |
表2 社会经济发展和政策差异对不同规模城市的影响Tab.2 The impacts of socioeconomic development and policy differences on cities with different sizes |
| 社会经济发展的差异 | 城市发展政策 | |
|---|---|---|
| 特大城市 | 社会经济的快速增长促进城市规模在特大城市集聚。1990年,特大城市与城市群平均城市人口和GDP的比值分别为16.3和10.9,到2015年,两个比值约为19。 | 四川长期实行的强省会战略和1997年重庆直辖加快了特大城市的扩展速度,强化了规模聚集效应,进一步拉大了与大城市的规模差距。 |
| 大城市 | 社会经济增长较慢造成与特大城市的差距越来越大。特大城市与大城市城市人口和GDP的比值由1990年的7.6和5.4,扩大到2015年的8.7和9.4。 | 1980年全国城市规划工作会议提出“控制大城市规模”,1990年《中华人民共和国城市规划法》提出“严格控制大城市规模”。国家实施“控制大城市发展”的政策[28-29]。 |
| 中小城市 | 社会经济增长是城市群中最低的。1990年,中等城市的平均城市人口和GDP仅为特大城市的7.7%和13.2%,小城市仅为3.0%和6.0%。发展到2015年,中等城市的这两个比值约为7.7%,小城市均为2.8%。 | 2000年以来鼓励中小城市发展的政策对平原和浅丘地带的53座中小城市影响较大,其城市建成区面积上升,中等城市位序上升。但在城市群东北部和西南部偏远地区,政策效应不明显,仍有56座中小城市位序下降。 |
注:城镇常住人口、GDP数据来源于《四川统计年鉴》《重庆统计年鉴》(1991、2001、2016)和同期《中国县域统计年鉴》。 |
| [1] |
|
| [2] |
许学强, 周一星, 宁越敏. 城市地理学(第二版)[M]. 北京: 高等教育出版社, 2009.
|
| [3] |
|
| [4] |
|
| [5] |
|
| [6] |
|
| [7] |
国家发改委. 2019年新型城镇化建设重点任务[EB/OL]. http://www.ndrc.gov.cn/zcfb/zcfbtz/201904/t20190408_932843.html, 2019-03-31.
|
| [8] |
方创琳, 周成虎, 王振波. 长江经济带城市群可持续发展战略问题与分级梯度发展重点[J]. 地理科学进展, 2015, 34(11):1398-1408.
|
| [9] |
顾朝林, 于涛方, 李王鸣. 中国城市化:格局·过程·机理[M]. 北京: 科学出版社, 2008.
|
| [10] |
姚士谋, 周春山, 王德, 等. 中国城市群新论[M]. 北京: 科学出版社, 2016.
|
| [11] |
国家发改委, 住建部. 成渝城市群发展规划[EB/OL]. http://www.ndrc.gov.cn/zcfb/zcfbtz/201605/t20160504_800779.html, 2016-04-27.
|
| [12] |
李小浩. 城市规模分布演化特征及空间协调性分析——以成渝城市群为例[J]. 城市学刊, 2017, 38(1):73-79.
|
| [13] |
钟海燕. 成渝经济区城市体系优化分析:基于位序规模模型[J]. 地域研究与开发, 2014, 33(3):60-63.
|
| [14] |
曹跃群, 刘培森. 成渝都市群城市体系规模分布的实证研究[J]. 西北人口, 2011, 32(1):95-98.
|
| [15] |
|
| [16] |
刘妙龙, 陈雨, 陈鹏, 等. 基于位序钟理论的中国城市规模等级体系演化特征[J]. 地理学报, 2008, 63(12):1235-1245.
|
| [17] |
|
| [18] |
|
| [19] |
|
| [20] |
韩剑萍, 苟思远, 黄庆旭, 等. 成渝城市群近40年城市规模分布演变——基于K-S检验的滚动样本回归[J]. 经济地理, 2019, 39(8):59-67.
|
| [21] |
陆大道, 刘毅, 樊杰. 我国区域政策实施效果与区域发展的基本态势[J]. 地理学报, 1999(6):496-508.
|
| [22] |
王丰龙, 刘云刚. 中国城市建设用地扩张与财政收入增长的面板格兰杰因果检验[J]. 地理学报, 2013, 68(12):1595-1606.
|
| [23] |
吴一凡, 刘彦随, 李裕瑞. 中国人口与土地城镇化时空耦合特征及驱动机制[J]. 地理学报, 2018, 73(10):1865-1879.
|
| [24] |
闫小培, 毛蒋兴, 普军. 巨型城市区域土地利用变化的人文因素分析——以珠江三角洲地区为例[J]. 地理学报, 2006(6):613-623.
|
| [25] |
周国华, 贺艳华. 长沙城市土地扩张特征及影响因素[J]. 地理学报, 2006(11):1171-1180.
|
| [26] |
张学良, 张明斗, 肖航. 成渝城市群城市收缩的空间格局与形成机制研究[J]. 重庆大学学报:社会科学版, 2018(6):1-14.
|
| [27] |
|
| [28] |
李郇, 吴康, 龙瀛, 等. 局部收缩:后增长时代下的城市可持续发展争鸣[J]. 地理研究, 2017, 36(10):1997-2016.
|
| [29] |
吴康. 城市收缩的认知误区与空间规划响应[J]. 北京规划建设, 2019(3):4-11.
|
| [30] |
马强, 徐循初. “精明增长”策略与我国的城市空间扩展[J]. 城市规划汇刊, 2004(3):16-22,95.
|
| [31] |
刘海龙. 从无序蔓延到精明增长——美国“城市增长边界”概念述评[J]. 城市问题, 2005(3):67-72.
|
/
| 〈 |
|
〉 |