
Spatial-Temporal Evolution of Tourism Economic Network Structure and Its Development Mode in Wuling Mountainous Area of Hunan at the County Level
Received date: 2020-03-02
Revised date: 2020-10-09
Online published: 2025-04-11
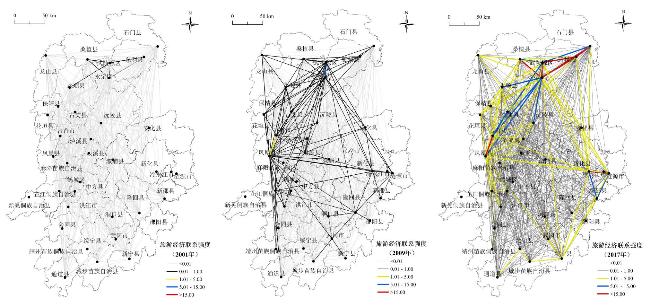
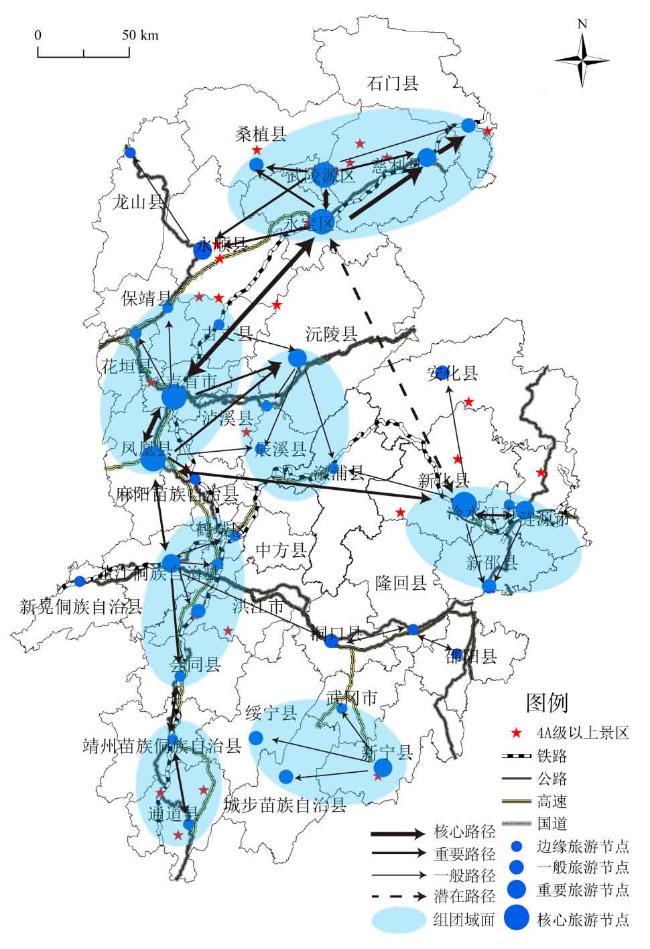
Applying the methods of modified gravity model,social network analysis and GIS,this paper discusses the structural characteristics,evolution process and development mode of tourism economic connection network of 34 counties in Wuling Mountain area of Hunan Province in 2001,2009 and 2017. The results show that the tourism economic connection among counties is getting closer and closer in Wuling Mountain area of Hunan Province from 2001 to 2017. Connection structure changes and experiences three stages: The first stage is the point structure that takes Wulingyuan district as the core. The second stage is dual axis structure that takes with Wulingyuan district-Yongding district and Fenghuang county-Jishou city as the main parts. The third stage is the network structure that takes Yongding district,Wulingyuan district,Fenghuang county,Jishou city and Xinhua city as the core,and the control power of the core counties is gradually declining,polarization charateristics has eased,it shows a trend of balanced development and has obvious core-edge structure and characteristics of small group cohesion. Spatially,it has gone through the evolution process from "weak connection,weak cohesion" to "strong connection and cohesion,weak connection and imbalance" to "strong connection and cohesion,weak connection and stability". In the future,it can be combined with the core radiation mode,point-axis driving mode and cluster mode to further realize the integration of regional tourism development.
TAO Weirong . Spatial-Temporal Evolution of Tourism Economic Network Structure and Its Development Mode in Wuling Mountainous Area of Hunan at the County Level[J]. Economic geography, 2020 , 40(12) : 211 -220 . DOI: 10.15957/j.cnki.jjdl.2020.12.024
表1 研究区域Tab.1 The research area |
| 湖南武陵山片区 (34个县区) | 分片区 | 具体县域 |
|---|---|---|
| 东北部—张家界片区 | 武陵源区、永定区、慈利县、桑植县、石门县 | |
| 西北部—湘西州片区 | 凤凰县、吉首市、保靖县、古丈县、永顺县、龙山县、花垣县、泸溪县 | |
| 中部—怀化片区 | 中方县、沅陵县、芷江县、靖州县、通道县、洪江市、辰溪县、溆浦县、麻阳县、会同县 | |
| 南部—娄邵片区 | 新化县、涟源市、新邵县、邵阳县、洞口县、隆回县、绥宁县、新宁县、城步县、武冈市、安化县 |
表2 研究方法详细公式及解释Tab.2 Detailed formulas and explanations of research methods |
| 指数 | 具体模型 | 变量含义 | 地理学意义 |
|---|---|---|---|
| 旅游经济联系度 | Rij为区域i和区域j之间的旅游经济联系强度;Pi、Pj分别为两区域的旅游总人数(万人);Vi、Vj为两区域的旅游总收入(万元);Dij为两区域最短的公路交通距离(km) | Rij值越大,反映两区域之间的旅游经济联系越紧密;反之,越弱 | |
| 旅游经济联系量 | Fi为县域i的旅游经济联系总量 | Fi值越大,说明县域i在区域中占据的地位越重要,反之,则反 | |
| 网络密度 | e为网络密度;rij为节点间实际的联系数;n为节点县域数量 | e越大,反映县域旅游经济空间关系越紧密,网络对每个节点的影响越大,反之,则反 | |
| 点度中心度 | CRD(i)为相对度数中心度 | CRD(i)值越大,表示该节点的权力越大,位居网络的中心 | |
| 接近中心度 | CRB(i)为相对中间中心度;gjk表示i、k间存在的捷径数量 | CRB(i)值越大,说明该节点控制其他节点的能力越强,位置越核心 |
表3 各县域旅游经济联系量及中心度统计Tab.3 Statistics of tourism economic linkage amount and centrality at the county level |
| 县(市、区) | 2001 | 2009 | 2017 | ||||||||
|---|---|---|---|---|---|---|---|---|---|---|---|
| 旅游经济 联系量 | 点度中心度 (%) | 中间中心度 (%) | 旅游经济 联系量 | 点度中心度 (%) | 中间中心度 (%) | 旅游经济 联系量 | 点度中心度 (%) | 中间中心度 (%) | |||
| 新邵县 | 0.001 | 0.000 | 0.000 | 0.056 | 6.061 | 0.000 | 20.828 | 81.818 | 0.865 | ||
| 邵阳县 | 0.000 | 0.000 | 0.000 | 0.060 | 3.030 | 0.000 | 5.679 | 48.485 | 0.009 | ||
| 隆回县 | 0.000 | 0.000 | 0.000 | 0.165 | 24.242 | 7.992 | 8.308 | 60.606 | 0.128 | ||
| 洞口县 | 0.000 | 0.000 | 0.000 | 0.084 | 9.091 | 0.000 | 9.264 | 75.758 | 0.597 | ||
| 绥宁县 | 0.000 | 0.000 | 0.000 | 0.054 | 0.000 | 0.000 | 9.047 | 66.667 | 0.283 | ||
| 新宁县 | 0.001 | 0.000 | 0.000 | 0.044 | 3.030 | 0.000 | 21.082 | 93.939 | 1.715 | ||
| 城步县 | 0.000 | 0.000 | 0.000 | 0.061 | 3.030 | 0.000 | 7.275 | 60.606 | 0.159 | ||
| 武冈市 | 0.001 | 0.000 | 0.000 | 0.122 | 15.152 | 11.553 | 8.197 | 57.576 | 0.069 | ||
| 石门县 | 0.001 | 0.000 | 0.000 | 0.148 | 9.091 | 0.000 | 56.777 | 72.727 | 0.620 | ||
| 慈利县 | 0.049 | 8.000 | 0.000 | 1.512 | 18.182 | 0.677 | 90.655 | 78.788 | 0.774 | ||
| 桑植县 | 0.043 | 8.000 | 0.000 | 0.704 | 15.152 | 0.000 | 48.313 | 60.606 | 0.218 | ||
| 武陵源区 | 0.831 | 24.000 | 3.167 | 12.736 | 57.576 | 9.987 | 392.324 | 100.000 | 2.576 | ||
| 永定区 | 0.782 | 16.000 | 0.500 | 11.955 | 51.515 | 5.984 | 464.318 | 100.000 | 2.576 | ||
| 安化县 | 0.000 | 0.000 | 0.000 | 0.215 | 18.182 | 0.038 | 12.775 | 84.848 | 1.146 | ||
| 中方县 | 0.001 | 0.000 | 0.000 | 0.166 | 9.091 | 0.000 | 6.808 | 57.576 | 0.227 | ||
| 沅陵县 | 0.008 | 0.000 | 0.000 | 0.191 | 15.152 | 0.000 | 20.184 | 87.879 | 1.584 | ||
| 辰溪县 | 0.000 | 0.000 | 0.000 | 0.681 | 33.333 | 2.067 | 7.112 | 69.697 | 0.659 | ||
| 溆浦县 | 0.001 | 0.000 | 0.000 | 0.081 | 6.061 | 0.000 | 2.566 | 39.394 | 0.010 | ||
| 会同县 | 0.000 | 0.000 | 0.000 | 0.069 | 9.091 | 0.000 | 7.874 | 69.697 | 0.283 | ||
| 麻阳县 | 0.000 | 0.000 | 0.000 | 0.029 | 3.030 | 0.000 | 7.137 | 33.333 | 0.014 | ||
| 芷江县 | 0.007 | 0.000 | 0.000 | 0.682 | 36.364 | 4.050 | 18.121 | 100.000 | 2.576 | ||
| 靖州县 | 0.000 | 0.000 | 0.000 | 0.122 | 9.091 | 0.000 | 5.448 | 54.545 | 0.059 | ||
| 通道县 | 0.001 | 0.000 | 0.000 | 0.064 | 3.030 | 0.000 | 8.646 | 75.758 | 0.541 | ||
| 洪江市 | 0.002 | 0.000 | 0.000 | 0.217 | 12.121 | 0.095 | 9.121 | 81.818 | 1.065 | ||
| 新化县 | 0.000 | 0.000 | 0.000 | 0.442 | 27.273 | 3.647 | 87.258 | 100.000 | 2.576 | ||
| 涟源市 | 0.000 | 0.000 | 0.000 | 0.380 | 21.212 | 2.584 | 74.146 | 93.939 | 1.715 | ||
| 泸溪县 | 0.000 | 0.000 | 0.000 | 0.115 | 9.091 | 0.000 | 9.481 | 57.576 | 0.202 | ||
| 凤凰县 | 0.034 | 8.000 | 0.000 | 3.503 | 81.818 | 49.810 | 149.402 | 100.000 | 2.576 | ||
| 保靖县 | 0.000 | 0.000 | 0.000 | 0.165 | 15.152 | 0.000 | 9.935 | 42.424 | 0.000 | ||
| 古丈县 | 0.001 | 0.000 | 0.000 | 0.310 | 15.152 | 0.000 | 16.009 | 60.606 | 0.174 | ||
| 永顺县 | 0.029 | 8.000 | 0.000 | 1.135 | 36.364 | 1.316 | 33.751 | 78.788 | 0.770 | ||
| 龙山县 | 0.002 | 0.000 | 0.000 | 0.163 | 12.121 | 0.000 | 9.113 | 48.485 | 0.027 | ||
| 花垣县 | 0.002 | 0.000 | 0.000 | 0.222 | 18.182 | 0.038 | 15.852 | 60.606 | 0.174 | ||
| 吉首市 | 0.035 | 8.000 | 0.000 | 2.062 | 30.303 | 0.919 | 149.560 | 100.000 | 2.576 | ||
| 均值 | 0.054 | 2.353 | 0.108 | 1.139 | 18.717 | 2.963 | 53.011 | 72.193 | 0.869 | ||
| 标准差 | 0.189 | 5.324 | 0.539 | 2.887 | 17.368 | 8.676 | 101.464 | 19.214 | 0.920 | ||
| 变异系数 | 3.503 | 2.263 | 4.999 | 2.535 | 0.928 | 2.928 | 1.914 | 0.266 | 1.059 | ||
| 总和 | 1.832 | 80.000 | 3.667 | 38.715 | 636.366 | 100.757 | 1 802.366 | 2 454.545 | 29.543 | ||
| 最大值 | 0.831 | 8.000 | 3.167 | 12.736 | 81.818 | 49.810 | 464.318 | 100.000 | 2.576 | ||
| 最小值 | 0.000 | 0.000 | 0.000 | 0.029 | 3.030 | 0.000 | 2.566 | 33.333 | 0.000 | ||
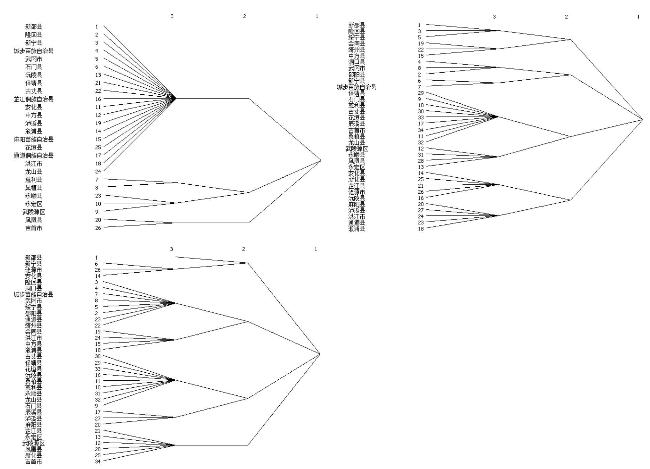
图2 2001—2017年湖南武陵山片区旅游经济联系凝聚子群Fig.2 Cohesive subgroups of urban tourism economy connection in Wuling Mountain Area in Hunan Province(2001-2017) |
表4 整体网络密度及核心—边缘区密度Tab.4 Integral network density and core-edge area density |
| 密度值 | 2001 | 2009 | 2017 | |||||
|---|---|---|---|---|---|---|---|---|
| 核心区 | 边缘区 | 核心区 | 边缘区 | 核心区 | 边缘区 | |||
| 核心区 | 0.099 | 0 | 0.519 | 0.158 | 0.937 | 0.598 | ||
| 边缘区 | 0 | 0 | 0.158 | 0.015 | 0.598 | 0.439 | ||
| 网络密度 | 0.027 | 0.184 | 0.720 | |||||
表5 片区旅游经济联系网络的核心—边缘结构Tab.5 Core-edge structure of regional tourism economic linkage network |
| 2001年核心区 | 2009年新增核心区 | 2017年新增核心区 | 始终位于边缘区 | |
|---|---|---|---|---|
| 张家界片区 | 慈利、桑植、永定、武陵源 | |||
| 湘西州片区 | 永顺、吉首、凤凰 | 保靖、古丈、泸溪、龙山、花垣 | ||
| 怀化片区 | 芷江、辰溪 | 通道、沅陵、会同、洪江 | 溆浦、靖州、麻阳、中方 | |
| 娄邵片区 | 涟源、隆回、武冈、新化、安化 | 新邵、绥宁、新宁 | 城步 |
| [1] |
孟德友, 陆玉麟. 基于基尼系数的河南县域经济差异产业分解[J]. 经济地理, 2011, 31(5):799-804.
|
| [2] |
丁建军, 冷志明. 武陵山睡区县域产业增长的空间特征[J]. 山地学报, 2013, 31(5):555-564.
|
| [3] |
王兆峰, 刘训华. 旅游产业集群下的区域营销战略研究——以武陵山区为例[J]. 社会科学家, 2009(5):95-97.
|
| [4] |
黄渊基. 连片特困地区旅游扶贫效率评价及时空分异——以武陵山湖南片区20个县(市、区)为例[J]. 经济地理, 2017, 37(11):229-235.
|
| [5] |
黄炜, 孟霏, 肖淑靓. 精准扶贫视域下乡村旅游产业发展动力因素实证研究——以武陵山片区为例[J]. 中央民族大学学报:哲学社会科学版, 2017(5):58-69.
|
| [6] |
徐晓红, 孙玮. 武陵山片区乡村传媒生态环境变迁的历史进程与特殊性[J]. 吉首大学学报:社会科学版, 2018(S2):108-112.
|
| [7] |
龙祖坤, 李绪茂. 湖南境内武陵山片区旅游产出规模分异、质量与空间结构初探[J]. 长江流域资源与环境, 2018(4):756-767.
|
| [8] |
郑代良. 武陵山片区发展跨省协作机制:成效、挑战与战略举措——以武陵山大(龙)新(晃)经济协作示范园为个案[J]. 湖南社会科学, 2017(6):135-140.
|
| [9] |
王兆峰. 基于交通网络的跨界旅游合作机制研究——以武陵山区为例[J]. 商学研究, 2018(4):47-55.
|
| [10] |
卞显红. 城市旅游空间结构研究[J]. 地理与地理信息科学, 2003, 19(1):105-108.
|
| [11] |
陆林, 任以胜, 徐雨晨. 旅游建构城市群“乡土—生态”空间的理论框架及研究展望[J]. 地理学报, 2019, 74(6):1267-1278.
|
| [12] |
许先普, 陈天鑫. 旅游消费、产业结构调整与区域均衡发展[J]. 消费经济, 2019(2):25-33.
|
| [13] |
|
| [14] |
|
| [15] |
|
| [16] |
|
| [17] |
于洪雁, 李秋雨, 梅林, 等. 社会网络视角下黑龙江省城市旅游经济联系的空间结构和空间发展模式研究[J]. 地理科学, 2015, 35(11):1429-1436.
|
| [18] |
杨友宝, 王荣成, 李秋雨, 等. 东北地区旅游资源赋存演化特征与旅游业空间重构[J]. 经济地理, 2015, 35(10):194-201.
|
| [19] |
杨兴柱, 顾朝林, 王群. 南京市旅游流网络结构构建[J]. 地理学报, 2007, 62(6):609-620.
|
| [20] |
王洪桥, 袁家冬, 孟祥君. 东北地区 A级旅游景区空间分布特征及影响因素[J]. 地理科学, 2017, 37(6):895-903.
|
| [21] |
马晓龙, 曹杏娟. 省域旅游竞争力的空间格局与形成机理研究[J]. 旅游科学, 2013, 27(2):14-23.
|
| [22] |
李鹏, 虞虎, 王英杰. 中国3A级以上旅游景区空间集聚特征研究[J]. 地理科学, 2018, 38(11):1883-1891.
|
| [23] |
汤放华, 汤慧, 孙倩, 等. 长江中游城市集群经济网络结构分析[J]. 地理学报, 2013, 68(10):1357-1366.
|
| [24] |
|
| [25] |
刘军. 整体网分析——UCINET软件实用指南[M]. 上海: 格致出版社, 2014.
|
| [26] |
史庆斌, 谢永顺, 韩增林, 等. 东北城市间旅游经济联系的空间结构及发展模式[J]. 经济地理, 2018, 38(11):211-219.
|
| [27] |
劳昕, 沈体雁, 杨洋, 等. 长江中游城市群经济联系测度研究——基于引力模型的社会网络分析[J]. 城市发展研究, 2016, 23(7):91-98.
|
| [28] |
|
/
| 〈 |
|
〉 |