
The Spatio-Temporal Evolution and Impact Mechanism of County Tourism Poverty Alleviation Efficiency from the Perspective of Multidimensional Poverty:A Case Study of 25 Border Counties (Cities) in Yunnan Province
Received date: 2019-11-19
Revised date: 2020-05-24
Online published: 2025-04-11
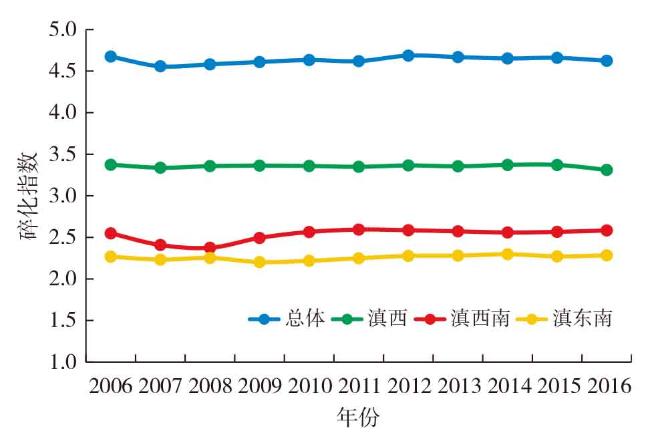
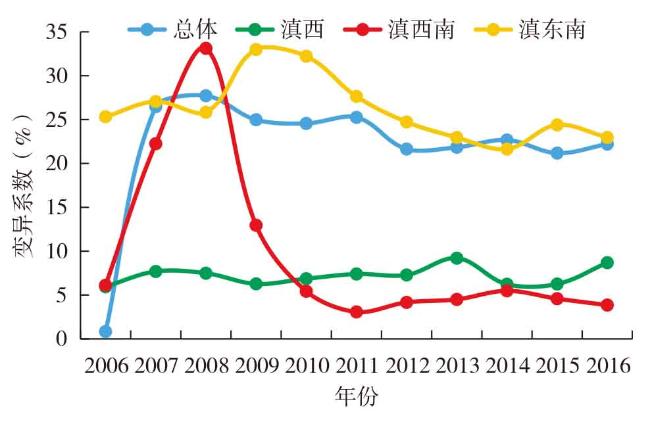
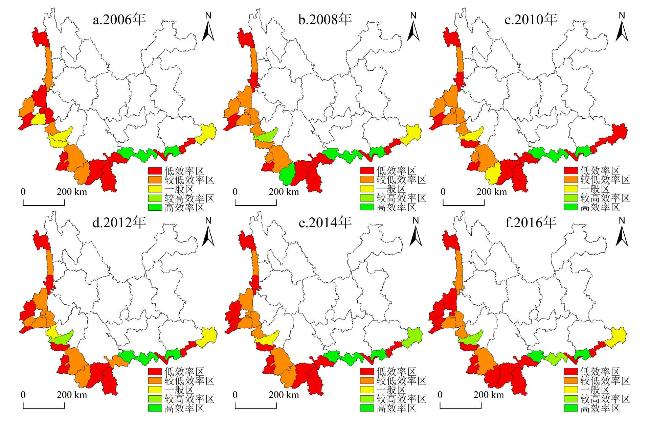
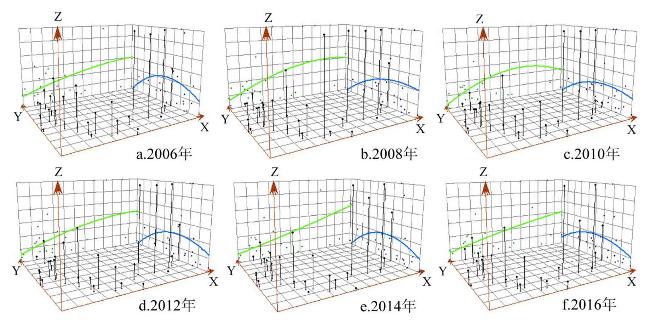
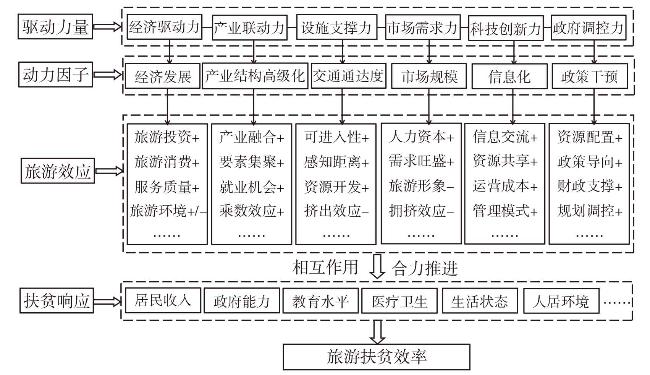
Tourism poverty alleviation is an important way and driving force for poverty alleviation in border areas. Based on the multi-dimensional poverty theory and the United Nations MPI indicator system,a tourism poverty alleviation efficiency measurement indicator system that characterizes the four dimensions of economy,education,health,and life,measures individual behavioral capacity and regional sustainable development capacity is established. And take 25 counties (cities) on the border of Yunnan Province as the case study area. The Bootstrap-DEA model is used to measure its tourism poverty alleviation efficiency from 2006 to 2016,and its spatial and temporal evolution characteristics and influence mechanism are explored using the ArcGIS spatial trend module and the Tobit model. The research shows that: 1) In the time series,the fragmentation index indicates that the poverty reduction efficiency of tourism in border counties (cities) has undergone the development process of "discrete-aggregation" in geographical space,and the coefficient of variation indicates that it has significant spatial differences. 2) In terms of spatial differences,the poverty alleviation efficiency of tourism presents a pattern characteristic of "Southeast Yunnan Border Section> Southwestern Yunnan Border Section> Western Yunnan Border Section",and has certain continuity and space inertia characteristics;The overall trend shows the pattern of "high in the east and low in the west,high in the south and low in the north". 3) Economic foundation,advanced industrial structure,transportation accessibility,market demand scale and government intervention are the main driving factors for the improvement of tourism poverty alleviation efficiency in the border areas of Yunnan. Informationization has a negative impact on the efficiency of tourism poverty alleviation. There are differences in the impact strength and action path of the border section.
MU Xueqing , GUO Xiangyang , MING Qingzhong . The Spatio-Temporal Evolution and Impact Mechanism of County Tourism Poverty Alleviation Efficiency from the Perspective of Multidimensional Poverty:A Case Study of 25 Border Counties (Cities) in Yunnan Province[J]. Economic geography, 2020 , 40(12) : 199 -210 . DOI: 10.15957/j.cnki.jjdl.2020.12.023
表1 边境县(市)旅游扶贫效率评价指标体系Tab.1 Evaluation index system of tourism poverty alleviation efficiency in border counties and cities |
| 指标 | 指标构成 | 指标内容 | 涵义 |
|---|---|---|---|
| 投入指标 | 旅游业 | X1人均旅游收入(元) | 旅游产业发展的经济效益状况 |
| X2人均接待游客数量(人次) | 旅游业的“催化作用”和“综合效应” | ||
| 产出指标 | 经济维度 | Y1人均GDP(元/人) | 旅游业拉动当地经济发展的程度 |
| Y2农民人均纯收入(元/人) | 体现旅游地居民物质基础与生活状态 | ||
| 教育维度 | Y4普通中学在校学生数(人) | 表征旅游业发展对当地教育水平的促进 | |
| 健康维度 | Y5医院、卫生院床位数(张) | 体现旅游业对当地医疗水平的带动作用 | |
| 生活维度 | Y6移动电话年末用户(户) | 表明当地居民信息通畅度与生活便捷度 |
表2 边境25个县(市)旅游扶贫效率值Tab.2 Tourism poverty alleviation efficiency in 25 counties (cities) at the border |
| 区域 | 2006 | 2007 | 2008 | 2009 | 2010 | 2011 | 2012 | 2013 | 2014 | 2015 | 2016 | 平均值 |
|---|---|---|---|---|---|---|---|---|---|---|---|---|
| 泸水县 | 0.269 | 0.151 | 0.151 | 0.138 | 0.138 | 0.135 | 0.171 | 0.171 | 0.186 | 0.201 | 0.221 | 0.176 |
| 福贡县 | 0.277 | 0.213 | 0.249 | 0.259 | 0.264 | 0.260 | 0.344 | 0.317 | 0.326 | 0.329 | 0.353 | 0.290 |
| 贡山县 | 0.083 | 0.069 | 0.082 | 0.081 | 0.083 | 0.076 | 0.111 | 0.115 | 0.120 | 0.135 | 0.165 | 0.102 |
| 芒市 | 0.542 | 0.328 | 0.305 | 0.287 | 0.300 | 0.257 | 0.282 | 0.314 | 0.357 | 0.315 | 0.244 | 0.321 |
| 盈江县 | 0.284 | 0.281 | 0.307 | 0.227 | 0.241 | 0.211 | 0.168 | 0.190 | 0.162 | 0.147 | 0.134 | 0.214 |
| 陇川县 | 0.199 | 0.155 | 0.180 | 0.148 | 0.156 | 0.156 | 0.227 | 0.218 | 0.183 | 0.182 | 0.179 | 0.180 |
| 瑞丽市 | 0.067 | 0.072 | 0.092 | 0.094 | 0.102 | 0.096 | 0.137 | 0.138 | 0.133 | 0.152 | 0.034 | 0.102 |
| 腾冲市 | 0.176 | 0.186 | 0.209 | 0.201 | 0.201 | 0.200 | 0.230 | 0.255 | 0.262 | 0.208 | 0.198 | 0.211 |
| 龙陵县 | 0.188 | 0.218 | 0.265 | 0.263 | 0.297 | 0.235 | 0.302 | 0.294 | 0.234 | 0.224 | 0.268 | 0.253 |
| 镇康县 | 0.383 | 0.346 | 0.357 | 0.346 | 0.315 | 0.348 | 0.482 | 0.458 | 0.346 | 0.285 | 0.328 | 0.363 |
| 耿马县 | 0.491 | 0.594 | 0.649 | 0.559 | 0.599 | 0.601 | 0.618 | 0.752 | 0.578 | 0.584 | 0.606 | 0.603 |
| 沧源县 | 0.441 | 0.318 | 0.229 | 0.163 | 0.142 | 0.121 | 0.166 | 0.170 | 0.128 | 0.105 | 0.098 | 0.189 |
| 孟连县 | 0.068 | 0.076 | 0.103 | 0.114 | 0.120 | 0.149 | 0.133 | 0.088 | 0.078 | 0.070 | 0.102 | 0.100 |
| 澜沧县 | 0.256 | 0.277 | 0.342 | 0.336 | 0.310 | 0.327 | 0.395 | 0.368 | 0.398 | 0.359 | 0.343 | 0.337 |
| 西盟县 | 0.166 | 0.188 | 0.203 | 0.237 | 0.247 | 0.233 | 0.187 | 0.170 | 0.155 | 0.148 | 0.151 | 0.190 |
| 江城县 | 0.136 | 0.120 | 0.129 | 0.122 | 0.109 | 0.121 | 0.235 | 0.188 | 0.147 | 0.142 | 0.153 | 0.146 |
| 景洪市 | 0.178 | 0.081 | 0.089 | 0.114 | 0.160 | 0.147 | 0.130 | 0.130 | 0.164 | 0.156 | 0.105 | 0.132 |
| 勐海县 | 0.383 | 0.736 | 0.987 | 0.603 | 0.402 | 0.247 | 0.304 | 0.280 | 0.225 | 0.189 | 0.153 | 0.411 |
| 勐腊县 | 0.105 | 0.082 | 0.100 | 0.094 | 0.112 | 0.101 | 0.129 | 0.111 | 0.095 | 0.092 | 0.104 | 0.102 |
| 金平县 | 0.963 | 0.971 | 0.966 | 0.969 | 0.973 | 0.975 | 0.958 | 0.872 | 0.875 | 0.649 | 0.623 | 0.907 |
| 绿春县 | 0.934 | 0.926 | 0.938 | 0.947 | 0.951 | 0.968 | 0.984 | 0.972 | 0.975 | 0.969 | 0.974 | 0.988 |
| 河口县 | 0.052 | 0.048 | 0.056 | 0.055 | 0.059 | 0.058 | 0.079 | 0.074 | 0.106 | 0.075 | 0.075 | 0.067 |
| 马关县 | 0.987 | 0.991 | 0.982 | 0.973 | 0.970 | 0.979 | 0.983 | 0.987 | 0.981 | 0.988 | 0.994 | 0.991 |
| 富宁县 | 0.514 | 0.526 | 0.589 | 0.087 | 0.105 | 0.402 | 0.504 | 0.570 | 0.653 | 0.428 | 0.474 | 0.441 |
| 麻栗坡县 | 0.108 | 0.105 | 0.141 | 0.164 | 0.198 | 0.167 | 0.186 | 0.178 | 0.168 | 0.162 | 0.189 | 0.161 |
表3 Tobit模型参数估计结果Tab.3 Tobit model parameter estimation result |
| 解释变量 | 边境地区 | 滇西边境段 | 滇西南边境段 | 滇东南边境段 |
|---|---|---|---|---|
| lnPLFR | 0.482***(4.610) | 0.149(1.240) | 0.291**(2.170) | 0.359(1.510) |
| lnSTR | 0.553***(7.680) | 0.327***(3.840) | 0.037(0.720) | 0.494**(1.960) |
| lnTRA | 0.150(0.310) | 0.104(1.320) | 0.837*(1.710) | 0.183**(2.420) |
| lnSCL | 0.621***(5.910) | 0.549***(4.630) | 0.910***(2.650) | 1.230**(2.380) |
| lnINF | -0.070(-0.810) | -0.644(-1.070) | -0.159(-1.550) | 0.586(0.500) |
| lnGOV | 0.192**(1.990) | 0.165**(2.130) | 0.361***(3.540) | 3.089***(3.320) |
| Cons | 0.631 | 0.235 | 0.274 | 0.203 |
| LR chi2(5) | 101.680 | 57.340 | 23.360 | 39.890 |
| Prob > chi2 | 0.000 | 0.000 | 0.001 | 0.000 |
| Log likelihood | -48.817 | 99.990 | 44.372 | -39.162 |
| Number of obs | 275 | 132 | 77 | 66 |
注:“*、**、***”分别表示在10%、5%和1%的显著水平下通过检验,括号内为t统计值。 |
| [1] |
|
| [2] |
|
| [3] |
|
| [4] |
|
| [5] |
|
| [6] |
|
| [7] |
|
| [8] |
|
| [9] |
|
| [10] |
钟学思. 广西瑶族特色村寨旅游扶贫资源配置效率分析及优化[J]. 社会科学家, 2019, 34(3):91-96.
|
| [11] |
王志章, 王静. 基于可持续发展的少数民族地区旅游扶贫绩效评价研究[J]. 云南民族大学学报:哲学社会科学版, 2018, 35(5):89-97.
|
| [12] |
罗盛锋, 黄燕玲. 滇桂黔石漠化生态旅游景区扶贫绩效评价[J]. 社会科学家, 2015, 30(9):97-101.
|
| [13] |
余利红. 基于匹配倍差法的乡村旅游扶贫农户增收效应[J]. 资源科学, 2019, 41(5):955-966.
|
| [14] |
杨德进, 白长虹, 牛会聪. 民族八省区旅游扶贫效应的时空分异、成因及优化对策研究[J]. 广西民族大学学报:哲学社会科学版, 2018, 40(6):2-7.
|
| [15] |
王庆生, 张行发, 郭静. 基于共生理论的乡村旅游精准扶贫模式和路径优化研究——以山东省沂南县竹泉村为例[J]. 地域研究与开发, 2019, 38(3):108-112.
|
| [16] |
李晴. 可持续生计视角下我国集中连片特困地区精准扶贫模式研究[D]. 南京: 南京大学, 2019.
|
| [17] |
王凯, 甘畅, 王梦晗, 等. 湖北省旅游扶贫效率时空格局及其影响因素[J]. 长江流域资源与环境, 2019, 28(4):863-871.
|
| [18] |
龙祖坤, 杜倩文, 周婷. 武陵山区旅游扶贫效率的时间演进与空间分异[J]. 经济地理, 2015, 35(10):210-217.
|
| [19] |
曹妍雪, 马蓝. 基于三阶段DEA的我国民族地区旅游扶贫效率评价[J]. 华东经济管理, 2017, 31(9):91-97.
|
| [20] |
王凯, 甘畅, 尹建军, 等. 集中连片特困区旅游扶贫效率空间格局动态演化——以大别山试验区为例[J]. 中南林业科技大学学报:社会科学版, 2018, 12(3):1-6.
|
| [21] |
马磊. 新疆农牧区旅游扶贫效率测度及空间分异研究[D]. 石河子: 石河子大学, 2018.
|
| [22] |
李佳, 成升魁, 马金刚, 等. 基于县域要素的三江源地区旅游扶贫模式探讨[J]. 资源科学, 2009, 31(11):1818-1824.
|
| [23] |
邓洪波, 陆林. 基于DEA模型的安徽省城市旅游效率研究[J]. 自然资源学报, 2014, 29(2):313-323.
|
| [24] |
|
| [25] |
曹芳东, 黄震方, 徐敏, 等. 风景名胜区旅游效率及其分解效率的时空格局与影响因素——基于Bootstrap-DEA模型的分析方法[J]. 地理研究, 2015, 34(12):2395-2408.
|
| [26] |
史雅娟, 朱永彬, 冯德显, 等. 中原城市群多中心网络式空间发展模式研究[J]. 地理科学, 2012, 32(12):1430-1438.
|
| [27] |
刘军, 问鼎, 童昀, 等. 基于碳排放核算的中国区域旅游业生态效率测度及比较研究[J]. 生态学报, 2019, 39(6):1979-1992.
|
| [28] |
穆学青, 郭向阳, 明庆忠. 边境地区旅游强度时空演化特征分析[J]. 经济地理, 2019, 39(1):233-240.
|
| [29] |
龙亮军, 王霞, 郭兵. 基于改进DEA模型的城市生态福利绩效评价研究——以我国35个大中城市为例[J]. 自然资源学报, 2017, 32(4):595-605.
|
| [30] |
鄢慧丽, 王强, 熊浩, 等. 海南省少数民族地区旅游扶贫效率测度与时空演化分析[J]. 中国软科学, 2018(8):63-76.
|
| [31] |
|
| [32] |
|
| [33] |
文琦, 施琳娜, 马彩虹, 等. 黄土高原村域多维贫困空间异质性研究——以宁夏彭阳县为例[J]. 地理学报, 2018, 73(10):1850-1864.
|
| [34] |
何静, 汪侠, 刘丹丽, 等. 国家级贫困县旅游发展与多维贫困的脱钩关系研究[J]. 地理研究, 2019, 38(5):1189-1207.
|
| [35] |
袁媛, 王仰麟, 马晶, 等. 河北省县域贫困度多维评估[J]. 地理科学进展, 2014, 33(1):124-133.
|
| [36] |
周强. 多维贫困、不平等与反贫困政策绩效评估[D]. 武汉: 武汉大学, 2017.
|
| [37] |
徐冬, 黄震方, 黄睿. 基于空间面板计量模型的雾霾对中国城市旅游流影响的空间效应[J]. 地理学报, 2019, 74(4):814-830.
|
| [38] |
王坤, 黄震方, 曹芳东, 等. 泛长江三角洲城市旅游绩效空间格局演变及其影响因素[J]. 自然资源学报, 2016, 31(7):1149-1163.
|
| [39] |
干春晖, 郑若谷, 典范. 中国产业结构变迁对经济增长和波动的影响[J]. 经济研究, 2011(5):4-16.
|
| [40] |
明庆忠, 刘红芳. 陆疆边境旅游发展战略与政策创新研究[M]. 北京: 科学出版社, 2019.
|
/
| 〈 |
|
〉 |
