
Spatial-Temporal Evolution and Urbanization Effects of Financial Inclusion in Guangdong Province
Received date: 2020-03-18
Revised date: 2020-09-22
Online published: 2025-04-11
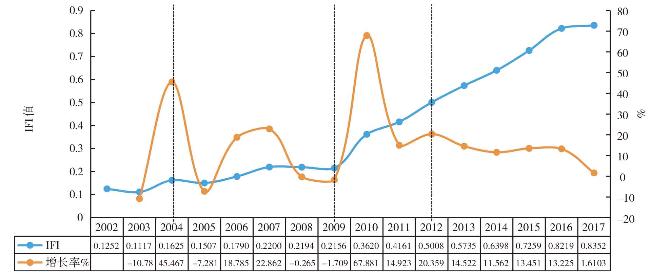
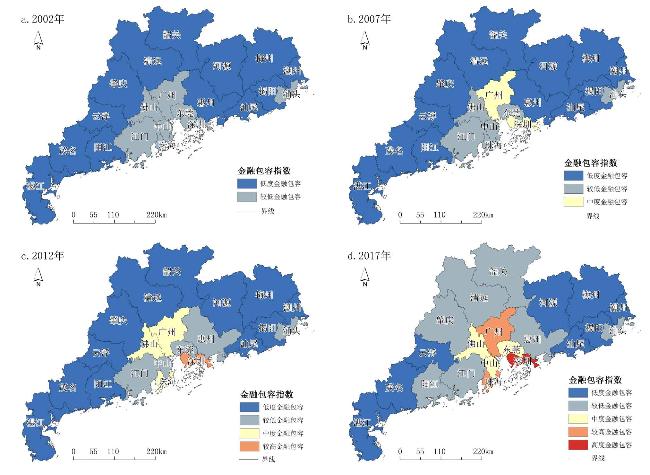
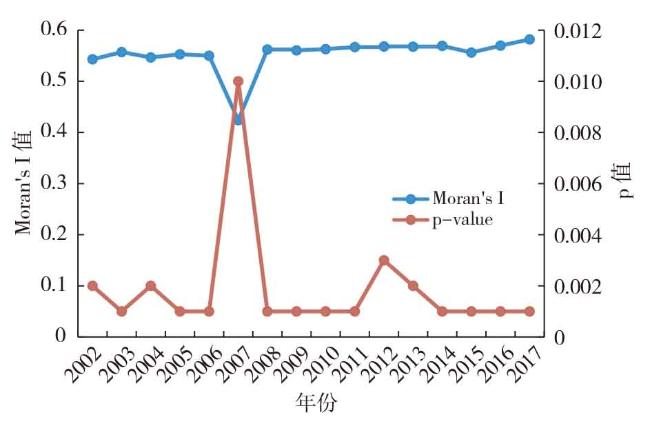
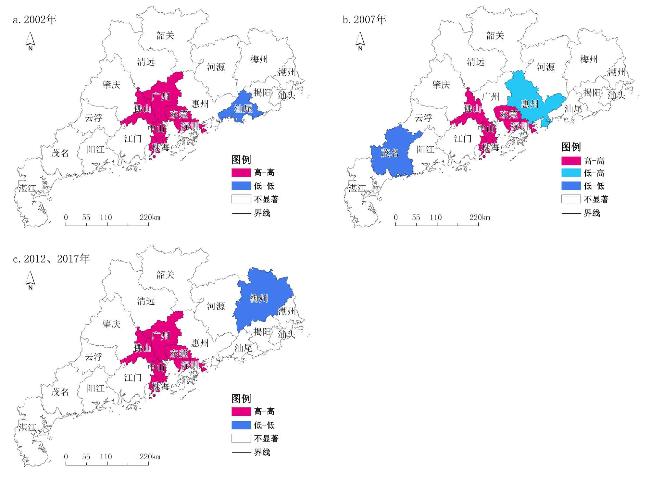
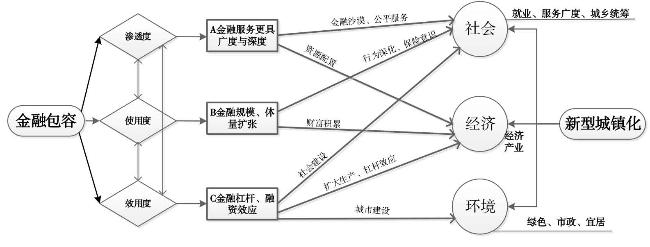
This paper builds financial inclusion index system from three dimensions which are penetration,use and utility,and constructs the new-type urbanization index system from social,economic and environmental development in Guangdong Province. Based on ArcGIS spatial analysis,this paper analyzes spatial-temporal evolution characteristics of financial inclusion,and uses the spatial regression model to illustrate the urbanization development effect of financial inclusion. The results show that financial inclusion development in Guangdong Province has obvious stage characteristics,and the overall trend of fluctuations is growing from 2002 to 2017. The spatial evolution presents the core-edge pattern,and the diffusion effect is continuously enhanced. The regional and municipal differences decrease gradually,and the positive spatial correlation is significant. The Pearl River Delta has occupied the high-value cluster area. Financial inclusion has a significant effect on urbanization,which has a positive impact on the social,economic and environmental index of new urbanization. Finally,it proposes some measures to promote the interaction between the financial inclusive development and new urbanization by constructing a multi-level regional financial market, strengthening the building of new rural financial institutions and developing digital finance.
ZHANG Guojun , LUO Lijia , XU Zhihua , ZHOU Chunshan . Spatial-Temporal Evolution and Urbanization Effects of Financial Inclusion in Guangdong Province[J]. Economic geography, 2020 , 40(12) : 137 -146 . DOI: 10.15957/j.cnki.jjdl.2020.12.016
表1 金融包容与新型城镇化的指标体系Tab.1 The evaluation index system of the financial inclusion and new-type urbanization |
| 综合指数 | 维度 | 基础指标 | 指标定义 | 指标性质 |
|---|---|---|---|---|
| 金融包容指数 | 渗透度(PENE) | X1:人均金融机构网点数 | 万人拥有金融机构网点数(个/万人) | 正向 |
| X2:人均拥有金融服务人员数 | 万人拥有金融机构服务人员数(个/万人) | 正向 | ||
| X3:地均金融机构网点数 | 万平方公里金融机构网点数(个/万km2) | 正向 | ||
| X4:地均拥有金融服务人员数 | 万平方公里金融机构服务人员数(个/万km2) | 正向 | ||
| 使用度(USE) | X5:人均存款余额 | 存款余额/总人口(万元/人) | 正向 | |
| X6:人均贷款余额 | 贷款余额/总人口(万元/人) | 正向 | ||
| X7:人均城乡居民储蓄存款 | 城乡居民储蓄存款余额/总人口(万元/人) | 正向 | ||
| X8:人均保费收入 | 保费收入/总人口(万元/人) | 正向 | ||
| 效用度(UTIL) | X9:存款余额占比 | 存款余额占GDP比重(%) | 正向 | |
| X10:贷款余额占比 | 贷款余额占GDP比重(%) | 正向 | ||
| X11:储蓄存款余额占比 | 储蓄存款余额占GDP比重(%) | 正向 | ||
| X12:存贷比 | 贷款总额/存款总额(%) | 正向 | ||
| X13:贷款增长 | 贷款增长率(%) | 正向 | ||
| X14:保费收入占比 | 保费收入占GDP比重(%) | 正向 | ||
| 新型城镇化指数 | 社会发展(SO) | O1:城镇化水平 | 城镇化率(%) | 正向 |
| O2:医疗水平 | 每万人拥有的住院床位(个) | 正向 | ||
| O3:就业程度 | 就业人口/总人口(%) | 正向 | ||
| O4:建成区规模 | 城市建成区面积(km2) | 正向 | ||
| 经济发展(ECO) | P1:经济总量 | GDP总额(亿元) | 正向 | |
| P2:政府支出 | 公共财政支出/总人口(万元/人) | 正向 | ||
| P3:政府投资 | 固定资产投资额/总人口(万元/人) | 正向 | ||
| P4:经济实力 | 人均GDP(万元) | 正向 | ||
| P5:二产占比 | 第二产业占GDP比重(%) | 正向 | ||
| P6:三产占比 | 第三产业占GDP比重(%) | 正向 | ||
| 环境发展(ENV) | Q1:绿化环境 | 城市人均绿地面积(m2) | 正向 | |
| Q2:污水处理 | 城镇生活污水处理率(%) | 正向 | ||
| Q3:废物利用 | 工业固体废物综合利用率(%) | 正向 | ||
| Q4:建成环境 | 建成区绿化覆盖率(%) | 正向 |
表2 2002、2007、2012与2017年广东省四大区域金融包容统计描述Tab.2 Statistical description of financial inclusion index in four regions of Guangdong Province in 2002,2007,2012 and 2017 |
| 年份 | 平均值 | 变异系数 | |||
|---|---|---|---|---|---|
| 东翼 | 西翼 | 山区 | 珠三角 | ||
| 2002 | 0.062 | 0.042 | 0.036 | 0.151 | 0.731 |
| 2007 | 0.076 | 0.038 | 0.040 | 0.178 | 0.789 |
| 2012 | 0.075 | 0.059 | 0.061 | 0.280 | 0.908 |
| 2017 | 0.102 | 0.089 | 0.095 | 0.395 | 0.881 |
表3 金融包容对新型城镇化的Hausman检验Tab.3 The Hausman test of the influence of financial inclusion on urbanization |
| 模型 | Test Summary | Chi-sq. Statistic | Chi-sq.d.f. | Prob. |
|---|---|---|---|---|
| 模型AIFI与SO | Cross-section random | 6.530680 | 1 | 0.0106 |
| 模型BIFI与ECO | Cross-section random | 60.674320 | 1 | 0.0000 |
| 模型CIFI与ENV | Cross-section random | 116.523205 | 1 | 0.0000 |
表4 面板回归结果Tab.4 Results of panel model regression |
| 模型 | Variavle | Coefficient | Prob. | R-squared | Adjusted R-squared | F-statistic |
|---|---|---|---|---|---|---|
| 模型AIFI与SO | C | -0.159483 | 0.0007 | 0.953868 | 0.950782 | 309.1675 |
| lnIFI | 0.460783 | 0.0000 | ||||
| 模型BIFI与ECO | C | 0.347900 | 0.0000 | 0.866656 | 0.857738 | 97.18112 |
| lnIFI | 0.797998 | 0.0000 | ||||
| 模型CIFI与ENV | C | 1.105279 | 0.0000 | 0.582462 | 0.554538 | 20.85846 |
| lnIFI | 0.795477 | 0.0000 |
| [1] |
|
| [2] |
|
| [3] |
|
| [4] |
|
| [5] |
|
| [6] |
刘晓光, 苟琴, 姜天予. 金融结构、经济波动与经济增长——基于最优产业配置框架的分析[J]. 管理世界, 2019, 35(5):29-43,198.
|
| [7] |
|
| [8] |
|
| [9] |
|
| [10] |
|
| [11] |
|
| [12] |
|
| [13] |
|
| [14] |
|
| [15] |
|
| [16] |
|
| [17] |
何德旭, 苗文龙. 金融排斥、金融包容与中国普惠金融制度的构建[J]. 财贸经济, 2015(3):5-16.
|
| [18] |
田霖, 韩岩博. 金融包容的影响因素与短板解析[J]. 金融理论与实践, 2019(10):1-10.
|
| [19] |
辛立秋, 朱晨曦, 谢禹, 等. 金融包容对农民增收的影响研究——以黑龙江省为例[J]. 财政研究, 2017(12):45-59.
|
| [20] |
刘波, 王修华, 彭建刚. 金融包容水平与地区收入差距——基于湖南省87个县(市)2008—2012年的经验数据[J]. 当代财经, 2014(11):46-56.
|
| [21] |
张彤进, 任碧云. 包容性金融发展与城乡居民收入差距——基于中国内地省级面板数据的实证研究[J]. 经济理论与经济管理, 2017(5):90-101.
|
| [22] |
|
| [23] |
郑锦波. 中国普惠金融发展对新型城镇化进程的影响研究[D]. 南京: 东南大学, 2018.
|
| [24] |
|
| [25] |
张国俊, 周春山, 许学强. 中国金融排斥的省际差异及影响因素[J]. 地理研究, 2014, 33(12):2299-2311.
|
| [26] |
李建军, 卢盼盼. 中国居民金融服务包容性测度与空间差异[J]. 经济地理, 2016, 36(3):118-124.
|
| [27] |
蒋天颖, 张超, 孙平, 等. 浙江省县域金融创新空间分异及驱动因素[J]. 经济地理, 2019, 39(4):146-154.
|
| [28] |
王弓, 叶蜀君. 金融集聚对新型城镇化影响的理论与实证研究[J]. 管理世界, 2016(1):174-175.
|
| [29] |
吴国维, 章颖, 朱萌, 等. 金融发展与新型城镇化互动效应研究——基于2004—2015年276个地级市数据的异质性面板Granger因果检验[J]. 生态经济, 2018, 34(8):100-104.
|
| [30] |
文先明, 王策, 熊鹰, 等. 湖南省新型城镇化与金融支持的耦合协调发展[J]. 经济地理, 2019, 39(7):96-105.
|
| [31] |
方创琳. 中国新型城镇化高质量发展的规律性与重点方向[J]. 地理研究, 2019, 38(1):13-22.
|
| [32] |
范香梅, 廖迪. 中外金融包容性发展差异及其影响因素研究[J]. 经济体制改革, 2017(5):175-180.
|
| [33] |
|
| [34] |
|
| [35] |
王修华, 赵亚雄. 中国金融包容的增长效应与实现机制[J]. 数量经济技术经济研究, 2019, 36(1):42-59.
|
/
| 〈 |
|
〉 |