
The Influence of Fiscal Decentralization on the Total Factor Productivity:Empirical Evidence from a Quasi-Natural Experiment of Province-Managing-County Reform
Received date: 2019-06-22
Revised date: 2019-12-29
Online published: 2025-04-11
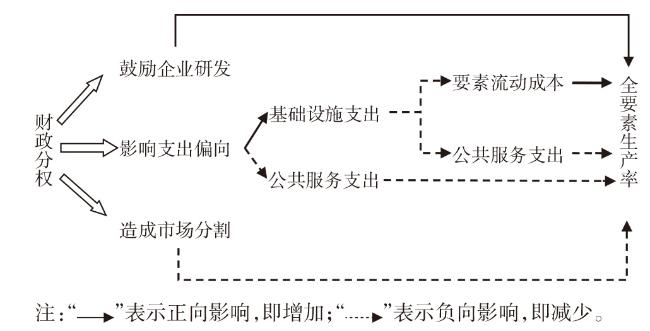
Province-Managing-County reform changed the management model of "province-city-county" in the past,effectively improving the level of fiscal decentralization of county-level governments. This paper takes the province-managing-county reform as a quasi-natural experiment for mitigating endogenous,the difference-in-difference method to evaluate the causal effect of fiscal decentralization on total factor productivity. The empirical study results show that firstly,the fiscal decentralization has more positive effect on total factor productivity than negative effect,but different forms of decentralization have heterogeneity. In particular,the decentralization of fiscal resources is beneficial to the total factor productivity,and the decentralization of economic administrative authority is not conducive to. Secondly,when the autonomy of the local government is enhanced,the government's preference of "emphasizing production and neglecting services" will increase the supply of infrastructure; reduce the supply of public service which can accelerate innovative elements gathering,resulting in a loss of total element productivity. Thirdly,the causal effect of fiscal decentralization on the total factor productivity tends to decline over time,and becomes no longer significant. At last, make out corresponding policy implications: reasonably divide the authority and expenditure responsibility of the government below the provincial level, raise the weight of public service indicators in the performance evaluation,and strengthen cooperation among counties.
SONG Meizhe , LIU Hanbo , YE Chen . The Influence of Fiscal Decentralization on the Total Factor Productivity:Empirical Evidence from a Quasi-Natural Experiment of Province-Managing-County Reform[J]. Economic geography, 2020 , 40(3) : 33 -42 . DOI: 10.15957/j.cnki.jjdl.2020.03.005
表1 各变量的描述性统计分析Tab.1 Descriptive statistical analysis of variables |
| 变量 | 均值 | 标准差 | 最小值 | 最大值 | 观测值个数 |
|---|---|---|---|---|---|
| y | 0.9943 | 0.1902 | 0.2760 | 2.4890 | 2 651 |
| x1 | 0.1336 | 0.0923 | 0.0125 | 2.1566 | 2 651 |
| x2 | 0.3133 | 0.1471 | 0.0444 | 1.3813 | 2 651 |
| x3 | 0.0549 | 0.0169 | 0.0111 | 0.1810 | 2 651 |
| x4 | 0.6258 | 0.4496 | 0.0597 | 4.5339 | 2 651 |
| x5 | 0.4611 | 0.1747 | 0.0730 | 0.9007 | 2 651 |
| x6 | 1.5891 | 1.0565 | 0.0630 | 6.1962 | 2 651 |
表2 Logit模型回归结果Tab.2 The regression results of Logit model |
| 变量 | 模型1 | 模型2 | 模型3 | 模型4 |
|---|---|---|---|---|
| x5 | -3.7640 | -5.4235 | -3.1724 | -3.1657 |
| (-3.96)*** | (-3.84)*** | (-1.97)** | (-1.97)** | |
| x7 | -0.7001 | -0.4384 | -0.4879 | |
| (-1.63) | (-0.98) | (-1.06) | ||
| x8 | 2.1258 | 2.0072 | ||
| (2.78)*** | (2.52)** | |||
| y | -0.3033 | |||
| (-0.52) | ||||
| Pseudo R2 | 0.0785 | 0.0908 | 0.1295 | 0.1307 |
注:1.*、**、***分别表示在10%、5%和1%的显著性水平上显著;2.括号内为统计量值。下同。 |
表3 t检验的结果Tab.3 The results of t test |
| 省份 | 处理组均值 | 对照组均值 | 两组均值的差异 | 统计量值 |
|---|---|---|---|---|
| 湖南省 | 1.0363 | 1.0619 | 0.0256 | 0.3040 |
| 山西省 | 1.0868 | 1.1058 | 0.0190 | 0.4561 |
表4 基准模型回归结果Tab.4 The regression results of benchmark model |
| 变量 | 模型5 | 模型6 | 模型7 | 模型8 |
|---|---|---|---|---|
| DID | 0.0675 | 0.0735 | 0.0680 | 0.0590 |
| (4.55)*** | (5.23)*** | (4.71)*** | (4.04)*** | |
| x1 | -0.0129 | -0.0215 | ||
| (-0.23) | (-0.39) | |||
| x2 | 0.0870 | 0.0802 | ||
| (2.53)** | (2.31)** | |||
| x3 | 0.9668 | 0.1701 | ||
| (2.09)** | (2.22)** | |||
| x4 | -0.0234 | -0.0392 | ||
| (-0.80) | (-1.33) | |||
| x5 | 0.2365 | 0.2363 | ||
| (9.29)*** | (9.28)*** | |||
| x6 | -0.0346 | -0.0085 | ||
| (-2.36)** | (-0.52) | |||
| 不控制 | -0.0226 | 不控制 | -0.0125 | |
| (-9.02)*** | (-3.59)*** | |||
| 控制 | 控制 | 控制 | 控制 | |
| 控制 | 控制 | 控制 | 控制 | |
| R2 | 0.0437 | 0.1956 | 0.3179 | 0.3050 |
表5 传导效应检验结果Tab.5 The results of conduction effect test |
| 变量 | 式(2)模型9 y | 式(3)模型10 x1 | 式(4)模型11 y | 式(5)模型12 x2 |
|---|---|---|---|---|
| DID | 0.0593 | 0.0173 | 0.0366 | -0.0245 |
| (4.07)*** | (2.48)** | (3.95)*** | (-3.76)*** | |
| x1 | -0.0216 | -0.0204 | ||
| (-0.39) | (-0.93) | |||
| x2 | 0.0962 | -0.0235 | ||
| (2.77)*** | (-0.93) | |||
| x3 | 0.1661 | 0.1887 | ||
| (2.47)** | (2.92)*** | |||
| x4 | -0.0389 | -0.0375 | ||
| (-1.32) | (-1.29) | |||
| x5 | 0.2410 | -0.0623 | 0.2391 | -0.0436 |
| (9.69)*** | (-1.67)* | (9.59)*** | (-1.25) | |
| x6 | -0.0084 | -0.0119 | -0.0081 | 0.0198 |
| (-0.51) | (-1.91)* | (-0.50) | (3.42)*** | |
| x7 | 0.0599 | 0.0231 | ||
| (5.01)*** | (2.06)** | |||
| -0.0124 | -0.0031 | -0.0128 | -0.0238 | |
| (-3.58)*** | (-2.16)** | (-3.79)*** | (-19.58)*** | |
| 控制 | 控制 | 控制 | 控制 | |
| 控制 | 控制 | 控制 | 控制 | |
| R2 | 0.3081 | 0.1850 | 0.2680 | 0.6414 |
表6 区分分权形式的回归结果Tab.6 The regression results of the different decentralized forms |
| 变量 | 模型13 | 模型14 | 模型15 | 模型16 |
|---|---|---|---|---|
| DID1 | 0.1629 | 0.1214 | 0.1042 | 0.0934 |
| (11.53)*** | (7.78)*** | (6.66)*** | (5.77)*** | |
| DID2 | -0.0641 | -0.0494 | -0.0363 | -0.0337 |
| (-3.04)*** | (-2.35)** | (-1.69)* | (-1.67)* | |
| x1 | -0.0255 | -0.0306 | ||
| (-0.47) | (-0.56) | |||
| x2 | 0.0775 | 0.0730 | ||
| (2.27)** | (2.10)** | |||
| x3 | 0.7773 | 0.2181 | ||
| (1.69)* | (0.43) | |||
| x4 | -0.0099 | -0.0224 | ||
| (-0.34) | (-0.76) | |||
| x5 | 0.6548 | 0.6026 | ||
| (9.01)*** | (8.00)*** | |||
| x6 | -0.0248 | -0.0066 | ||
| (-1.69)* | (-0.41) | |||
| 不控制 | -0.0161 | 不控制 | -0.0091 | |
| (-6.02)*** | (-2.57)*** | |||
| 控制 | 控制 | 控制 | 控制 | |
| 控制 | 控制 | 控制 | 控制 | |
| R2 | 0.1018 | 0.2075 | 0.3067 | 0.3113 |
表7 长期动态效应估计结果Tab.7 The regression results of the long-term dynamic effects |
| 年份 | DID估计系数 |
|---|---|
| 改革前一年 | -0.0012(-0.07) |
| 改革当年 | 0.0552(3.20)*** |
| 改革后第一年 | 0.0575(3.07)*** |
| 改革后第二年 | 0.0398(2.20)** |
| 改革后第三年 | -0.0319(-1.68)* |
| 改革后第四年 | 0.0296(1.58) |
| [1] |
沈坤荣, 付文林. 中国的财政分权制度与地区经济增长[J]. 管理世界, 2005(1):31-39,171-172.
|
| [2] |
熊小林, 李拓. 基本公共服务、财政分权与县域经济发展[J]. 统计研究, 2018, 35(2):66-74.
|
| [3] |
郑新业, 王晗, 赵益卓. “省直管县”能促进经济增长吗?—— 双重差分方法[J]. 管理世界, 2011(8):34-44,65.
|
| [4] |
|
| [5] |
|
| [6] |
金成晓, 朱培金. 财政分权、政府行为与经济增长[J]. 数量经济研究, 2011, 2(2):12-28.
|
| [7] |
|
| [8] |
李一花, 刘蓓蓓, 高焕洪. 基层财政分权测度与增长效应重估[J]. 财贸经济, 2014(6):25-35,13.
|
| [9] |
|
| [10] |
朱长存, 胡家勇. 分税制后我国财政分权度的衡量及其对经济增长的影响[J]. 当代经济管理, 2017, 39(4):72-76.
|
| [11] |
卞元超, 白俊红. “为增长而竞争”与“为创新而竞争”——财政分权对技术创新影响的一种新解释[J]. 财政研究, 2017(10):43-53.
|
| [12] |
李政, 杨思莹. 财政分权、政府创新偏好与区域创新效率[J]. 管理世界, 2018, 34(12):29-42,110,193-194.
|
| [13] |
伍格致, 游达明. 财政分权视角下环境规制对技术引进的影响机制[J]. 经济地理, 2018, 38(8):37-46.
|
| [14] |
|
| [15] |
杨志安, 邱国庆. 中国式财政分权与科技创新驱动发展:线性抑或倒“U”[J]. 华东经济管理, 2019, 33(1):5-10,2.
|
| [16] |
辛冲冲, 陈志勇. 财政分权、政府竞争与地方政府科技支出 ——基于中国省级面板数据的再检验[J]. 山西财经大学学报, 2018, 40(6):1-14.
|
| [17] |
顾乃华. 分税制改革与中国全要素生产率演变[J]. 中南财经政法大学学报, 2011(2):16-21.
|
| [18] |
余泳泽, 刘大勇. “中国式财政分权”与全要素生产率:“竞次”还是“竞优”[J]. 财贸经济, 2018, 39(1):23-37,83.
|
| [19] |
孙英杰, 林春. 财政分权背景下政府债务对全要素生产率的影响[J]. 华东经济管理, 2019, 33(3):86-93.
|
| [20] |
林春. 财政分权与中国经济增长质量关系——基于全要素生产率视角[J]. 财政研究, 2017(2):73-83,97.
|
| [21] |
卞元超, 宋凯艺, 白俊红. 双重分权、竞争激励与绿色全要素生产率提升[J]. 产业经济评论, 2018(3):15-34.
|
| [22] |
杜俊涛, 陈雨, 宋马林. 财政分权、环境规制与绿色全要素生产率[J]. 科学决策, 2017(9):65-92.
|
| [23] |
宋丽颖, 张伟亮, 刘源. 财政自主度对资源型城市全要素生产率的影响研究[J]. 财贸研究, 2018, 29(3):71-79.
|
| [24] |
张凯, 林小玲. 财政分权、金融发展与全要素生产率提升[J]. 经济与管理评论, 2019(1):13-23.
|
| [25] |
杨志安, 王佳莹. 财政分权与绿色全要素生产率——基于系统GMM及门槛效应的检验[J]. 生态经济, 2018, 34(11):132-139.
|
| [26] |
陈思霞, 卢盛峰. 分权增加了民生性财政支出吗?——来自中国“省直管县”的自然实验[J]. 经济学(季刊), 2014, 13(4):1261-1282.
|
| [27] |
|
| [28] |
谭之博, 周黎安, 赵岳. 省管县改革、财政分权与民生——基于“倍差法”的估计[J]. 经济学(季刊), 2015, 14(3):1093-1 114.
|
| [29] |
毛捷, 吕冰洋, 陈佩霞. 分税的事实:度量中国县级财政分权的数据基础[J]. 经济学(季刊), 2018, 17(2):499-526.
|
| [30] |
刘志红, 王艺明. “省直管县”改革能否提升县级财力水平?[J]. 管理科学学报, 2018, 21(10):1-13.
|
| [31] |
黄瑜南. 省直管县财政体制改革的民生效应研究[D]. 南昌: 江西财经大学, 2018.
|
| [32] |
孙学涛, 王振华, 张广胜. 县域全要素生产率提升中存在结构红利吗?——基于中国1869个县域的面板数据分析[J]. 中南财经政法大学学报, 2017(6):73-82.
|
| [33] |
蔡嘉瑶, 张建华. 财政分权与环境治理——基于“省直管县” 财政改革的准自然实验研究[J]. 经济学动态, 2018(1):53-68.
|
| [34] |
田玉萍. 政府推进绩效管理的着力点[J]. 中国行政管理, 2018(2):19-21.
|
/
| 〈 |
|
〉 |