
The Impact of Terrorist Activities on Tourism Development in Countries along the Belt and Road
Received date: 2019-06-25
Revised date: 2020-02-10
Online published: 2025-04-11
Countries along the "Belt and Road Initiative" are areas prone to terrorist activities. This paper examines the impact of terrorist activities and their spatial spillover effects on the tourism development in "the Belt and Road" countries by using Spatial Durbin Model. The results show that: 1) both terrorist activities and tourism development have remarkable spatial agglomeration characteristic in "the Belt and Road" areas; 2) the direct,indirect(spatial) and total effect of terrorist activities on tourism development are all negative,which means that terrorism not only restrains local tourism development,but also produces spillover effect to the surrounding countries or regions,and the spatial spillover effect is greater; 3) at the sub-regional level,the direct,indirect and total impact of terrorist activities of China-Mongolia-Russia-Central Asia-Southeast Asia and South Asia-West Asia are all negative,especially in the area of South Asia-Western Asia,the effects are greater and more significant. This means that the establishment of the Anti-Terrorism Cooperation Alliance and the Tourism Security Cooperation Mechanism are necessary measures to deal with the "Belt and Road" terrorist activities, while South Asia-West Asia is the key area for this cooperation.
XU Peiyuan , LIU Yafang . The Impact of Terrorist Activities on Tourism Development in Countries along the Belt and Road[J]. Economic geography, 2020 , 40(3) : 216 -224 . DOI: 10.15957/j.cnki.jjdl.2020.03.024
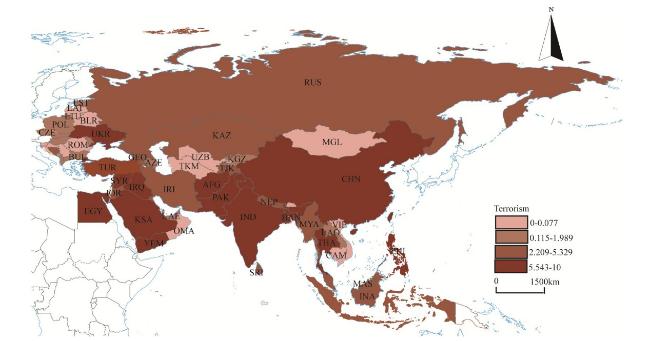
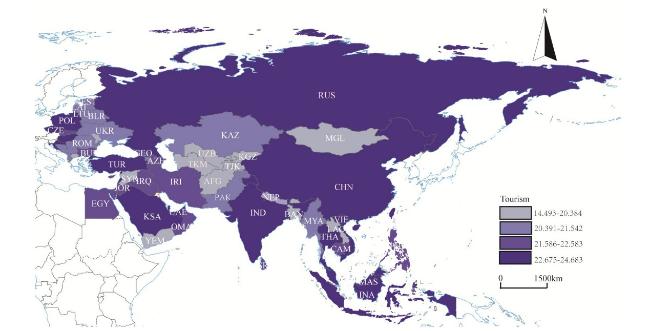
图1 “一带一路”沿线国家恐怖活动的空间分布特征注:1.该图基于国际测绘地理信息局标准地图服务系统下载的审图号为GS(2016)1667号的标准地图制作,底图无修改,图2同;2.参考《全球恐怖主义指数报告》中GTI指数划分标准,对Terror数值进行四等分,数值越大表明恐怖活动程度越高。 Fig.1 Spatial distribution of terrorist activities in countries along B&R |
表1 变量选取及说明Tab.1 Selection and Description of Variables |
| 变量 | 衡量指标 | 数据来源 |
|---|---|---|
| 旅游业发展 | 入境旅游收入(Tour) | 世界发展指数 |
| 恐怖活动 | 各国恐怖活动指数(Terror) 恐怖活动死亡人数(Death,用于稳健性检验) | 美国经济与和平研究所公布的《全球恐怖主义指数报告》 |
| 旅游资源水平 | 旅游资源总数/国土面积(Resource) | 《世界遗产名录》 |
| 经济发展水平 | 各国人均GDP(Pgdp) | 世界发展指数 |
| 对外开放水平 | 经济自由度指数(Openness) | 美国传统基金会经济自由度指数 |
| 旅游服务水平 | 服务业就业人数/总就业人数(Service) | 世界发展指数 |
| 交通便利化水平 | 航空客运量(Airline) | 世界发展指数 |
| 外商投资水平 | 各国外商直接投资(FDI) | 世界发展指数 |
注:旅游收入、GDP、进出口总额、FDI均采用2005年美元不变价;为消除数据不同量纲的影响和减少模型中的异方差性,实证分析部分,除比值变量以外,其余所有变量均取对数值。 |
表2 “一带一路”沿线国家恐怖活动和旅游业发展的Moran's ITab.2 Moran's I of terrorist activities and tourism development in countries along B&R |
| 年份 | Terror | Tour | |||
|---|---|---|---|---|---|
| Moran's I | Z(I) | Moran's I | Z(I) | ||
| 2010 | 0.234*** | 2.773 | 0.202* | 1.815 | |
| 2011 | 0.243*** | 2.864 | 0.198* | 1.766 | |
| 2012 | 0.186** | 2.185 | 0.199* | 1.772 | |
| 2013 | 0.283*** | 3.307 | 0.190* | 1.678 | |
| 2014 | 0.265*** | 3.107 | 0.195* | 1.691 | |
| 2015 | 0.258*** | 3.037 | 0.206* | 1.844 | |
| 2016 | 0.260** | 2.322 | 0.189** | 1.996 | |
| 2017 | 0.264*** | 2.566 | 0.200* | 1.670 | |
表3 SDM模型估计结果Tab.3 SDM Model estimation results |
| 变量 | 估计系数 | t值 | 变量 | 估计系数 | t值 |
|---|---|---|---|---|---|
| α | 7.474*** | 11.809 | 0.342*** | 5.563 | |
| Terror | -0.374** | -2.038 | W·Terror | -0.120*** | -2.952 |
| Pgdp | 0.597*** | 2.267 | W·Pgdp | 0.278*** | 3.174 |
| Openness | 0.154* | 1.769 | W·Openness | 0.087 | 1.043 |
| Service | 0.282 | 1.532 | W·Service | 0.062 | 1.415 |
| Airline | 0.115*** | 4.481 | W·Airline | 0.145** | 2.439 |
| FDI | 0.054 | 1.359 | W·FDI | 0.067* | 1.831 |
| Resource | 0.042* | 1.892 | W·Resource | 0.019* | 1.670 |
表4 SDM模型的直接效应、间接效应和总效应Tab.4 Direct, indirect and total effects of SDM Model |
| 变量 | 直接效应 | 间接效应 | 总效应 |
|---|---|---|---|
| Terror | -0.478*(-1.723) | -1.721**(-2.191) | -2.199**(-2.446) |
| Pgdp | 0.596***(9.076) | 0.025*(1.921) | 0.621*(1.742) |
| Openness | 0.153*(1.911) | 0.072*(1.761) | 0.225*(1.742) |
| Service | 0.291(1.569) | 0.049 (1.390) | 0.340(1.627) |
| Airline | 0.113***(4.458) | -0.002*(-1.956) | 0.111(1.450) |
| FDI | 0.054***(2.747) | -0.034(-0.651) | 0.020(1.260) |
| Resource | 0.031*(1.972) | 0.010(0.997) | 0.041(1.379) |
注:括号内为t值;由于篇幅限制,控制变量的实证结果及分析未给出。 |
表5 “一带一路”沿线各次区域SDM的回归结果Tab.5 Regression Results of SDM in various subregions along B&R |
| 中蒙俄—中亚—东南亚 | 南亚—西亚 | 中东欧 | |
|---|---|---|---|
| 空间效应系数 | 0.323*(3.042) | 0.107*(1.641) | 0.236**(1.943) |
| Terror估计系数 | -0.152(-0.447) | -1.165*(-1.894) | -1.118(-0.625) |
| 直接效应 | -1.058*(-1.647) | -1.210**(-1.977) | -0.865(-0.478) |
| 间接效应 | -2.619**(-2.365) | -2.791***(-3.479) | -3.747(-1.402) |
| 总效应 | -3.677***(-3.026) | -4.001***(-3.986) | -4.612(-1.413) |
注:仅列出恐怖活动Terror的回归结果;括号内为t值。 |
| [1] |
张晓磊, 张二震. “一带一路”战略的恐怖活动风险及中国对策[J]. 国际贸易, 2016(3):27-32.
|
| [2] |
|
| [3] |
|
| [4] |
成观雄, 喻晓玲. 突发事件对边疆地区入境旅游的影响—— 以新疆“7.5”事件为例[J]. 经济地理, 2015, 35(5):204-208.
|
| [5] |
|
| [6] |
|
| [7] |
|
| [8] |
卢光盛, 周洪旭. 东南亚恐怖主义新态势及其影响与中国的应对[J]. 国际安全研究, 2018, 36(5):3-20.
|
| [9] |
|
| [10] |
|
| [11] |
董锁成, 赵敏燕, 郭鹏, 等. “一带一路”生态旅游带发展模式与对策[J]. 中国科学院院刊, 2016, 31(6):647-655.
|
| [12] |
马凯, 刘启刚. “一带一路”视阈下国际反恐警务合作存在的问题与路径[J]. 广西警察学院学报, 2018, 31(5):99-102.
|
| [13] |
王道转. “一带一路”下中国与东盟国家应对网络恐怖主义研究[J]. 中国公共安全:学术版, 2018(4):87-90.
|
| [14] |
宫玉涛. “一带一路”沿线的恐怖主义活动新态势解析[J]. 党政研究, 2016(2):18-26.
|
| [15] |
赵敏燕, 董锁成, 王喆, 等. “一带一路”沿线国家安全形势评估及对策[J]. 中国科学院院刊, 2016, 31(6):689-696.
|
| [16] |
贾宇, 李恒. 恐怖活动对“一带一路”倡议实施的威胁评估与对策研究[J]. 宁夏社会科学, 2017(1):35-43.
|
| [17] |
|
| [18] |
张宁. “一带一路”框架下中国与中亚国家反极端主义合作[J]. 国际安全研究, 2018, 36(5):137-154.
|
/
| 〈 |
|
〉 |