
Pre-evaluation of the Role of Xiongan New District in the Low Carbon Synergy Development of Beijing-Tianjin-Hebei Urban Agglomeration
Received date: 2019-06-26
Revised date: 2020-01-21
Online published: 2025-04-11
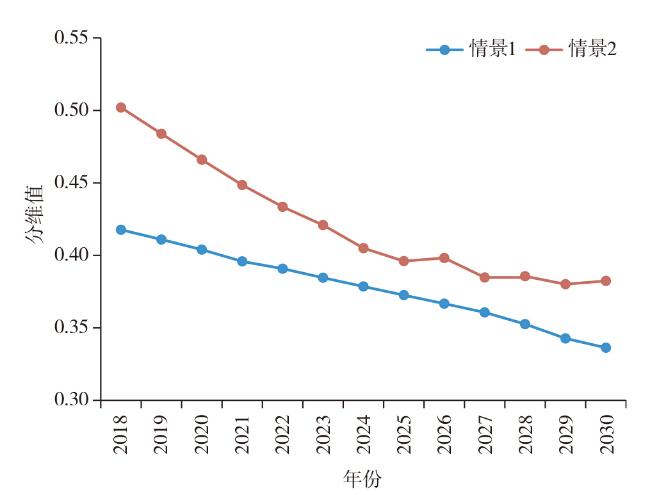
Based on the development of Low Carbon economic connection intensity model and multi-source radiation effect superposition model,taking fractal dimension calculation and comparison and GIS spatial analysis as quantitative evaluation tools,the promotion effect of the establishment of Xiongan New District on the Low Carbon coordinated development of Beijing-Tianjin-Hebei urban agglomeration is evaluated by applying anti-reality research methods which suppose a scenario is that Xiongan New District has not been established. By comparing the Low Carbon economic radiation of Beijing-Tianjin-Hebei urban agglomeration under two different scenarios (with and without Xiongan New District) in 2018-2030,the following conclusions can be drawn: 1) If Xiongan New District is not established,the problem of gradient outage in Beijing-Tianjin-Hebei urban agglomeration will be aggravated; 2) The establishment of Xiongan New District can effectively promote the rapid growth of middle-level cities and solve the problem of gradient outage of urban agglomeration,which will improve the spatial distribution of Low Carbon economic linkages in the southwest and northeast of Beijing-Tianjin-Hebei urban agglomeration; 3) The establishment of Xiongan New District can effectively promote the fractal dimension of Low Carbon economic linkages in Beijing-Tianjin-Hebei urban agglomeration,and this promotion effect will become more and more significant after 2025,which is conducive to the overall Low Carbon coordinated development of urban agglomeration.
ZHANG Xuehua , XU Wenbo , ZHANG Baoan . Pre-evaluation of the Role of Xiongan New District in the Low Carbon Synergy Development of Beijing-Tianjin-Hebei Urban Agglomeration[J]. Economic geography, 2020 , 40(3) : 16 -23 . DOI: 10.15957/j.cnki.jjdl.2020.03.003
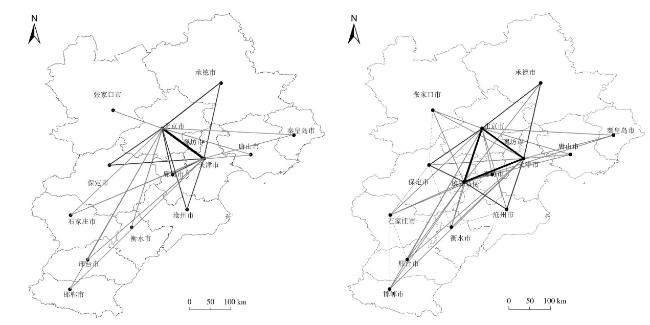
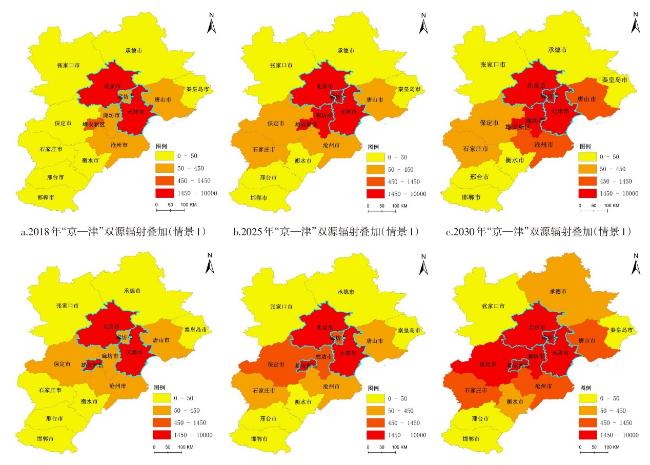
图5 2018、2025和2030年京津冀城市群低碳经济联系强度空间分布注:1.图中蓝色圈划定城市为辐射中心,其周边城市接受到的低碳经济联系强度(即辐射强度)被划分为四个等级,并以不同颜色描绘。其中0~50以黄色显示,为梯度最低的第4等级;50~450以橙色显示,为梯度较低的第3等级;450~1 450以橙红色显示,为梯度较高的第2等级;1 450以上红色显示,为梯度最高的第1等级。2.图中上排对应“京—津”双源辐射的情景1,下排对应“京—津—雄”三源辐射的情景2。 Fig.5 Spatial distribution of low carbon economy linkages strength in Beijing-Tianjin-Hebei urban agglomeration in 2018,2025 and 2030 |
| [1] |
谢孟欢. 仇保兴: 城市群协调发展要有“梯度”, 不能“断档”[EB/OL]. 每经网, http://www.nbd.com.cn/articles/2017-06-01/1240941.html,2018-08-01.
|
| [2] |
孙铁山. 中国三大城市群集聚空间结构演化与地区经济增长[J]. 经济地理, 2016, 36(5):63-70.
|
| [3] |
乔旭宁, 杨德刚, 毛汉英, 等. 基于经济联系强度的乌鲁木齐都市圈空间结构研究[J]. 地理科学进展, 2007, 26(6):86-95.
|
| [4] |
陈勇, 陈嵘, 艾南山, 等. 城市规模分布的分形研究[J]. 经济地理, 2015, 35(3):48-53.
|
| [5] |
谈明洪, 范存会. Zipf维数和城市规模分布的分维值的关系探讨[J]. 地理研究, 2004, 23(2):243-248.
|
| [6] |
仵宗卿, 戴学珍, 杨吾扬. 帕雷托公式重构及其与城市体系演化[J]. 人文地理, 2000, 15(1):15-19.
|
| [7] |
|
| [8] |
|
| [9] |
陈彦光. 城市形态的分维估算与分形判定[J]. 地理科学进展, 2017, 36(5):529-539.
|
| [10] |
|
| [11] |
|
| [12] |
关燕宁, 郭杉, 刘旭颖, 等. 基于遥感信息的城市地表能量空间分布及特征研究——以国际宜居城市为例[J]. 地球信息科学学报, 2014, 16(5):806-814.
|
| [13] |
唐娅娇, 谭丹. 长株潭城市群推进低碳城镇化的思考[J]. 经济地理, 2011, 31(5):770-772.
|
| [14] |
刘细良, 秦婷婷. 低碳经济视角下的长株潭城市群交通系统优化研究[J]. 经济地理, 2010, 30(7):1124-1 128.
|
| [15] |
|
| [16] |
|
| [17] |
|
| [18] |
|
| [19] |
|
| [20] |
丁俊, 王开泳. 珠三角城市群工业生产空间的时空演化及驱动机制[J]. 地理研究, 2018, 37(1):53-66.
|
| [21] |
Benoit B Mandelbrot. The fractal geometry of nature[M]. W. H. Freeman and Company,1982:173-176.
|
| [22] |
|
| [23] |
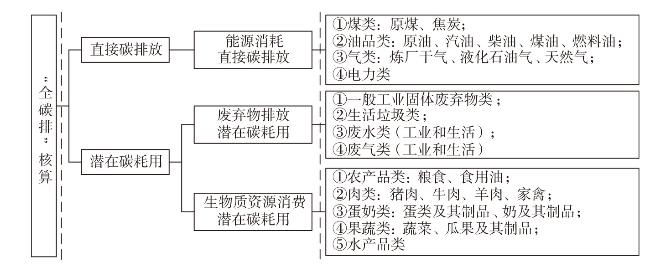
张雪花, 张宏伟, 张宝安. “全碳效率”测度与生态经济评价 (第一版)[M]. 北京: 中国环境出版社, 2015.
|
| [24] |
|
| [25] |
王少剑, 苏泳娴, 赵亚博. 中国城市能源消费碳排放的区域差异、空间溢出效应及影响因素[J]. 地理学报, 2018, 73(3):414-428.
|
| [26] |
|
| [27] |
张雪花, 郝彪, 张宝安. 基于GIS的城市绿化生态服务量及其均等化评价[J]. 生态环境学报, 2017, 26(4):547-552.
|
| [28] |
耿虹, 时二鹏, 王立舟, 等. 基于GIS-DEA的大城市周边小城镇发展效率评价——以武汉为例[J]. 经济地理, 2018, 38(10):72-79.
|
| [29] |
|
| [30] |
刘帅, 李胜功, 于贵瑞, 等. 不同降水梯度下草地生态系统地表能量交换[J]. 生态学报, 2010, 30(3):557-567.
|
| [31] |
|
| [32] |
|
| [33] |
黄金川, 林浩曦. 京津冀城市群多情景空间演化模拟[J]. 地理研究, 2017, 36(3):506-517.
|
| [34] |
|
/
| 〈 |
|
〉 |