
The Dislocation Characteristics and Mechanism of Network Attention and Tourists about Chinese National Scenic Spots
Received date: 2019-08-13
Revised date: 2019-12-29
Online published: 2025-04-08
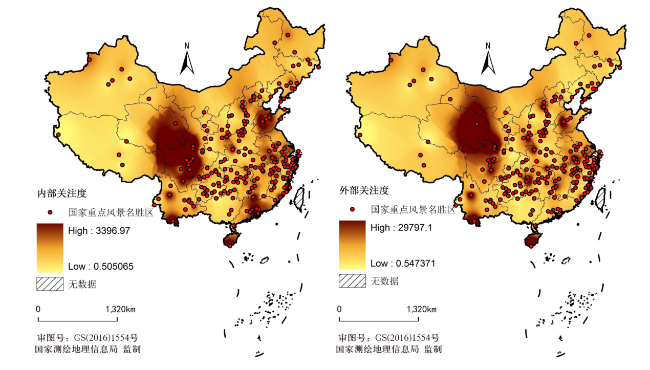
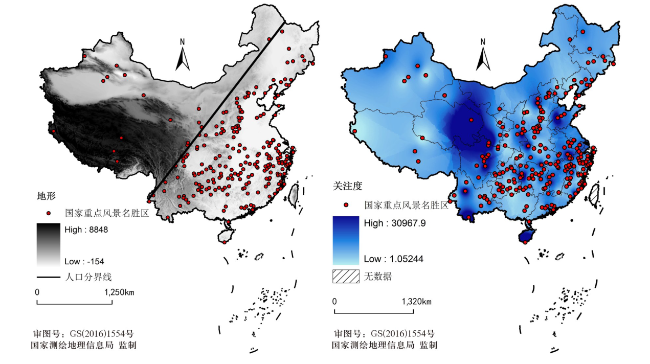
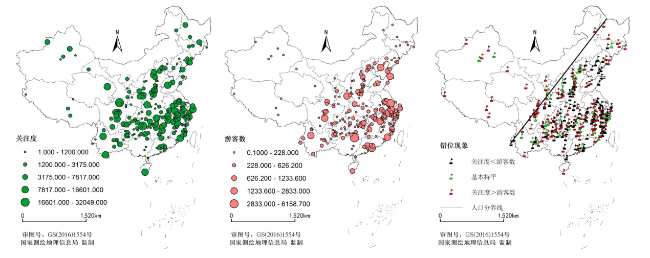
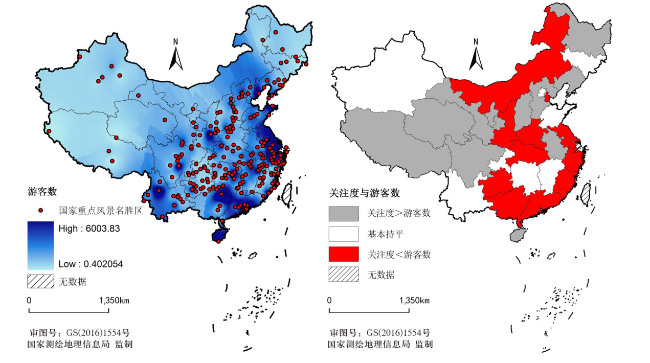
This article uses the Baidu index to construct the attention network of Chinese national scenic spots,reveal the characteristics of network structure,and further analyze the "dislocation" characteristic between network attention and actual visitors and its impact mechanism. The attention network of Chinese national scenic spots has rhombic structure characteristics. The four vertices of the rhombus are located in Beijing,Guangdong,Sichuan and Shanghai. The characteristics of network structure are greatly influenced by the development of regional economy. On the whole,most of the Chinese national scenic spots are in the category of "name does not correspond to reality",which is basically located in the northwest of the population demarcation line; the areas of "name is less than reality" and "name is worthy of reality" are mainly staggered in the southeast of the population demarcation line. The influence mechanism of tourists in Chinese national scenic spots is relatively complex,and the network attention is only one of the factors,not the decisive factor,which is also the main cause of its "dislocation phenomenon". The actual tourists of Chinese national scenic spots is the result of the combined efforts of many factors,and network attention is one of the interactive leading factors only in the Central and Western regions. In the future,we need to further improve the "assessment and evaluation mechanism" of Chinese national scenic spots,for different types,there is a need for targeted publicity and marketing.
FANG Yelin , CHENG Xuelan , HUANG Zhenfang , GUO Biebei . The Dislocation Characteristics and Mechanism of Network Attention and Tourists about Chinese National Scenic Spots[J]. Economic geography, 2020 , 40(4) : 204 -213 . DOI: 10.15957/j.cnki.jjdl.2020.04.023
表1 网络中心度计算结果Tab.1 Calculation results of network centrality |
| 省份 | 度数中心 度(Out) | 度数中心 度(In) | 接近中心 度(Out) | 接近中心 度(In) | 中间中 心度 | 省份 | 度数中心 度(Out) | 度数中心 度(In) | 接近中心 度(Out) | 接近中心 度(In) | 中间中 心度 |
|---|---|---|---|---|---|---|---|---|---|---|---|
| 北京 | 0.034 | 0.200 | 0.263 | 0.484 | 0.251 | 广东 | 0.096 | 0.241 | 0.556 | 0.462 | 0.251 |
| 天津 | 0.013 | 0.090 | 0.264 | 0.417 | 0.030 | 广西 | 0.015 | 0.085 | 0.251 | 0.405 | 0.012 |
| 河北 | 0.069 | 0.136 | 0.417 | 0.429 | 0.251 | 海南 | 0.074 | 0.040 | 0.500 | 0.361 | 0.080 |
| 山西 | 0.099 | 0.096 | 0.577 | 0.417 | 0.318 | 重庆 | 0.039 | 0.116 | 0.492 | 0.400 | 0.150 |
| 内蒙古 | 0.011 | 0.068 | 0.250 | 0.385 | 0.000 | 四川 | 0.399 | 0.147 | 0.909 | 0.448 | 0.368 |
| 辽宁 | 0.086 | 0.108 | 0.517 | 0.400 | 0.251 | 贵州 | 0.121 | 0.072 | 0.625 | 0.380 | 0.084 |
| 吉林 | 0.018 | 0.082 | 0.250 | 0.395 | 0.026 | 云南 | 0.183 | 0.074 | 0.750 | 0.385 | 0.171 |
| 黑龙江 | 0.049 | 0.079 | 0.250 | 0.400 | 0.278 | 西藏 | 0.021 | 0.014 | 0.250 | 0.249 | 0.005 |
| 上海 | 0.000 | 0.181 | 0.250 | 0.448 | 0.000 | 陕西 | 0.114 | 0.116 | 0.600 | 0.411 | 0.365 |
| 江苏 | 0.116 | 0.212 | 0.600 | 0.455 | 0.368 | 甘肃 | 0.041 | 0.060 | 0.251 | 0.385 | 0.036 |
| 浙江 | 0.308 | 0.173 | 0.833 | 0.455 | 0.368 | 青海 | 0.060 | 0.026 | 0.370 | 0.357 | 0.096 |
| 安徽 | 0.201 | 0.116 | 0.732 | 0.405 | 0.341 | 宁夏 | 0.016 | 0.030 | 0.251 | 0.361 | 0.010 |
| 福建 | 0.192 | 0.116 | 0.714 | 0.400 | 0.368 | 新疆 | 0.054 | 0.047 | 0.253 | 0.385 | 0.010 |
| 江西 | 0.270 | 0.090 | 0.833 | 0.385 | 0.287 | Min | 0.000 | 0.014 | 0.250 | 0.249 | 0.000 |
| 山东 | 0.112 | 0.161 | 0.577 | 0.429 | 0.357 | Max | 0.399 | 0.241 | 0.909 | 0.484 | 0.368 |
| 河南 | 0.103 | 0.170 | 0.600 | 0.448 | 0.251 | 东部 | 0.101 | 0.158 | 0.519 | 0.468 | 0.236 |
| 湖北 | 0.089 | 0.129 | 0.536 | 0.417 | 0.358 | 中部 | 0.135 | 0.104 | 0.543 | 0.406 | 0.257 |
| 湖南 | 0.379 | 0.106 | 0.857 | 0.400 | 0.342 | 西部 | 0.105 | 0.070 | 0.475 | 0.376 | 0.130 |
表2 游客量影响因素探测结果Tab.2 Detection results of tourists |
| 探测因子 | 全国 | 东部地区 | 中部地区 | 西部地区 |
|---|---|---|---|---|
| InB | 0.123 | 0.231 | 0.124 | 0.158 |
| OutB | 0.256 | 0.109 | 0.095 | 0.272 |
| EC | 0.428 | 0.318 | 0.385 | 0.103 |
| RK | 0.160 | 0.202 | 0.188 | 0.306 |
| WL | 0.162 | 0.146 | 0.157 | 0.126 |
| ET | 0.215 | 0.235 | 0.314 | 0.411 |
| SC | 0.358 | 0.406 | 0.203 | 0.215 |
| CS | 0.208 | 0.210 | 0.124 | 0.204 |
| CG | 0.132 | 0.135 | 0.085 | 0.157 |
| CH | 0.230 | 0.216 | 0.132 | 0.302 |
| 主导交互因子 | EC∩ET | SC∩CH | InB∩SC | OutB∩CH |
| 主导交互因子q值 | 0.503 | 0.525 | 0.497 | 0.454 |
| [1] |
吴必虎, 俞曦. 旅游规划原理[M]. 北京: 中国旅游出版社, 2010.
|
| [2] |
方叶林. 中国省域旅游业发展效率:测度、演化及机理[M]. 北京: 北京师范大学出版社, 2016.
|
| [3] |
王芳. 基于百度指数的中国大陆5A级景区旅游信息流网络空间格局研究[D]. 南京: 南京师范大学, 2015.
|
| [4] |
|
| [5] |
|
| [6] |
黄先开, 张丽峰, 丁于思. 百度指数与旅游景区游客容量的关系及预测研究——以北京故宫为例[J]. 旅游学刊, 2013, 28(11):93-100.
|
| [7] |
张斌儒, 黄先开, 刘树林. 基于网络搜索数据的旅游收入预测[J]. 经济问题探索, 2015(8):154-160.
|
| [8] |
林炜铃, 邹永广, 郑向敏. 旅游安全网络关注度区域差异研究——基于中国31个省市区旅游安全百度指数[J]. 人文地理, 2014, 29(6):154-160.
|
| [9] |
蔡卫民, 彭晶, 覃娟娟. 韶山的全国网络关注热度矩阵及推广策略研究[J]. 旅游科学, 2016, 30(4):61-72.
|
| [10] |
冯娜, 李君轶. 外向在线旅游信息流与入境旅游流的耦合分析——以美加入境旅游流为例[J]. 旅游学刊, 2014, 29(4):79-86.
|
| [11] |
罗秋菊, 梁思贤. 基于数字足迹的自驾车旅游游客流时空特征研究——以云南为例[J]. 旅游学刊, 2016, 31(12):41-50.
|
| [12] |
路紫, 刘娜,
|
| [13] |
王超, 骆克任. 基于网络舆情的旅游包容性发展研究——以湖南凤凰古城门票事件为例[J]. 经济地理, 2014, 34(1):161-166.
|
| [14] |
石张宇, 房丽. 安徽省旅游景区网络关注度时空特征研究[J]. 安庆师范学院学报:自然科学版, 2016, 22(4):106-111.
|
| [15] |
李山, 邱荣旭, 陈玲. 基于百度指数的旅游景区网络空间关注度:时间分布及其前兆效应[J]. 地理与地理信息科学, 2008, 24(6):102-107.
|
| [16] |
马丽君, 孙根年, 黄芸玛, 等. 城市国内游客量与游客网络关注度时空相关分析[J]. 经济地理, 2011, 31(4):680-685.
|
| [17] |
林志慧, 马耀峰, 刘宪锋, 等. 旅游景区网络关注度时空分布特征分析[J]. 资源科学, 2012, 34(12):2427-2433.
|
| [18] |
邹永广, 林炜铃, 郑向敏. 旅游安全网络关注度时空特征及其影响因素[J]. 旅游学刊, 2015, 30(2):101-109.
|
| [19] |
孙烨, 张宏磊, 刘培学, 等. 基于旅游者网络关注度的旅游景区日游客量预测研究——以不同客户端百度指数为例[J]. 人文地理, 2017, 32(3):152-160.
|
| [20] |
刘嘉毅, 陈玲, 陶婷芳. 旅游舆情网络关注度城市差异——来自289个城市百度指数的实证研究[J]. 信息资源管理学报, 2018(3):93-101.
|
| [21] |
熊丽芳, 甄峰, 王波, 等. 基于百度指数的长三角核心区城市网络特征研究[J]. 经济地理, 2013, 33(7):67-73.
|
| [22] |
赵映慧, 高鑫, 姜博. 东北三省城市百度指数的网络联系层级结构[J]. 经济地理, 2015, 35(5):32-37.
|
| [23] |
郝修宇, 徐培玮. 基于百度指数和引力模型的城市网络对比——以京津冀城市群为例[J]. 北京师范大学学报, 2017, 53(4):479-485.
|
| [24] |
方叶林, 黄震方, 涂玮. 社会网络视角下长三角城市旅游经济空间差异[J]. 热带地理, 2013, 33(2):212-218.
|
| [25] |
刘军. 整体网分析讲义——UCINET软件实用指南[M]. 上海: 格致出版社, 2009.
|
| [26] |
王劲峰, 徐成东. 地理探测器:原理与展望[J]. 地理学报, 2017, 72(1):116-134.
|
| [27] |
丁悦, 蔡建明, 任周鹏, 等. 基于地理探测器的国家级经济技术开发区经济增长率空间分异及影响因素[J]. 地理科学进展, 2014, 33(5):657-666.
|
| [28] |
冯科, 吴次芳, 陆张维, 等. 中国土地经济密度分布的时空特征及规律——来自省际面板数据的分析[J]. 经济地理, 2008, 28(5):817-820.
|
| [29] |
方叶林, 黄震方, 李经龙, 等. 中国省域旅游经济增长的时空跃迁及其趋同研究[J]. 地理科学, 2018, 38(10):1616-1623.
|
| [30] |
樊纲, 王小鲁, 马光荣. 中国市场化进程对经济增长的贡献[J]. 经济研究, 2011(9):4-16.
|
| [31] |
余凤龙, 黄震方, 曹芳东, 等. 中国城镇化进程对旅游经济发展的影响[J]. 自然资源学报, 2014, 29(8):1297-1309.
|
| [32] |
干春晖, 郑若谷, 余典范. 中国产业结构变迁对经济增长和波动的影响[J]. 经济研究, 2011(5):4-17.
|
| [33] |
刘瑞明, 李林, 亢延锟, 等. 景点评选、政府公共服务供给与地区旅游经济发展[J]. 中国工业经济, 2018(2):118-136.
|
/
| 〈 |
|
〉 |
