
Temporal and Spatial Analysis of County Agricultural Efficiency in Anhui Province Based on SSBM-ESDA Model
Received date: 2019-06-13
Revised date: 2019-11-25
Online published: 2025-04-08
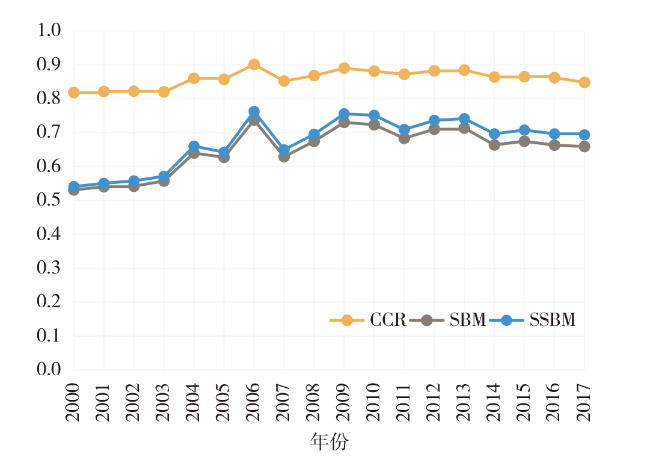
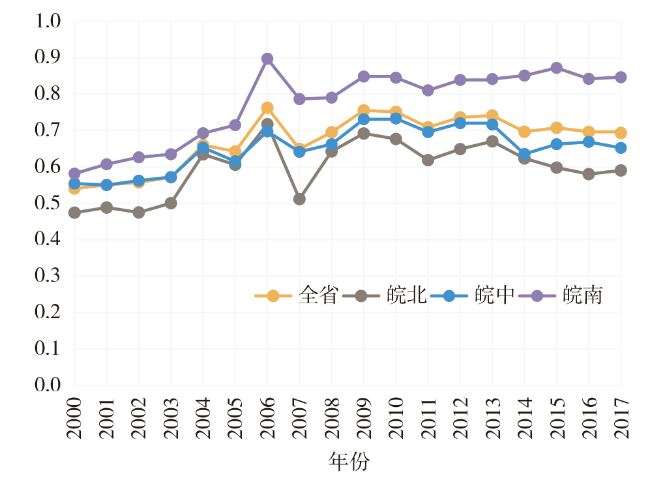
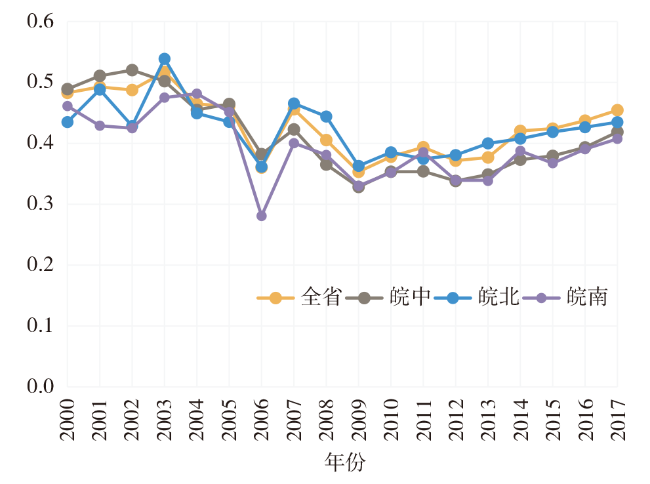
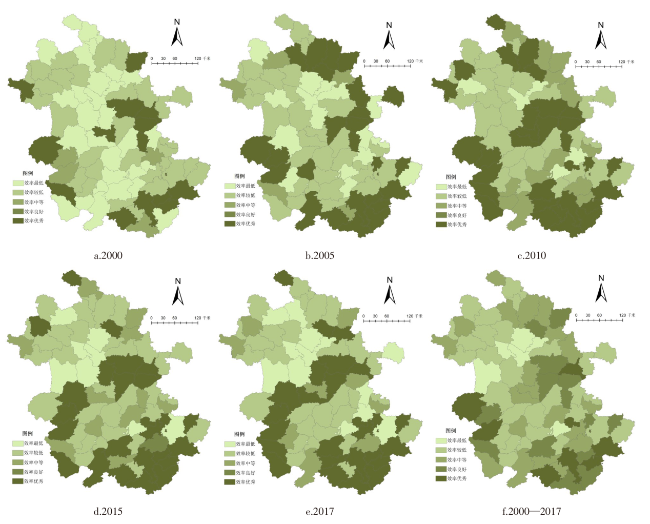
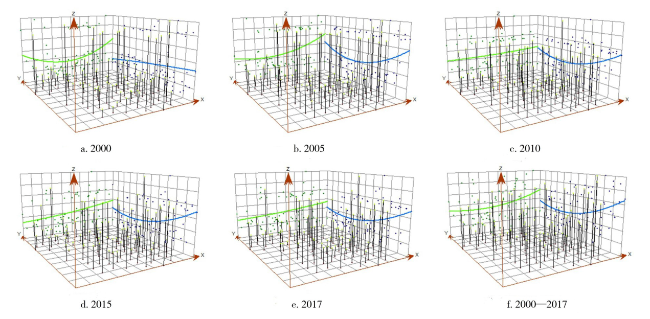
Taking green agriculture development as the guide,chose agricultural low carbon emission as the non-expected output index,and adopted the super-efficiency SBM model(SSBM model) and combined with the Exploratory Spatial Data Analysis method(ESDA). The development level,spatial pattern and evolutional trend of agricultural efficiency in Anhui province from 2000 to 2017 were analyzed by using county unit. It is found that. 1) The traditional DEA model ignores the negative effects of unwanted output such as agricultural carbon emissions,thus overestimating the actual state of agricultural resource utilization,and the SSBM model based on super-efficiency can better identify the relationship between the evaluation units. 2) During the research period,the agricultural efficiency in Anhui Province was fluctuating,but it was generally at a moderate level,and the spatial distribution of agricultural efficiency in counties was uneven. The trend of spatial change showed a gradual increase from west to East and U-type growth from north to South. The increase of the difference between North and South is the dominant factor in the increase of the difference of agricultural efficiency between counties(cities and districts) in Anhui Province. 3) In addition to 2010,the agricultural efficiency of Anhui Province is positively related,and the spatial differences have narrowed,but the degree of spatial concentration is relatively weak. 4) During the research period,the number of counties(cities and districts) that are positively related to the agricultural efficiency space in Anhui Province has increased,indicating that the agricultural efficiency space in Anhui Province has further gathered during this period,and the LL-type cluster in northern Anhui Province should be the focus of agricultural development in Anhui Province.
WANG Haifei . Temporal and Spatial Analysis of County Agricultural Efficiency in Anhui Province Based on SSBM-ESDA Model[J]. Economic geography, 2020 , 40(4) : 175 -183 . DOI: 10.15957/j.cnki.jjdl.2020.04.020
| 一级指标 | 二级指标 | 表征含义 |
|---|---|---|
| 投入指标 | 乡村从业人员数(万人) | 以第一产业就业人员数量计算,反映在农业生产经营过程中从事农林牧渔业的从业人员所提供的劳动力资源 |
| 农业机械化总动力(万kW) | 机械动力的使用是农业技术水平的重要体现包括耕作机械、农用排灌机械等多种农用机械的使用,以及相关能源动力的消耗 | |
| 农作物播种面积(千hm2) | 反映农业生产经营实际利用的土地规模,相比耕地面积能准确衡量土地实际利用率 | |
| 农用化肥施用量(万t) | 为农业生产效率的典型的农资投入,化肥施用量是指实际应用于农业生产的化学肥料的总和 | |
| 农药使用量(万t) | 农业生产效率的典型的农资投入,采用农药使用量 | |
| 农膜使用量(万t) | 农业生产效率的典型的农资投入 | |
| 有效灌溉面积(千hm2) | 衡量农业生产水利化程度和农业生产稳定程度 | |
| 农村用电量(kW·h) | 反映农业生产过程中的能源投入 | |
| 期望产出指标 | 农林牧渔业总产值(亿元) | 农、林、牧、渔业全部产品的总量。反映农业生产总规模和总成果 |
| 非期望产出指标 | 农业碳排放量(万t) | 化肥、农药、农膜、农用柴油、农业灌溉、农业播耕等碳排放总和。计算方法参考李波[37]、候孟阳[7]、王宝义[34]等 |
表2 主要年份安徽省县域农业效率等级数量Tab.2 Number of county agricultural efficiency grades in major years in Anhui Province |
| 效率等级 | 2000 | 2002 | 2004 | 2006 | 2008 | 2010 | 2012 | 2014 | 2016 | 2017 |
|---|---|---|---|---|---|---|---|---|---|---|
| 效率优秀 | 14 | 14 | 26 | 32 | 26 | 31 | 27 | 21 | 24 | 26 |
| 效率良好 | 0 | 0 | 0 | 1 | 0 | 0 | 1 | 3 | 1 | 0 |
| 效率中等 | 4 | 4 | 8 | 18 | 12 | 13 | 19 | 14 | 13 | 9 |
| 效率较低 | 30 | 37 | 26 | 20 | 31 | 28 | 25 | 31 | 27 | 29 |
| 效率无效 | 29 | 22 | 17 | 6 | 8 | 5 | 5 | 8 | 12 | 13 |
表3 安徽省农业效率的方向分布Tab.3 Directional distribution of agricultural efficiency in Anhui Province |
| 年份 | centerX | centerY | XStdDist | YStdDist | Rotation | Oblateness |
|---|---|---|---|---|---|---|
| 2000 | 117.3962 | 31.6993 | 1.88448 | 1.24095 | 147.617 | 1.518579 |
| 2005 | 117.4404 | 31.7131 | 1.93189 | 1.24476 | 153.271 | 1.552018 |
| 2010 | 117.3698 | 31.689 | 1.92623 | 1.19382 | 152.267 | 1.613501 |
| 2015 | 117.4274 | 31.6378 | 1.92204 | 1.17378 | 151.492 | 1.637479 |
| 2017 | 117.4085 | 31.6268 | 1.91581 | 1.18418 | 151.732 | 1.617837 |
表4 安徽省农业效率的Moran's I 指数分布(2000、2005、2010、2015、2017)Tab.4 The Moran's I index of agricultural efficiency in Anhui Province(2000, 2005, 2010, 2015, 2017) |
| 年份 | I | EI | mean | sd | Z-value | P-value |
|---|---|---|---|---|---|---|
| 2000 | 0.1580 | -0.0132 | -0.0093 | 0.0708 | 2.3626 | 0.014 |
| 2005 | 0.1689 | -0.0132 | -0.0144 | 0.0756 | 2.4229 | 0.010 |
| 2010 | 0.1075 | -0.0132 | -0.0088 | 0.0753 | 1.5437 | 0.068 |
| 2015 | 0.1609 | -0.0132 | -0.0095 | 0.0775 | 2.1977 | 0.020 |
| 2017 | 0.1711 | -0.0132 | -0.0178 | 0.0735 | 2.5699 | 0.006 |
| [1] |
汪艳涛, 王记志. 区域农业资源利用效率的时空比较研究——以湖南省14个地(市、州)城区为例[J]. 江西农业大学学报:社会科学版, 2009, 8(4):62-66.
|
| [2] |
|
| [3] |
|
| [4] |
|
| [5] |
|
| [6] |
|
| [7] |
候孟阳, 姚顺波. 1978—2016年中国农业生态效率时空演变及趋势预测[J]. 地理学报, 2018, 73(11):2168-2183.
|
| [8] |
熊鹰, 许钰莎. 四川省环境友好型农业生产效率测算及影响因素研究——基于超效率DEA模型和空间面板STIRPAT模型[J]. 中国生态农业学报(中英文), 2019, 27(7):1134-1146.
|
| [9] |
田云. 中国低碳农业发展:生产效率、空间差异与影响因素研究[D]. 武汉: 华中农业大学, 2015.
|
| [10] |
吴贤荣, 张俊飚, 田云, 等. 中国省域农业碳排放:测算、效率变动及影响因素研究——基于DEA-Malmquist指数分解方法与Tobit模型运用[J]. 资源科学, 2014, 36(1):129-138.
|
| [11] |
庞家幸. 中国农业生态效率研究[D]. 兰州: 兰州大学, 2016.
|
| [12] |
李博, 张文忠, 余建辉. 碳排放约束下的中国农业生产效率地区差异分解与影响因素[J]. 经济地理, 2016, 36(9):150-157.
|
| [13] |
叶文忠, 刘俞希. 长江经济带农业生产效率及其影响因素研究[J]. 华东经济管理, 2018, 32(3):83-88.
|
| [14] |
邢慧茹, 张晓骏, 邓义. 农业生产效率与其影响因素相关关系实证分析——基于湖北省数据[J]. 中国农业资源与区划, 2016, 37(12):198-203.
|
| [15] |
张玲玲, 丁雪丽, 沈莹, 等. 中国农业用水效率空间异质性及其影响因素分析[J]. 长江流域资源与环境, 2019, 28(4):817-826.
|
| [16] |
冯亚娟, 祁乔, 韩家彬. 中国农业生态效率的时空演变及驱动因素[J]. 水土保持通报, 2018, 38(6):254-232.
|
| [17] |
何鸿辉. 基于阶段DEA模型的甘肃农业生产效率研究[D]. 兰州: 兰州大学, 2018.
|
| [18] |
王云, 周忠学. 多功能性的都市农业用地效率评价——以西安市为例[J]. 经济地理, 2014, 34(7):129-134.
|
| [19] |
夏四友, 文琦, 赵媛, 等. 榆林市农业现代化发展水平与效率的时空演变[J]. 经济地理, 2017, 37(10):173-180.
|
| [20] |
匡远凤. 技术效率、技术进步、要素积累与中国农业经济增长——基于SFA的经验分析[J]. 数量经济技术经济研究, 2012, 29(1):3-18.
|
| [21] |
邓敏慧, 杨传喜. 基于超效率DEA模型的中国农业科技资源配置效率动态演化研究[J]. 中国农业资源与区划, 2017, 38(11):61-66.
|
| [22] |
马凤才, 郭喜伟, 陈璐. 基于三阶段DEA模型的辽宁省农业生产效率分析[J]. 农业经济, 2019(4):15-17.
|
| [23] |
吴振华, 雷琳. 基于三阶段DEA模型的农业土地生态效率研究[J]. 生态经济, 2018, 34(10):76-80.
|
| [24] |
潘丹, 应瑞瑶. 中国农业生态效率评价方法与实证——基于非期望产出的SBM模型分析[J]. 生态学报, 2013, 33(12):3837-3845.
|
| [25] |
方琳, 吴凤平, 王新华, 等. 基于共同前沿SBM模型的农业用水效率测度及改善潜力[J]. 长江流域资源与环境, 2018, 27(10):2293-2304.
|
| [26] |
张子龙, 鹿晨昱, 陈兴鹏, 等. 陇东黄土高原农业生态效率的时空演变分析[J]. 地理科学, 2014, 34(4):472-478.
|
| [27] |
狄乾斌, 孟雪. 基于非期望产出的城市发展效率时空差异探讨——以中国东部沿海地区城市为例[J]. 地理科学, 2017, 37(6):807-815.
|
| [28] |
|
| [29] |
李姣, 周翠烟, 张灿明, 等. 基于生态足迹的湖南省洞庭湖生态经济区全要素生态效率研究[J]. 经济地理, 2019, 39(2):199-206.
|
| [30] |
李晨, 冯伟, 邵桂兰. 中国省域渔业全要素碳排放效率时空分异[J]. 经济地理, 2018, 38(5):179-187.
|
| [31] |
|
| [32] |
冉泽泽. 基于ESDA的经济空间差异实证研究——以丝绸之路经济带中国西北段核心节点城市为例[J]. 经济地理, 2017, 37(5):28-34,73.
|
| [33] |
邹琳, 曾刚, 曹贤忠. 基于ESDA的长三角城市群研发投入空间分异特征及时空演化[J]. 经济地理, 2015, 35(3):73-79.
|
| [34] |
王宝义, 张卫国. 中国农业生态效率测度及时空差异研究[J]. 中国人口·资源与环境, 2016, 26(6):11-19.
|
| [35] |
郑德凤, 郝帅, 孙才志. 基于DEA-ESDA的农业生态效率评价及时空分异研究[J]. 地理科学, 2018(3):419-417.
|
| [36] |
张俊容, 郭耀煌. 评价指标与DEA有效的关系[J]. 系统工程理论方法应用, 2004, 13(6):520-523.
|
| [37] |
李波, 张俊飚, 李海鹏, 等. 中国农业碳排放时空特征及影响因素分解[J]. 中国人口·资源与环境, 2011, 21(8):80-86.
|
| [38] |
秦菲, 舒晓波, 肖素芳, 等. 基于DEA的江西农业生产效率时空特征研究[J]. 江西科学, 2014, 32(5):746-750.
|
| [39] |
张安康. 黑龙江农业生产效率评价研究[D]. 哈尔滨: 哈尔滨理工大学, 2019.
|
| [40] |
田伟, 杨璐嘉, 姜静. 低碳视角下中国农业环境效率的测算与分析——基于非期望产出的SBM模型[J]. 中国农村观察, 2014(5):59-70.
|
/
| 〈 |
|
〉 |
