
The Spatial Pattern of China's Financial Industry Agglomeration and Its Influencing Factors:A Study Based on the Geographical Detector Model
Received date: 2019-08-05
Revised date: 2019-10-09
Online published: 2025-04-08
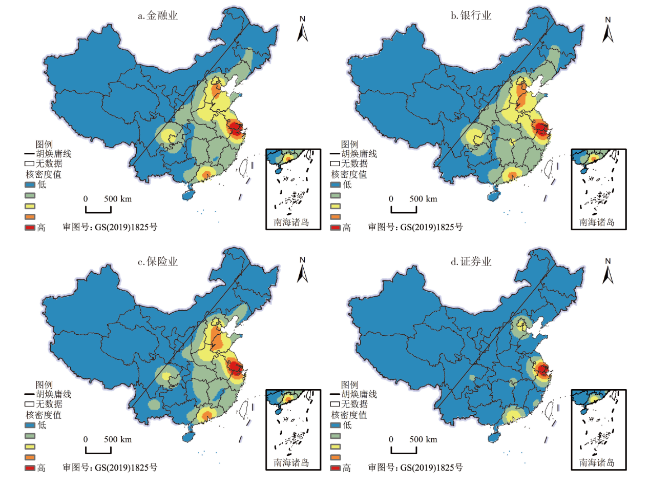
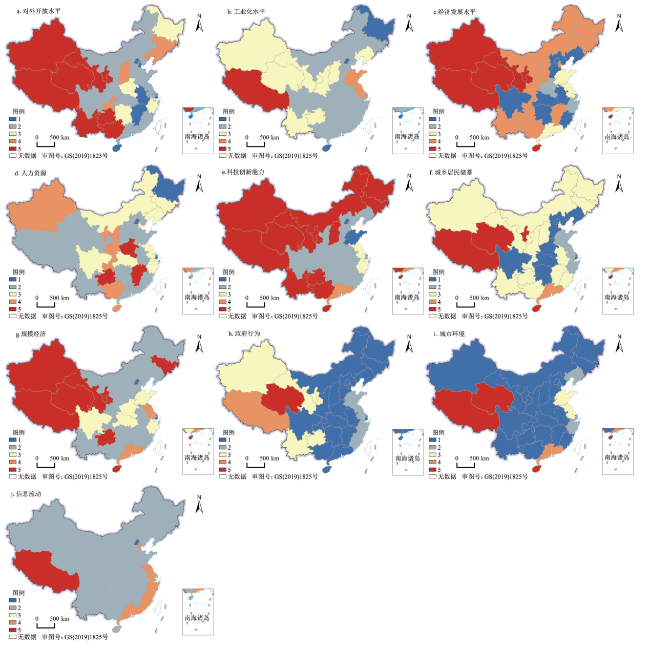
Studying the spatial pattern of financial industry agglomeration and its influencing factors are of great significance for optimizing the spatial allocation of financial resources and accelerating the financial industry agglomeration. Based on the POI data extracted from Gaode map,a total of 250 522 points of interest. The nuclear density method was used to study the spatial pattern of China's financial industry and banking,insurance,and securities industries,and by using geo-detector model,the factors affecting the agglomeration of financial industry were analyzed. The results show that: 1) The agglomeration of banking,insurance and securities industries in China shows obvious spatial differences,forming a spatial pattern that is higher in the eastern coast than in the central and western regions; 2) The most prominent areas of financial industry agglomeration are mainly concentrated in the Yangtze River Delta,Beijing-Tianjin-Hebei and Pearl River Delta urban agglomerations. Beijing and Shanghai are always in high-gathering areas,and the financial agglomeration level in the vast western regions is relatively low; 3) The main factors affecting the financial industry agglomeration in the eastern,central and western regions are different. With the improvement of economic development level,the influence of human resources,information flow,economies of scale and government has become increasingly prominent; 4) There is no weakening and independent relationship between the two factors,including non-linear enhancement and two-factor enhancement. In 2010,the interaction between the level of opening up and other factors has a significant effect on the strengthening of financial industry agglomeration; in 2016,the interaction of impact factors is relatively balanced,and the interaction between human resources and other factors has a significant effect on the agglomeration of financial industry.
WANG Yanhua , ZHAO Jianji , LIU Yana , FENG Hailong , MIAO Changhong . The Spatial Pattern of China's Financial Industry Agglomeration and Its Influencing Factors:A Study Based on the Geographical Detector Model[J]. Economic geography, 2020 , 40(4) : 125 -133 . DOI: 10.15957/j.cnki.jjdl.2020.04.015
表1 交互探测的表达式Tab.1 Expression of interactive detection |
| 表达式 | 作用结果 |
|---|---|
| 非线性减弱 | |
| 单因子非线性减弱 | |
| 两因子相互独立 | |
| 双因子增强 | |
| 非线性增强 |
表2 金融产业集聚影响因素指标Tab.2 Indicators of factors affecting financial industry agglomeration |
| 影响因素 | 序号 | 具体指标 |
|---|---|---|
| 对外开放水平 | X1 | 外商直接投资额占GDP的比值 |
| 工业化水平 | X2 | 工业总产值占GDP 比值 |
| 经济发展水平 | X3 | GDP占全国的比重 |
| 人力资源 | X4 | 人均受教育年限 |
| 科技创新能力 | X5 | 三种专利的授权量占全国的比重 |
| 城乡居民储蓄 | X6 | 城乡居民储蓄与全国城乡居民储蓄比值 |
| 规模经济 | X7 | 金融业的增加值占全国的比重 |
| 政府行为 | X8 | 政府财政支出占GDP的比重 |
| 城市环境 | X9 | 城市绿地面积占的比重 |
| 信息流动 | X10 | 计算机普及率 |
表3 金融产业各类型POI个数Tab.3 Number of POI of various types in financial industry |
| 区域 | 银行业 | 保险业 | 证券业 | 总计 |
|---|---|---|---|---|
| 东部 | 88 873 | 19 588 | 4 322 | 112 783 |
| 中部 | 58 256 | 11 059 | 1 428 | 70 743 |
| 西部 | 55 420 | 10 447 | 1 129 | 66 996 |
| 总计 | 202 549 | 41 094 | 6 879 | 250 522 |
表4 中国金融产业集聚因子的地理探测结果Tab.4 Geographical detection results of China's financial industry agglomeration factors |
| 年份 | 区域 | X1 | X2 | X3 | X4 | X5 | X6 | X7 | X8 | X9 | X10 |
|---|---|---|---|---|---|---|---|---|---|---|---|
| 2010 | 全国 | 0.053 | 0.135 | 0.071 | 0.390 | 0.202 | 0.243 | 0.146 | 0.081 | 0.190 | 0.408 |
| 东部 | 0.074 | 0.381 | 0.288 | 0.562 | 0.389 | 0.740 | 0.275 | 0.043 | 0.424 | 0.679 | |
| 中部 | 0.179 | 0.527 | 0.339 | 0.293 | 0.044 | 0.438 | 0.045 | 0.242 | 0.334 | 0.196 | |
| 西部 | 0.099 | 0.077 | 0.013 | 0.308 | 0.153 | 0.441 | 0.006 | 0.227 | 0.012 | 0.353 | |
| 2016 | 全国 | 0.237 | 0.220 | 0.185 | 0.433 | 0.156 | 0.164 | 0.418 | 0.111 | 0.184 | 0.329 |
| 东部 | 0.564 | 0.432 | 0.474 | 0.511 | 0.343 | 0.587 | 0.693 | 0.610 | 0.427 | 0.536 | |
| 中部 | 0.422 | 0.647 | 0.497 | 0.984 | 0.721 | 0.323 | 0.525 | 0.564 | 0.319 | 0.584 | |
| 西部 | 0.341 | 0.515 | 0.311 | 0.809 | 0.348 | 0.347 | 0.248 | 0.407 | 0.616 | 0.995 |
表5 金融产业集聚影响因子交互探测结果(2010年)Tab.5 Interactive detection results of impact factors of financial industry agglomeration in 2010 |
| 影响因子 | X1 | X2 | X3 | X4 | X5 | X6 | X7 | X8 | X9 | X10 |
|---|---|---|---|---|---|---|---|---|---|---|
| X1 | 0.053 | |||||||||
| X2 | 0.612↖ | 0.135 | ||||||||
| X3 | 0.648↖ | 0.535↖ | 0.071 | |||||||
| X4 | 0.772↖ | 0.603↖ | 0.446↗ | 0.390 | ||||||
| X5 | 0.625↖ | 0.362↗ | 0.339↖ | 0.464↗ | 0.202 | |||||
| X6 | 0.789↖ | 0.533↖ | 0.368↗ | 0.587↗ | 0.347↗ | 0.243 | ||||
| X7 | 0.305↖ | 0.526↖ | 0.391↖ | 0.424↗ | 0.392↗ | 0.419↗ | 0.146 | |||
| X8 | 0.293↖ | 0.565↖ | 0.405↖ | 0.567↖ | 0.345↖ | 0.565↖ | 0.426↖ | 0.081 | ||
| X9 | 0.591↖ | 0.261↗ | 0.368↖ | 0.531↗ | 0.303↗ | 0.388↗ | 0.466↖ | 0.495↖ | 0.190 | |
| X10 | 0.799↖ | 0.609↖ | 0.567↖ | 0.587↗ | 0.505↗ | 0.564↗ | 0.511↗ | 0.548↖ | 0.591↗ | 0.408 |
表6 金融产业集聚影响因子交互探测结果(2016年)Tab.6 Interactive detection results of impact factors of financial industry agglomeration in 2016 |
| 影响因子 | X1 | X2 | X3 | X4 | X5 | X6 | X7 | X8 | X9 | X10 |
|---|---|---|---|---|---|---|---|---|---|---|
| X1 | 0.237 | |||||||||
| X2 | 0.496↗ | 0.220 | ||||||||
| X3 | 0.489↖ | 0.618↖ | 0.185 | |||||||
| X4 | 0.675↗ | 0.575↗ | 0.627↗ | 0.433 | ||||||
| X5 | 0.470↖ | 0.529↖ | 0.414↖ | 0.586↗ | 0.156 | |||||
| X6 | 0.567↖ | 0.623↖ | 0.343↗ | 0.698↖ | 0.330↗ | 0.164 | ||||
| X7 | 0.535↗ | 0.576↗ | 0.470↗ | 0.658↗ | 0.490↗ | 0.565↗ | 0.418 | |||
| X8 | 0.300↗ | 0.502↖ | 0.454↖ | 0.550↗ | 0.373↖ | 0.408↖ | 0.608↖ | 0.111 | ||
| X9 | 0.363↗ | 0.492↖ | 0.310↗ | 0.577↗ | 0.442↖ | 0.354↗ | 0.502↗ | 0.311↗ | 0.184 | |
| X10 | 0.573↗ | 0.441↗ | 0.648↖ | 0.564↗ | 0.404↗ | 0.470↗ | 0.496↗ | 0.391↗ | 0.483↗ | 0.329 |
注:符号分别表示:↘非线性减弱关系;↙单因子非线性减弱关系;↖非线性增强关系;↗双因子增强关系;←独立关系。 |
| [1] |
|
| [2] |
赵建吉, 王艳华, 吕可文, 等. 内陆区域中心城市金融产业集聚的演化机理——以郑东新区为例[J]. 地理学报, 2017, 72(8):1392-1407.
|
| [3] |
李小建. 金融地理学理论视角及中国金融地理研究[J]. 经济地理, 2006, 26(5):721-725.
|
| [4] |
王晓阳, 蒙克. 西方金融地理学的兴起、发展和学科地位的建立[J]. 经济地理, 2019, 39(3):12-19.
|
| [5] |
李振发, 徐梦冉, 贺灿飞, 等. 金融地理学研究综述与展望[J]. 经济地理, 2018, 38(7):7-15.
|
| [6] |
潘峰华, 徐晓红, 夏亚博, 等. 境外金融地理学研究进展及启示[J]. 地理科学进展, 2014, 33(9):1231-1240.
|
| [7] |
林初昇, 王洋. 金融化:经济地理学研究的新课题?[J]. 热带地理, 2017, 37(5): 629-631.
|
| [8] |
武巍, 刘卫东, 刘毅. 西方金融地理学研究进展及其启示[J]. 地理科学进展, 2005(4):19-27.
|
| [9] |
|
| [10] |
|
| [11] |
贺灿飞, 傅蓉. 外资银行在中国的区位选择[J]. 地理学报, 2009, 64(6):701-712.
|
| [12] |
贺灿飞, 刘浩. 银行业改革与国有商业银行网点空间布局——以中国工商银行和中国银行为例[J]. 地理研究, 2013, 32(1):111-122.
|
| [13] |
刘辉, 申玉铭, 柳坤. 中国城市群金融服务业发展水平及空间格局[J]. 地理学报, 2013, 68(2):186-198.
|
| [14] |
季菲菲, 陈雯. 长三角地区金融机构网络分布格局与扩张机理——以城市商业银行为例[J]. 地理科学进展, 2014, 33(9):1241-1251.
|
| [15] |
林彰平, 闫小培. 转型期广州市金融服务业的空间格局变动[J]. 地理学报, 2006, 61(8):818-828.
|
| [16] |
刘辉, 申玉铭, 邓秀丽. 北京金融服务业空间格局及模式研究[J]. 人文地理, 2013, 28(5):61-68.
|
| [17] |
茹乐峰, 苗长虹, 王海江. 我国中心城市金融集聚水平与空间格局研究[J]. 经济地理, 2014, 34(2):58-66.
|
| [18] |
李小建, 周雄飞, 卫春江, 等. 发展中地区银行业空间系统变化——以河南省为例[J]. 地理学报, 2006, 61(4):414-424.
|
| [19] |
|
| [20] |
|
| [21] |
|
| [22] |
|
| [23] |
|
| [24] |
潘峰华, 夏亚博, 徐晓红. 中国企业赴新加坡上市格局的演变[J]. 世界地理研究, 2014, 23(1):140-150.
|
| [25] |
徐宜青, 潘峰华, 江小雨, 等. 北京市风险投资的空间分布与合作网络研究[J]. 地理科学进展, 2016, 35(3):358-367.
|
| [26] |
方嘉雯, 刘海猛. 京津冀城市群创业风险投资的时空分布特征及影响机制[J]. 地理科学进展, 2017, 36(1):68-77.
|
| [27] |
黄解宇, 杨再斌. 金融集聚论——金融中心形成的理论与实践解析[M]. 北京: 中国社会科学出版社, 2006.
|
| [28] |
尹来盛, 冯邦彦. 金融集聚研究进展与展望[J]. 人文地理, 2012, 27(1):16-21.
|
| [29] |
|
| [30] |
|
| [31] |
司月芳, 曾刚, 樊鸿伟. 上海陆家嘴金融集聚动因的实证研究[J]. 人文地理, 2008, 23(6):84-88.
|
| [32] |
李佳洺, 张文忠, 李业锦, 等. 基于微观企业数据的产业空间集聚特征分析——以杭州市区为例[J]. 地理研究, 2016, 35(1):95-107.
|
| [33] |
陈红霞. 北京市生产性服务业空间分布与集聚特征的演变[J]. 经济地理, 2018, 38(5):108-116.
|
| [34] |
杨振山, 龙瀛,
|
| [35] |
甄峰, 王波. “大数据”热潮下人文地理学研究的再思考[J]. 地理研究, 2015, 34(5):803-811.
|
| [36] |
王劲峰, 徐成东. 地理探测器:原理与展望[J]. 地理学报, 2017, 72(1):116-134.
|
| [37] |
刘彦随, 杨忍. 中国县域城镇化的空间特征与形成机理[J]. 地理学报, 2012, 67(8):1011-1020.
|
| [38] |
李佳洺, 陆大道, 徐成东, 等. 胡焕庸线两侧人口的空间分异性及其变化[J]. 地理学报, 2017, 72(1):148-160.
|
| [39] |
禹文豪, 艾廷华, 杨敏, 等. 利用核密度与空间自相关进行城市设施兴趣点分布热点探测[J]. 武汉大学学报:信息科学版, 2016, 41(2):221-227.
|
| [40] |
柳林, 刘文娟, 廖薇薇, 等. 基于随机森林和时空核密度方法的不同周期犯罪热点预测对比[J]. 地理科学进展, 2018, 37(6):761-771.
|
| [41] |
|
| [42] |
任英华, 徐玲, 游万海. 金融集聚影响因素空间计量模型及其应用[J]. 数量经济技术经济研究, 2010, 27(5):104-115.
|
| [43] |
张清正. 异质性视角下中国金融业集聚及影响因素研究[J]. 经济问题探索, 2015(6):162-169.
|
| [44] |
张志元, 季伟杰. 中国省域金融产业集聚影响因素的空间计量分析[J]. 广东金融学院学报, 2009, 24(1):107-117.
|
| [45] |
李大垒. 城市金融产业集聚形成原因的实证研究——基于我国35个大中城市的面板数据[J]. 上海经济研究, 2010(8):41-47.
|
| [46] |
刘同山. 区域金融发展影响因素的空间面板计量分析[J]. 金融与经济, 2011(7):33-35.
|
| [47] |
李静, 朱显平, 白江. 我国地区金融集聚驱动因素的实证分析[J]. 东北师大学报:哲学社会科学版, 2014(5):107-112.
|
/
| 〈 |
|
〉 |