
High-Quality Development Assessment and Spatial Heterogeneity of Urban Agglomeration in the Yellow River Basin
Received date: 2019-12-05
Revised date: 2020-04-04
Online published: 2025-04-08
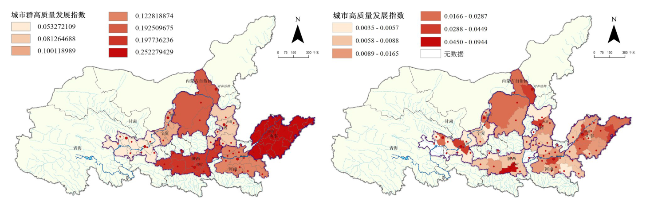
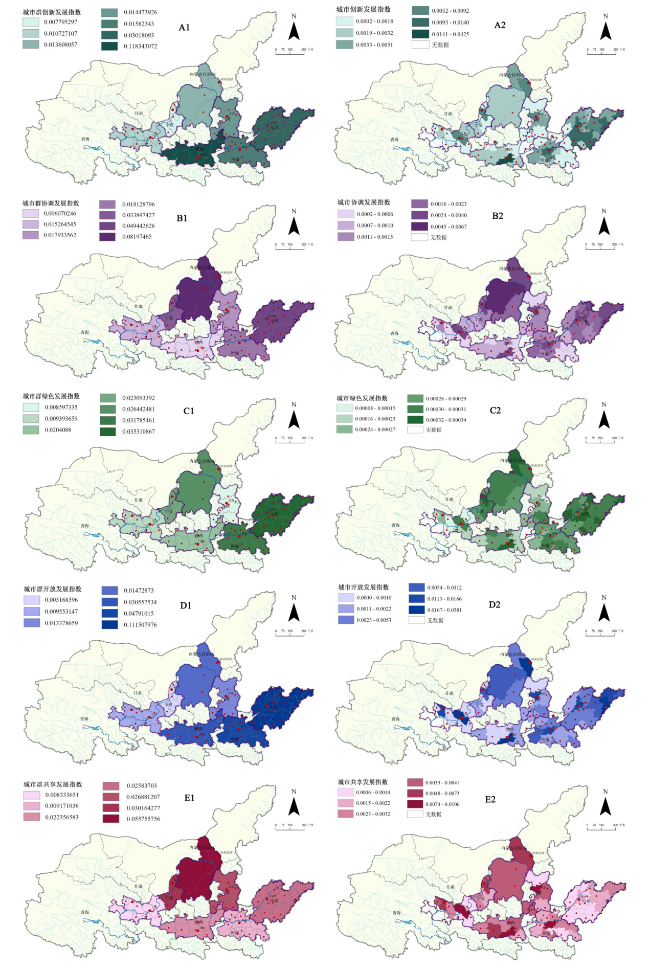
Urban agglomeration is the main carrier of the high-quality development of the Yellow River basin. The high-quality development of the Yellow River basin depends on the development quality of urban agglomeration and its driving effect. By building the evaluation index system of high-quality development of urban agglomerations,the study assessed the development quality of the 7 urban agglomerations and internal cities in Yellow River basin in 2016 from five dimensions as innovation,coordination,green,open and sharing,the study found that: 1) There are significant spatial differences in the development quality level of urban agglomerations in the Yellow River basin,the high-quality development indexes of the middle and lower reaches of urban agglomerations are higher than that of the middle and upper reaches; 2) The spatial pattern of high-quality development of urban agglomerations in the Yellow River basin is shown as "central collapse",the development indexes of Zhongyuan urban agglomeration and Jinzhong urban agglomeration in the central region are lower than the urban agglomerations of east and west in many dimensions; 3) The high-quality development level of the inner cities presents an obvious pattern of "central-peripheral",the high-quality development level of the core cities is significantly higher than that of the peripheral cities; 4) The city with higher grade and the better location often has higher development quality level,which is not significantly affected by the location of the Yellow River. According to the study,the urban agglomerations in the Yellow River basin should strengthen the radiative driving effect of core cities on the whole urban agglomeration,and drive the high-quality development of the whole Yellow River basin through the high-quality development of urban agglomerations.
MA Haitao , XU Xuanfang . High-Quality Development Assessment and Spatial Heterogeneity of Urban Agglomeration in the Yellow River Basin[J]. Economic geography, 2020 , 40(4) : 11 -18 . DOI: 10.15957/j.cnki.jjdl.2020.04.002
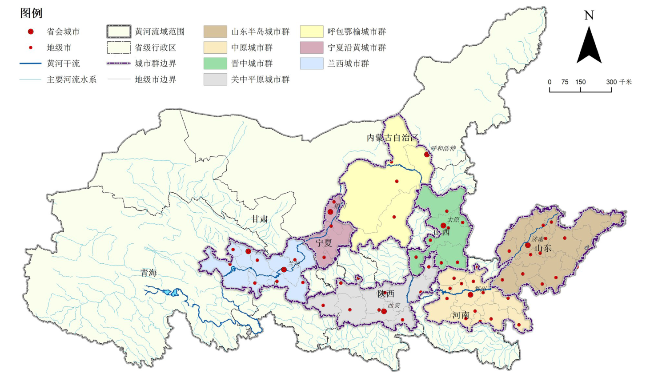
表1 黄河流域7个城市群的基本概况Tab.1 The basic indexes of seven urban agglomerations in the Yellow River basin |
| 城市群名称 | 城市构成 | 国土面积占比/% | 人口总量占比/% | 经济总量占比/% |
|---|---|---|---|---|
| 山东半岛城市群 | 以济南和青岛为双核心,包括烟台、威海、东营、淄博、潍坊、日照、莱芜、菏泽、枣庄、德州、滨州、临沂、济宁、聊城、泰安 | 18.49 | 33.18 | 46.33 |
| 中原城市群 | 以郑州为核心,包括洛阳、开封、新乡、焦作、许昌、平顶山、漯河、济源、鹤壁、商丘、周口、晋城、亳州等城市 | 11.90 | 28.61 | 20.93 |
| 关中平原城市群 | 以西安为核心,包括宝鸡、铜川、渭南、咸阳、杨凌、商洛、运城、临汾、天水、平凉、庆阳等城市 | 18.88 | 17.37 | 11.72 |
| 晋中城市群 | 以太原市为核心,包括阳泉、晋中、忻州、长治、吕梁等城市 | 10.43 | 8.40 | 5.73 |
| 呼包鄂榆城市群 | 以呼和浩特市为核心,包括内蒙古自治区的包头市、鄂尔多斯市和陕西省榆林市 | 20.46 | 4.53 | 9.81 |
| 宁夏沿黄城市群 | 以银川为核心,包括石嘴山、吴忠、中卫等城市 | 6.09 | 2.21 | 2.01 |
| 兰西城市群 | 以兰州和西宁为双核心,包括甘肃省定西市、白银市、临夏州和青海省海东市、海北藏族自治州等城市 | 13.75 | 5.71 | 3.47 |
注:1.表中占比是单个城市群指标占所有城市群汇总指标的比重。2.资料来源于《国家新型城镇化规划(2014—2020年)》出台后,国务院最新批复的各城市群发展规划文本;数据由2016年各市统计数据汇总得到,来自2017年《中国城市统计年鉴》。 |
表2 城市群高质量发展评价指标体系及权重Tab.2 Evaluation index system and weight of high-quality development of urban agglomerations |
| 目标层 | 准则层 | 指标层 | 指标属性 | 指标单位 | 城市群尺度权重 | 城市尺度权重 |
|---|---|---|---|---|---|---|
| U 城 市 群 高 质 量 发 展 指 数 | U1创新发展 | U11全社会研发投入占GDP比重 | 正向 | % | 0.1167 | 0.1001 |
| U12万人专利授权量 | 正向 | 个 | 0.0359 | 0.0587 | ||
| U13万人专利申请受理量 | 正向 | 个 | 0.0274 | 0.0528 | ||
| U14万人高等学校在校学生数 | 正向 | 人 | 0.0309 | 0.0867 | ||
| U2协调发展 | U21城乡收入比* | 正向 | - | 0.0435 | 0.0176 | |
| U22人口城镇化水平 | 正向 | % | 0.0255 | 0.0172 | ||
| U23非农业产值占比 | 正向 | % | 0.0272 | 0.0061 | ||
| U24人均GDP | 正向 | 万元/人 | 0.0711 | 0.0298 | ||
| U25人均财政总收入 | 正向 | 万元/人 | 0.0554 | 0.0430 | ||
| U3绿色发展 | U31城镇生活污水处理率 | 正向 | % | 0.0161 | 0.0040 | |
| U32垃圾无害化处理率 | 正向 | % | 0.0360 | 0.0064 | ||
| U33工业固体废物综合利用率 | 正向 | % | 0.0164 | 0.0041 | ||
| U34万元工业总产值废水排放量 | 负向 | t | 0.0173 | 0.0022 | ||
| U35万元工业总产值SO2排放量 | 负向 | t | 0.0217 | 0.0029 | ||
| U36万元工业总产值烟尘排放量 | 负向 | t | 0.0312 | 0.0031 | ||
| U37建成区绿化覆盖率 | 正向 | % | 0.0183 | 0.0058 | ||
| U4开放发展 | U41实际利用外资占GDP比重 | 正向 | % | 0.0346 | 0.0477 | |
| U42进出口总额占GDP比重 | 正向 | % | 0.1007 | 0.0716 | ||
| U43航空客运量占总人口比重 | 正向 | % | 0.0272 | 0.1589 | ||
| U44百人拥有国际互联网用户数 | 正向 | 户/百人 | 0.0684 | 0.0532 | ||
| U5共享发展 | U51每万人拥有医生数 | 正向 | 人 | 0.0499 | 0.0149 | |
| U52人均全社会固定资产投资额 | 正向 | 万元 | 0.0539 | 0.0205 | ||
| U53铁路客运量占总人口比重 | 正向 | % | 0.0224 | 0.1152 | ||
| U54公路客运量占总人口比重 | 正向 | % | 0.0309 | 0.0486 | ||
| U55人均城乡居民储蓄年末余额 | 正向 | 万元 | 0.0215 | 0.0291 |
注:“*”城乡收入比=乡村人口人均可支配收入/城镇人口人均可支配收入。 |
表3 黄河流域城市群高质量发展评价总排名Tab.3 The overall ranking of the high-quality development of urban agglomerations in the Yellow River basin |
| 黄河 流域 | 城市群名称 | 高质量发展指数 | 创新发展指数 | 协调发展指数 | 绿色发展指数 | 开放发展指数 | 共享发展指数 | |||||||||||
|---|---|---|---|---|---|---|---|---|---|---|---|---|---|---|---|---|---|---|
| 得分 | 排名 | 得分 | 排名 | 得分 | 排名 | 得分 | 排名 | 得分 | 排名 | 得分 | 排名 | |||||||
| 下游 | 山东半岛城市群 | 0.2523 | 1 | 0.0302 | 2 | 0.0494 | 2 | 0.0353 | 1 | 0.1115 | 1 | 0.0258 | 4 | |||||
| 中原城市群 | 0.1228 | 4 | 0.0158 | 3 | 0.0181 | 4 | 0.0318 | 2 | 0.0479 | 2 | 0.0092 | 6 | ||||||
| 中游 | 关中平原城市群 | 0.1977 | 2 | 0.1183 | 1 | 0.0061 | 7 | 0.0204 | 5 | 0.0306 | 3 | 0.0224 | 5 | |||||
| 晋中城市群 | 0.0813 | 6 | 0.0145 | 4 | 0.0179 | 5 | 0.0086 | 7 | 0.0134 | 5 | 0.0269 | 3 | ||||||
| 上游 | 呼包鄂榆城市群 | 0.1925 | 3 | 0.0136 | 5 | 0.0820 | 1 | 0.0264 | 3 | 0.0147 | 4 | 0.0558 | 1 | |||||
| 宁夏沿黄城市群 | 0.0533 | 5 | 0.0107 | 7 | 0.0153 | 3 | 0.0094 | 4 | 0.0096 | 7 | 0.0083 | 2 | ||||||
| 兰西城市群 | 0.1001 | 7 | 0.0078 | 6 | 0.0339 | 6 | 0.0251 | 6 | 0.0032 | 6 | 0.0302 | 7 | ||||||
注:黄河的上、中、下游采用黄河水利委员会的划分方案,两个分界点为托克托县河口镇和郑州桃花峪,但城市群所属难以清晰划分,考虑到汇流区域范围,这里将中原城市群划为下游,将呼包鄂榆城市群划分到上游。 |
图2 黄河流域城市群及各城市高质量发展指数空间分异示意图Fig.2 Spatial heterogeneity of high-quality development index of urban agglomerations and inner cities in the Yellow River basin |
表4 黄河流域城市群内部城市高质量发展评价前十名排序Tab.4 The top 10 inner cities in the evaluation of high-quality development in the Yellow River basin |
| 名次 | 综合评价指数 | 创新发展指数 | 协调发展指数 | 绿色发展指数 | 开放发展指数 | 共享发展指数 |
|---|---|---|---|---|---|---|
| 1 | 西安 | 西安 | 鄂尔多斯 | 银川 | 西安 | 太原 |
| 2 | 兰州 | 郑州 | 兰州 | 泰安 | 青岛 | 西安 |
| 3 | 青岛 | 济南 | 东营 | 淄博 | 兰州 | 郑州 |
| 4 | 郑州 | 泰安 | 青岛 | 日照 | 呼和浩特 | 兰州 |
| 5 | 呼和浩特 | 济宁 | 包头 | 西安 | 西宁 | 宝鸡 |
| 6 | 太原 | 威海 | 西安 | 威海 | 济南 | 包头 |
| 7 | 济南 | 临沂 | 郑州 | 东营 | 太原 | 西宁 |
| 8 | 威海 | 青岛 | 威海 | 包头 | 郑州 | 银川 |
| 9 | 西宁 | 兰州 | 银川 | 莱芜 | 烟台 | 呼和浩特 |
| 10 | 银川 | 太原 | 呼和浩特 | 聊城 | 银川 | 阳泉 |
| [1] |
|
| [2] |
|
| [3] |
顾朝林. 城市群研究进展与展望[J]. 地理研究, 2011, 30(5):771-784.
|
| [4] |
苗长虹. 中国城市群发育与中原城市群发展研究[M]. 北京: 中国社会科学出版社, 2007.
|
| [5] |
方创琳, 关兴良. 中国城市群投入产出效率的综合测度与空间分异[J]. 地理学报, 2011, 66(8):1011-1022.
|
| [6] |
方创琳, 鲍超, 马海涛. 2016中国城市群发展报告[M]. 北京: 科学出版社, 2016.
|
| [7] |
杨兰桥. 推进我国城市群高质量发展研究[J]. 中州学刊, 2018(7):21-25.
|
| [8] |
崔木花. 城市群发展质量的综合评价[J]. 统计与决策, 2015(4):61-64.
|
| [9] |
李倩倩, 刘怡君, 牛文元. 城市空间形态和城市综合实力相关性研究[J]. 中国人口·资源与环境, 2011, 21(1):13-19.
|
| [10] |
王德利, 方创琳, 杨青山, 等. 基于城市化质量的中国城市化发展速度判定分析[J]. 地理科学, 2010, 30(5):643-650.
|
| [11] |
李明秋, 郎学彬. 城市化质量的内涵及其评价指标体系的构建[J]. 中国软科学, 2011(12):182-186.
|
| [12] |
卢丽文, 张毅, 李小帆, 等. 长江中游城市群发展质量评价研究[J]. 长江流域资源与环境, 2014, 23(10):1337-1343.
|
| [13] |
沈玲媛, 邓宏兵. 武汉城市圈和长株潭城市群城市发展质量比较研究[J]. 地域研究与开发, 2008, 27(6):7-10.
|
| [14] |
李磊, 张贵祥. 京津冀城市群内城市发展质量[J]. 经济地理, 2015, 35(5):61-64,8.
|
| [15] |
王红, 石培基, 魏伟, 等. 城市群间及其内部城市的质量差异分析——以山东半岛、中原、关中城市群为例[J]. 国土与自然资源研究, 2012(6):1-4.
|
| [16] |
杨文, 刘永功. 中国城市发展质量评价[J]. 城市问题, 2015(2):2-7.
|
| [17] |
金凤君, 刘鹤, 许旭. 基于逆向重力模型的城市质量测算及其影响因子分析[J]. 地理科学进展, 2011, 30(4):485-490.
|
| [18] |
韩增林, 刘天宝. 中国地级以上城市城市化质量特征及空间差异[J]. 地理研究, 2009, 28(6):1508-1515.
|
| [19] |
苗长虹. 沿黄三城市群发展机制研究[M]. 北京: 科学出版社, 2012.
|
| [20] |
李文星, 韩君. “五大发展理念”背景下黄河流域的高质量发展测度[J]. 洛阳师范学院学报, 2020, 39(1):1-10.
|
| [21] |
任保平, 文丰安. 新时代中国高质量发展的判断标准、决定因素与实现途径[J]. 改革, 2018(4):5-16.
|
| [22] |
习近平. 深入理解新发展理念[J]. 求是, 2019(10):1-8.
|
| [23] |
|
| [24] |
韩永文. 发挥城市群在经济高质量发展中的引领和辐射作用[J]. 全球化, 2019(5):8-12.
|
| [25] |
樊杰, 王亚飞, 王怡轩. 基于地理单元的区域高质量发展研究——兼论黄河流域同长江流域发展的条件差异及重点[J]. 经济地理, 2020, 40(1):1-11.
|
/
| 〈 |
|
〉 |