
Multi-scale Analysis of Spatial Pattern Characteristic of the Logistics Companies in China
Received date: 2020-09-14
Revised date: 2021-04-25
Online published: 2025-04-08
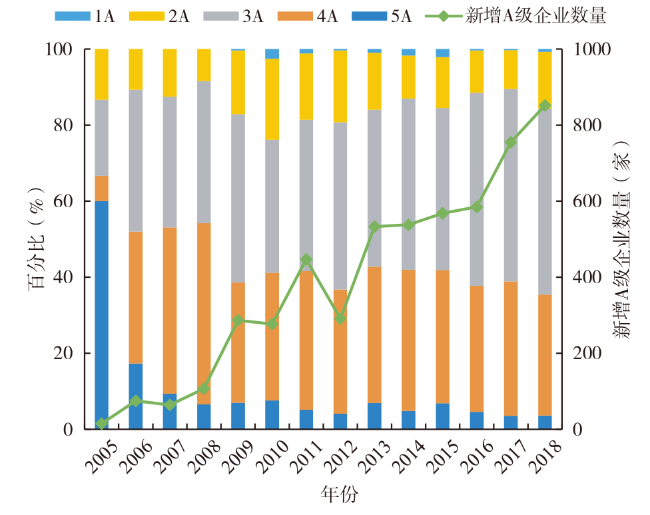
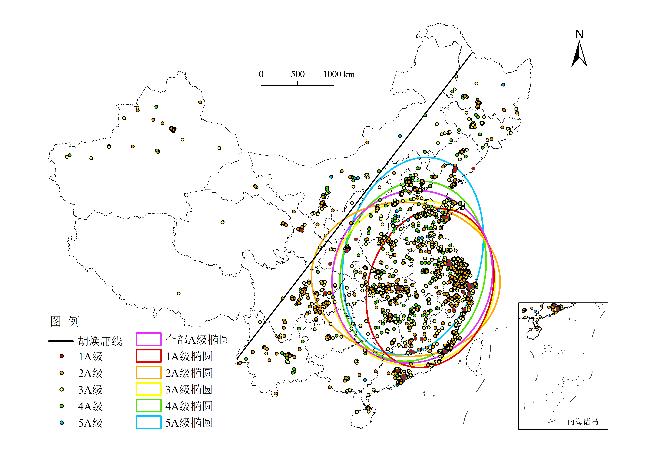
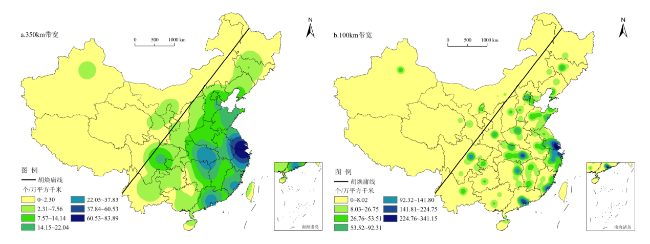
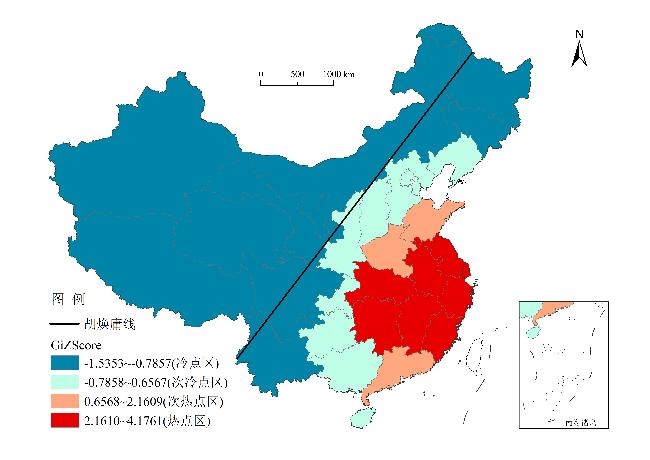
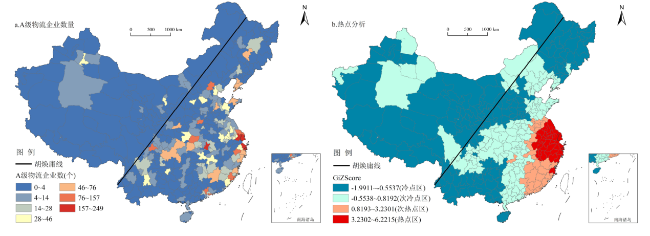
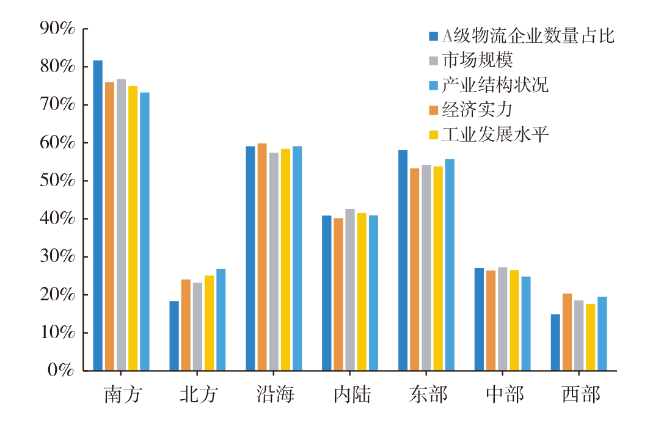
The logistics industry of China has undergone a rapid development since the Reform and Opening Up. A-level logistics companies are leading companies in the logistics industry. The quantity and the quality of A-level logistics companies in a region are significant factors that impact investor's incentives to invest and run businesses there, so local governments usually support and supervise the development of A-level logistics companies. Based on the A-level logistics company data of China from 2005 to 2018,this paper analyzes the spatial distribution and heterogeneity of A-grade logistics companies at different scales by employing the nearest neighbor analysis,the standard deviation ellipse analysis,the kernel density estimation,and exploratory spatial data analysis. At the same time,the geodetector model is used to analyze the development mechanism of the spatial distribution of A-grade logistics companies. The main results show that: 1) The number of A-level logistics companies in China has shown a significant increase,with significant differences in growth rates in different years,and there has been a serious imbalance in the development of logistics companies of different levels,with higher and lower levels accounting for a small proportion,while the proportion of the middle level is relatively large. 2) At the national scale,The spatial distribution of A-grade logistics companies shows the pattern of "South (slightly westward)-North (slightly eastward)". The logistics companies of different levels all show significant agglomeration characteristics,and higher-level logistics companies show more obvious relative concentration and regional. 3) At regional scale,the distribution of logistics companies is generally consistent with the spatial pattern of the level of social- economic development. The three major regions show the "gradient" distribution characteristics,which progressively decreases from the east of China to the west. The level of social- economic development in the coastal region is higher than the inland,and the south is much higher than the north,forming the ratio of "3∶2" and "4∶1" respectively. 4) At provincial scale,the distribution of logistics companies has obvious spatial autocorrelation characteristics,and the "gradient" characteristics of the pattern of cold and hot spots are more obvious. 5) At urban scale,the logistics companies are concentrated in Ⅱ and Ⅰ large cities,accounting for more than half of the total, and hot spots are concentrated in the Yangtze River Delta and its surrounding areas. 6) The distribution of logistics companies is the result of the comprehensive effects of various factors such as economic strength, industrial structure,industrial level and market scale. As the scale increases, the correlation between influencing factors and the spatial distribution of logistics companies tends to increase.
PAN Fangjie , WAN Qing , FENG Bin , SONG Mingjie . Multi-scale Analysis of Spatial Pattern Characteristic of the Logistics Companies in China[J]. Economic geography, 2021 , 41(6) : 97 -106 . DOI: 10.15957/j.cnki.jjdl.2021.06.011
表1 2005—2018年中国A级物流企业评选批次与数量Tab.1 Numbers and batches of A-level logistics company evaluation in China from 2005 to 2018 |
| 评选批次 | 认定数 量(个) | 评选时间 | 评选批次 | 认定数 量(个) | 评选时间 |
|---|---|---|---|---|---|
| 第一批 | 26 | 2005年7月 | 第十四批 | 337 | 2012年7月 |
| 第二批 | 32 | 2006年1月 | 第十五批 | 301 | 2013年1月 |
| 第三批 | 74 | 2006年10月 | 第十六批 | 382 | 2013年8月 |
| 第四批 | 43 | 2007年3月 | 第十七批 | 261 | 2014年2月 |
| 第五批 | 63 | 2007年11月 | 第十八批 | 356 | 2014年8月 |
| 第六批 | 79 | 2008年3月 | 第十九批 | 301 | 2015年2月 |
| 第七批 | 74 | 2008年12月 | 第二十批 | 335 | 2015年8月 |
| 第八批 | 160 | 2009年5月 | 第二十一批 | 232 | 2016年2月 |
| 第九批 | 237 | 2009年12月 | 第二十二批 | 402 | 2016年8月 |
| 第十批 | 166 | 2010年5月 | 第二十三批 | 287 | 2017年1月 |
| 第十一批 | 199 | 2010年11月 | 第二十四批 | 495 | 2017年8月 |
| 第十二批 | 246 | 2011年5月 | 第二十五批 | 358 | 2018年1月 |
| 第十三批 | 316 | 2011年11月 | 第二十六批 | 496 | 2018年8月 |
表2 中国A级物流企业的空间集聚性分析Tab.2 The spatial clustering analysis of A-grade logistics companies in China |
| 企业类型 | NNI | Z score | 置信水平(P值) | 空间分布类型 |
|---|---|---|---|---|
| 1A | 0.31 | -9.62 | 0.00 | 显著聚集 |
| 2A | 0.28 | -37.73 | 0.00 | 显著聚集 |
| 3A | 0.20 | -75.69 | 0.00 | 显著聚集 |
| 4A | 0.21 | -65.22 | 0.00 | 显著聚集 |
| 5A | 0.22 | -25.98 | 0.00 | 显著聚集 |
| 全部 | 0.19 | -114.49 | 0.00 | 显著聚集 |
表3 中国A级物流企业标准差椭圆参数Tab.3 Parameters of standard deviation ellipse of A-grade logistics companies in China |
| 企业等级 | 中心点 经度 | 中心点 维度 | 长半轴长度(km) | 短半轴长 度(km) | 转角 ( °) |
|---|---|---|---|---|---|
| 1A级 | 117.54 | 30.37 | 808.46 | 616.36 | 18.03 |
| 2A级 | 115.00 | 31.34 | 942.43 | 767.67 | 94.73 |
| 3A级 | 115.80 | 31.03 | 835.88 | 808.68 | 33.06 |
| 4A级 | 115.95 | 32.06 | 907.60 | 717.26 | 13.84 |
| 5A级 | 116.16 | 33.45 | 999.98 | 679.59 | 14.50 |
| 全部A级 | 115.77 | 31.56 | 867.51 | 792.26 | 19.10 |
表4 中国A级物流企业地带性分布格局Tab.4 Zonality distribution pattern of A-grade logistics companies in China |
| 区域划分 | 统计指标 | 总数 | 5A级 | 4A级 | 3A级 | 2A级 | 1A级 |
|---|---|---|---|---|---|---|---|
| 东部 | 数量(个) | 3 131 | 200 | 1 058 | 1 442 | 395 | 36 |
| 百分比(%) | 58.05 | 67.11 | 56.58 | 59.59 | 52.32 | 70.59 | |
| 中部 | 数量(个) | 1 460 | 54 | 599 | 591 | 207 | 9 |
| 百分比(%) | 27.07 | 18.12 | 32.03 | 24.42 | 27.42 | 17.65 | |
| 西部 | 数量(个) | 803 | 44 | 213 | 387 | 153 | 6 |
| 百分比(%) | 14.89 | 14.77 | 11.39 | 15.99 | 20.26 | 11.76 | |
| 沿海 | 数量(个) | 3 189 | 204 | 1 083 | 1 466 | 400 | 36 |
| 百分比(%) | 59.12 | 68.46 | 57.91 | 60.58 | 52.98 | 70.59 | |
| 内陆 | 数量(个) | 2 205 | 94 | 787 | 954 | 355 | 15 |
| 百分比(%) | 40.88 | 31.54 | 42.09 | 39.42 | 47.02 | 29.41 | |
| 北方 | 数量(个) | 989 | 99 | 400 | 370 | 111 | 9 |
| 百分比(%) | 18.34 | 33.22 | 21.39 | 15.29 | 14.70 | 17.65 | |
| 南方 | 数量(个) | 4 405 | 199 | 1 470 | 2 050 | 644 | 42 |
| 百分比(%) | 81.66 | 66.78 | 78.61 | 84.71 | 85.30 | 82.35 |
表5 中国A级物流企业的省域密度分布情况Tab.5 The provincial density distribution of A-grade logistics companies in China |
| 省份 | 数量 (个) | 百分比 (%) | 密度(个/ 万km2) | 省份 | 数量 (个) | 百分比 (%) | 密度(个/ 万km2) |
|---|---|---|---|---|---|---|---|
| 浙江 | 741 | 13.74 | 72.20 | 陕西 | 87 | 1.61 | 4.23 |
| 江苏 | 616 | 11.42 | 60.41 | 云南 | 84 | 1.56 | 2.19 |
| 湖北 | 527 | 9.77 | 28.35 | 新疆 | 64 | 1.19 | 0.39 |
| 福建 | 373 | 6.92 | 30.81 | 广西 | 58 | 1.08 | 2.45 |
| 广东 | 369 | 6.84 | 20.94 | 内蒙古 | 54 | 1.00 | 0.47 |
| 山东 | 369 | 6.84 | 23.61 | 宁夏 | 53 | 0.98 | 10.21 |
| 四川 | 259 | 4.80 | 5.33 | 山西 | 51 | 0.95 | 3.25 |
| 上海 | 238 | 4.41 | 299.29 | 重庆 | 51 | 0.95 | 6.19 |
| 湖南 | 236 | 4.38 | 11.14 | 天津 | 42 | 0.78 | 35.94 |
| 江西 | 208 | 3.86 | 12.46 | 贵州 | 41 | 0.76 | 2.33 |
| 河南 | 163 | 3.02 | 9.84 | 甘肃 | 35 | 0.65 | 0.82 |
| 辽宁 | 153 | 2.84 | 10.49 | 黑龙江 | 35 | 0.65 | 0.77 |
| 安徽 | 147 | 2.73 | 10.49 | 海南 | 34 | 0.63 | 10.04 |
| 河北 | 99 | 1.84 | 5.31 | 青海 | 16 | 0.30 | 0.23 |
| 北京 | 97 | 1.80 | 59.12 | 西藏 | 1 | 0.02 | 0.01 |
| 吉林 | 93 | 1.72 | 4.87 | 合计 | 5 394 | 100.00 |
表6 省域和市域尺度影响因素对物流企业分布的解释力Tab.6 The explanatory power of various influencing factors on logistics companies at the provincial and prefecture-level city scale |
| 探测指标 | 指标计算方法 | 省域q值 | 市域q值 |
|---|---|---|---|
| 经济实力(x1) | 地区生产总值(GDP)(亿元) | 0.5594** | 0.5214** |
| 市场规模(x2) | 社会消费品总额(亿元) | 0.6020** | 0.4323* |
| 工业发展水平(x3) | 工业增加值占GDP比重(%) | 0.7301** | 0.5947** |
| 产业结构状况(x4) | 第三产业增加值占GDP比重(%) | 0.6070** | 0.6051** |
| 对外开放程度(x5) | 进出口总额(千美元) | 0.3780* | 0.2358 |
| 交通可达性(x6) | (铁路+公路里程)/区域面积(km/km2) | 0.2025* | 0.4563** |
| 货物运输能力(x7) | 地区货运量(万t) | 0.2640 | 0.3527 |
| 区域政策(x8) | 地方财政支出(亿元) | 0.5138* | 0.4976** |
注:**和*分别表示P值在0.05和0.10水平上显著。 |
| [1] |
王成金. 物流企业的空间网络模式与组织机理[M]. 北京: 科学出版社, 2014.
|
| [2] |
|
| [3] |
|
| [4] |
王成金, 张梦天. 中国物流企业的布局特征与形成机制[J]. 地理科学进展, 2014, 33(1):134-144.
|
| [5] |
王成金. 中国物流企业的空间组织网络[J]. 地理学报, 2008, 63(2):135-146.
|
| [6] |
宗会明, 周素红, 闫小培. 全球化下地方综合服务型物流企业的空间网络组织——以腾邦物流为案例[J]. 地理研究, 2015, 34(5):944-952.
|
| [7] |
曾小永, 千庆兰. 广州市仓储型物流企业空间分布特征及其影响因素分析[J]. 中国市场, 2010, 17(32):6-9.
|
| [8] |
千庆兰, 陈颖彪, 李雁, 等. 广州市物流企业空间布局特征及其影响因素[J]. 地理研究, 2011, 30(7):1254-1261.
|
| [9] |
朱慧, 周根贵. 国际陆港物流企业空间格局演化及其影响因素——以义乌市为例[J]. 经济地理, 2017, 37(2):98-105.
|
| [10] |
张定, 曹卫东, 范娇娇, 等. 长三角城市物流发展效率的时空格局演化特征与机制[J]. 经济地理, 2014, 34(8):103-110.
|
| [11] |
周平德. 穗、深、港港口和航空物流对经济增长的作用[J]. 经济地理, 2009, 29(6):946-951.
|
| [12] |
|
| [13] |
|
| [14] |
叶磊, 段学军. 基于物流企业的长三角地区城市网络结构[J]. 地理科学进展, 2016, 35(5):622-631.
|
| [15] |
宗会明, 吕瑞辉. 基于物流企业数据的2007—2017年中国城市网络空间特征及演化[J]. 地理科学, 2020, 40(5):760-767.
|
| [16] |
|
| [17] |
|
| [18] |
|
| [19] |
韩增林, 王成金, 尤飞. 我国物流业发展与布局的特点及对策探讨[J]. 地理科学进展, 2002, 21(1):81-89,96.
|
| [20] |
金仁浩, 成晓红, 王莎. 中国A级物流企业空间格局及驱动因素研究[J]. 数学的实践与认识, 2019, 49(3):118-126.
|
| [21] |
陈婷, 徐菱, 贺晓敏. 中国A级物流企业空间分布影响因素研究[J]. 物流技术, 2019, 38(4):49-53,94.
|
| [22] |
沈玉芳, 王能洲, 马仁峰, 等. 长三角区域物流空间布局及演化特征研究[J]. 经济地理, 2011, 31(4):618-623.
|
| [23] |
蒋天颖, 伍婵提, 陈改改. 浙江省A级物流企业时空格局特征研究[J]. 地理科学, 2017, 37(11):1720-1727.
|
| [24] |
蒋天颖, 史亚男. 宁波市物流企业空间格局演化及影响因素[J]. 经济地理, 2015, 35(10):130-138.
|
| [25] |
梁双波, 曹有挥, 吴威. 上海大都市区港口物流企业的空间格局演化[J]. 地理研究, 2013, 32(8):1448-1456.
|
| [26] |
王劲峰, 廖一兰, 刘鑫. 空间数据分析教程[M]. 北京: 科技出版社, 2010.
|
| [27] |
钟业喜, 傅钰, 郭卫东, 等. 中国上市公司总部空间格局演变及其驱动因素研究[J]. 地理科学, 2018, 38(4):485-494.
|
| [28] |
刘敏, 郝炜, 张芙蓉. 山西省A级景区空间分布与影响因素[J]. 经济地理, 2020, 40(8):231-240.
|
| [29] |
韩会然, 杨成凤, 宋金平. 北京批发企业空间格局演化与区位选择因素[J]. 地理学报, 2018, 73(2):219-231.
|
| [30] |
戢晓峰, 王然, 陈方, 等. 中国城市物流蔓延的时空演化特征——基于329个城市的物流用地面板数据[J]. 地理科学, 2021, 41(2):215-222.
|
| [31] |
佟玉权. 基于GIS的中国传统村落空间分异研究[J]. 人文地理, 2014, 29(4):44-51.
|
| [32] |
马晓冬, 马荣华, 徐建刚. 基于ESDA-GIS的城镇群体空间结构[J]. 地理学报, 2004(6):1048-1057.
|
| [33] |
周国华, 刘畅, 唐承丽, 等. 湖南乡村生活质量的空间格局及其影响因素[J]. 地理研究, 2018, 37(12):2475-2489.
|
| [34] |
|
| [35] |
王劲峰, 徐成东. 地理探测器:原理与展望[J]. 地理学报, 2017, 72(1):116-134.
|
| [36] |
王艳华, 赵建吉, 刘娅娜, 等. 中国金融产业集聚空间格局与影响因素——基于地理探测器模型的研究[J]. 经济地理, 2020, 40(4):125-133.
|
| [37] |
蔡海亚, 徐盈之. 长江三角洲物流产业发展格局及影响机理研究——基于空间经济学的视角[J]. 华东经济管理, 2016, 30(10):15-23.
|
| [38] |
钟祖昌. 空间经济学视角下的物流业集聚及影响因素——中国31个省市的经验证据[J]. 山西财经大学学报, 2011, 33(11):55-62.
|
| [39] |
李双成, 蔡运龙. 地理尺度转换若干问题的初步探讨[J]. 地理研究, 2005, 24(1):11-18.
|
/
| 〈 |
|
〉 |