
Multi-dimensional Poverty Reduction Effect of Fiscal Decentralization
Received date: 2020-04-24
Revised date: 2021-04-08
Online published: 2025-04-08
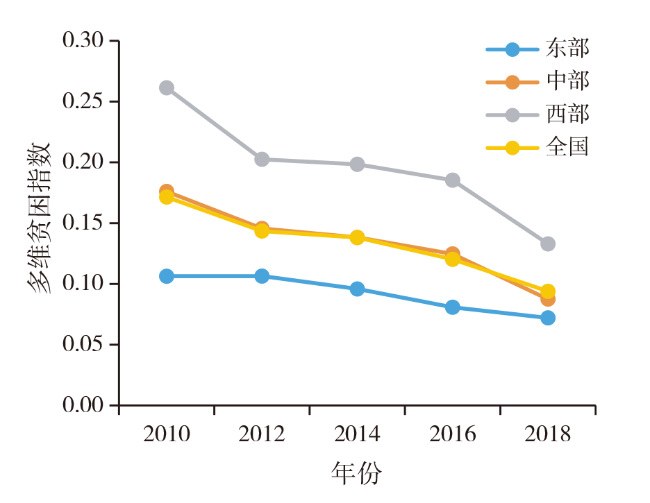
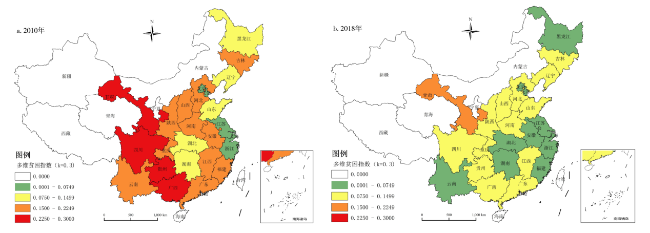
Fiscal decentralization improves the autonomy of local governments and the government can use the information advantage to optimize the structure of fiscal expenditure and improve the multi-dimensional poverty of low-income groups. This paper uses the CFPS data in 2010-2018 to calculate China's multidimensional poverty index,and uses GMM model to explore the multidimensional poverty reduction effect of fiscal decentralization. The results show that: 1) China's multidimensional poverty index shows a downward trend year by year,it has the largest multidimensional poverty index and the decline range in the western region,and the smallest in the eastern region,poverty level of the central region is in the middle level and basically consistent with the national. 2) Fiscal decentralization is conducive to the alleviation of multidimensional poverty. Fiscal decentralization can promote the alleviation of multidimensional poverty through productive fiscal expenditure and service fiscal expenditure,and the poverty reduction effect of service fiscal expenditure is greater than that of productive fiscal expenditure. 3) From the regional perspective,fiscal decentralization in the eastern,central and western regions is conducive to alleviating multidimensional poverty,but the degree of impact is different,and it has the greatest impact in the western region. Therefore,the paper puts forward policy suggestions from the aspects of improving the degree of fiscal decentralization,optimizing the structure of government expenditure,improving the efficiency of fiscal expenditure,achieving high-quality poverty reduction,establishing the integration system of urban and rural poverty reduction,and giving full play to the interaction between governments.
WEI Xiaobo , XIAO Yujun , ZHANG Kexian , WANG Jing , SHI Naifu , LIU Xiaofeng . Multi-dimensional Poverty Reduction Effect of Fiscal Decentralization[J]. Economic geography, 2021 , 41(6) : 39 -48 . DOI: 10.15957/j.cnki.jjdl.2021.06.005
表1 多维贫困指标设计及权重Tab.1 Indicators and weight of multidimensional poverty index |
| 维度 | 指标 | 剥夺临界值 | 权重 |
|---|---|---|---|
| 收入 | 人均纯收入 | 若家庭人均纯收入低于2 300元(2010年不变价),赋值为1,否则为0 | 0.191 |
| 健康 | 健康状况 | 若家庭任意成员健康状况为不健康,赋值为1,否则为0 | 0.067 |
| 医疗 | 医疗保险 | 若家庭任意成员没有参加任何医疗保险,赋值为1,否则为0 | 0.106 |
| 教育 | 受教育年限 | 家庭平均受教育年限低于9年,赋值为1,否则为0 | 0.075 |
| 生活条件 | 用水情况 | 家庭做饭没有使用自来水、矿泉水或纯净水,赋值为1,否则为0 | 0.103 |
| 生活燃料 | 家庭没有使用清洁燃料,赋值为1,否则为0 | 0.116 | |
| 物资资产 | 耐用消费品 | 家庭中耐用消费品一项也没有的,赋值为1,否则为0 | 0.112 |
| 住房面积 | 人均住房面积小于12m2,赋值为1,否则为0 | 0.177 | |
| 金融 | 金融存款 | 家庭现金及存款总额小于2 000元,赋值为1,否则为0 | 0.053 |
注:赋值为1表示在该指标上处于贫困状态,权重由神经网络方法得来。 |
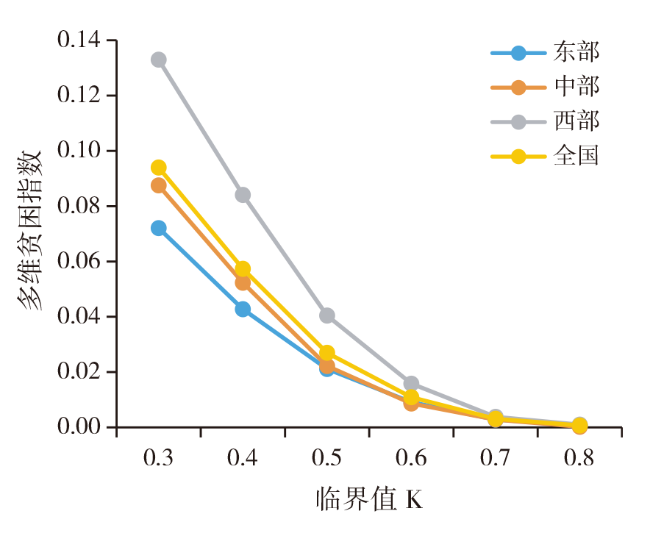
表2 2010—2018年全国多维贫困指数Tab.2 Multidimensional poverty index in 2010-2018 |
| 年份 | 0.3 | 0.4 | 0.5 | 0.6 | 0.7 | 0.8 | |
|---|---|---|---|---|---|---|---|
| 2010 | H | 0.3863 | 0.2249 | 0.1211 | 0.0500 | 0.0132 | 0.0020 |
| A | 0.4438 | 0.5155 | 0.5840 | 0.6535 | 0.7412 | 0.8484 | |
| MP | 0.1715 | 0.1160 | 0.0707 | 0.0327 | 0.0098 | 0.0017 | |
| 2012 | H | 0.3264 | 0.1921 | 0.0855 | 0.0332 | 0.0091 | 0.0010 |
| A | 0.4395 | 0.5039 | 0.5854 | 0.6577 | 0.7467 | 0.8463 | |
| MP | 0.1435 | 0.0968 | 0.0501 | 0.0218 | 0.0068 | 0.0008 | |
| 2014 | H | 0.3173 | 0.1770 | 0.0773 | 0.0269 | 0.0073 | 0.0011 |
| A | 0.4354 | 0.5046 | 0.5859 | 0.6660 | 0.7530 | 0.8403 | |
| MP | 0.1381 | 0.0893 | 0.0453 | 0.0179 | 0.0055 | 0.0009 | |
| 2016 | H | 0.2744 | 0.1571 | 0.0738 | 0.0320 | 0.0114 | 0.0018 |
| A | 0.4383 | 0.5116 | 0.5949 | 0.6702 | 0.7504 | 0.8480 | |
| MP | 0.1203 | 0.0804 | 0.0439 | 0.0214 | 0.0085 | 0.0016 | |
| 2018 | H | 0.2218 | 0.1152 | 0.0461 | 0.0164 | 0.0041 | 0.0008 |
| A | 0.4237 | 0.4979 | 0.5858 | 0.6651 | 0.7578 | 0.8367 | |
| MP | 0.0940 | 0.0573 | 0.0270 | 0.0109 | 0.0031 | 0.0007 | |
数据来源:根据CFPS数据计算得来。 |
表3 全国层面上财政分权对多维贫困的影响Tab.3 The influence of fiscal decentralization on multidimensional poverty at the national level |
| (1)PE | (2)MP | (3)MP | (4)MP | (5)SE | (6)MP | (7)MP | |
|---|---|---|---|---|---|---|---|
| FD | 0.2978***(4.63) | -0.2913***(-4.21) | 0.3369**(2.59) | ||||
| FE | -0.2833**(-2.01) | ||||||
| SE | -0.7453***(-3.10) | ||||||
| FD·FE | -0.4292**(-2.16) | ||||||
| FD·SE | -1.4276***(-2.63) | ||||||
| IS | -0.0825*(-1.71) | -0.0867*(-1.67) | -0.0696(-1.45) | -0.0499(-0.78) | -0.0755(-1.52) | ||
| UR | -0.0334(-0.51) | -0.0248(-0.37) | -0.0409(-0.64) | -0.0342(-0.38) | -0.0176(-0.22) | ||
| LD | -0.0829***(-4.25) | -0.0825***(-4.17) | -0.0800***(-4.18) | -0.0647**(-2.28) | -0.0693***(-2.78) | ||
| TL | -0.0052(-1.18) | -0.0053(-1.19) | -0.0057(-1.33) | -0.0142**(-2.19) | -0.0081*(-1.69) | ||
| 常数 | 0.2372***(21.62) | 1.1670***(7.48) | 1.1942***(7.03) | 1.1137***(7.28) | 0.0475**(2.25) | 1.0752***(4.88) | 1.0145***(5.05) |
| Sargan | 0.3611 | 0.3619 | 0.3368 | 0.4786 | 0.4279 | 0.3175 | 0.4096 |
| Hansen J | 0.4333 | 0.3821 | 0.3265 | 0.4851 | 0.3369 | 0.3872 | 0.3735 |
表4 分区域的财政分权对多维贫困的影响效应分析Tab.4 Analysis of the effect of fiscal decentralization in different regions on multidimensional poverty |
| 东部 | 中部 | 西部 | |||||||||
|---|---|---|---|---|---|---|---|---|---|---|---|
| (1) | (2) | (3) | (4) | (5) | (6) | (7) | (8) | (9) | |||
| FD | -0.1585* (-1.67) | -0.2226** (-2.34) | -0.5614*** (-3.13) | ||||||||
| FD·FE | -1.0865** (-2.23) | -0.6613** (-2.50) | -1.9618*** (-3.07) | ||||||||
| FD·SE | -1.1387*** (-2.69) | -1.5300*** (-2.85) | -3.1427*** (-2.59) | ||||||||
| IS | -0.0251 (-0.35) | -0.0788 (-0.91) | -0.0543 (-0.83) | -0.1596 (-1.45) | -0.1688 (-1.53) | -0.1130 (-1.15) | -0.2498** (-2.16) | -0.2389** (-2.04) | -0.1866 (-1.41) | ||
| UR | -0.0949 (-1.08) | -0.0697 (-0.69) | -0.0636 (-0.80) | -0.0434 (-0.24) | -0.0072 (-0.04) | -0.0744 (-0.45) | -0.2501 (-1.19) | -0.2987 (-1.41) | -0.2520 (-1.04) | ||
| LD | -0.0753*** (-2.99) | -0.0800*** (-2.75) | -0.0719*** (-3.19) | -0.0557* (-1.71) | -0.0624* (-1.87) | -0.0516* (-1.71) | -0.1514*** (-3.07) | -0.11528*** (-3.05) | -0.1106* (-1.80) | ||
| TL | -0.0019 (-0.32) | -0.0015 (-0.23) | -0.0019 (-0.36) | -0.0198*** (-2.60) | -0.0175** (-2.18) | -0.0202*** (-2.87) | -0.0004 (-0.03) | -0.0063 (-0.50) | -0.0169 (-1.01) | ||
| 常数 | 1.0409***(4.87) | 1.1251***(4.49) | 0.9894***(5.23) | 1.0348***(4.12) | 1.0622***(4.18) | 0.9771***(4.21) | 1.8264***(4.92) | 1.8688***(4.95) | 1.5019***(3.39) | ||
| Sargan | 0.4449 | 0.2317 | 0.2449 | 0.6547 | 0.6766 | 0.7168 | 0.6946 | 0.6119 | 0.7966 | ||
| Hansen J | 0.4159 | 0.2912 | 0.3117 | 0.6262 | 0.5985 | 0.6862 | 0.6666 | 0.5934 | 0.8078 | ||
表5 模型的稳健性检验Tab.5 Robustness test of the model |
| (1)MP | (2)MP | (3)MP | (4)MP | (5)MP | |
|---|---|---|---|---|---|
| FD | -0.2267*** (-3.92) | ||||
| FE | -0.3196** (-2.37) | ||||
| SE | -0.5910*** (-3.24) | ||||
| FD·FE | -0.8047*** (-4.19) | ||||
| FD·SE | -1.7332*** (-4.60) | ||||
| IS | -0.0391 (-0.97) | -0.0575 (-1.27) | -0.0136 (-0.26) | -0.0925* (-1.91) | -0.0582 (-1.24) |
| UR | -0.0312 (-0.58) | -0.0113 (-0.20) | -0.0314 (-0.42) | -0.0219 (-0.34) | -0.0555 (-0.87) |
| LD | -0.0600*** (-3.70) | -0.0625*** (-3.69) | -0.0458** (-1.97) | -0.0849*** (-4.37) | -0.0722*** (-3.77) |
| TL | -0.0038 (-1.04) | -0.0033 (-0.88) | -0.0109** (-2.07) | -0.0047 (-1.08) | -0.0081* (-1.89) |
| 常数 | 0.8329***(6.41) | 0.9056***(6.11) | 0.7617***(4.20) | 1.1723***(7.55) | 1.0654***(7.03) |
| Sargan | 0.3338 | 0.6479 | 0.7817 | 0.7505 | 0.4286 |
| Hansen J | 0.2959 | 0.7205 | 0.8083 | 0.7165 | 0.4314 |
| [1] |
李东, 孙东琪. 2010—2016年中国多维贫困动态分析——基于中国家庭跟踪调查(CFPS)数据的实证研究[J]. 经济地理, 2020, 40(1):41-49.
|
| [2] |
|
| [3] |
|
| [4] |
|
| [5] |
|
| [6] |
王晓芳, 谢贤君. 财政分权是否有助于降低农村贫困水平——基于生产性与非生产性财政支出视角[J]. 财经科学, 2018(3):55-66.
|
| [7] |
孙博文, 谢贤君. 财政分权是否有助于降低贫困水平?——基于生存型与发展型投资支出的视角[J]. 经济科学, 2018(2):30-44.
|
| [8] |
|
| [9] |
|
| [10] |
刘力华, 周虎, 侯圣清. 财政分权、亲贫式支出与减贫的关系研究[J]. 农学学报, 2014, 4(6):112-115,124.
|
| [11] |
张克中, 冯俊诚, 鲁元平. 财政分权有利于贫困减少吗?——来自分税制改革后的省际证据[J]. 数量经济技术经济研究, 2010, 27(12):3-15.
|
| [12] |
储德银, 赵飞. 财政分权、政府转移支付与农村贫困——基于预算内外和收支双重维度的门槛效应分析[J]. 财经研究, 2013, 39(9):4-18.
|
| [13] |
刘建民, 欧阳玲, 毛军. 财政分权、经济增长与政府减贫行为[J]. 中国软科学, 2018(6):139-150.
|
| [14] |
张军. 分权与增长:中国的故事[J]. 经济学(季刊), 2008(1):21-52.
|
| [15] |
程名望,
|
| [16] |
张晏, 龚六堂. 分税制改革、财政分权与中国经济增长[J]. 经济学(季刊), 2005(4):75-108.
|
| [17] |
孙萌, 台航. 财政分权与经济增长:理论分析与经验证据[J]. 经济评论, 2019(5):3-21.
|
| [18] |
吕勇斌, 金照地, 付宇. 财政分权、金融分权与地方经济增长的空间关联[J]. 财政研究, 2020(1):25-44.
|
| [19] |
江红莉, 蒋鹏程. 财政分权、技术创新与经济增长质量[J]. 财政研究, 2019(12):75-86.
|
| [20] |
冯伟, 苏娅. 财政分权、政府竞争和中国经济增长质量:基于政治经济学的分析框架[J]. 宏观质量研究, 2019, 7(4):33-47.
|
| [21] |
戈大专, 龙花楼, 屠爽爽, 等. 新型城镇化与扶贫开发研究进展与展望[J]. 经济地理, 2016, 36(4):22-28,5.
|
| [22] |
张毓雄, 范雅静, 杨沐寒. 中国城镇化进程对多维贫困的影响效应研究——基于Multinomial Logit模型[J]. 宏观经济研究, 2020(8):118-130,175.
|
| [23] |
张博胜, 杨子生. 中国城镇化的农村减贫及其空间溢出效应——基于省级面板数据的空间计量分析[J]. 地理研究, 2020, 39(7):1592-1608.
|
| [24] |
解垩. 城镇化与中国农村减贫[J]. 经济科学, 2020(3):5-16.
|
| [25] |
张萃. 中国经济增长与贫困减少——基于产业构成视角的分析[J]. 数量经济技术经济研究, 2011, 28(5):51-63.
|
| [26] |
陈成文, 陈建平, 陶纪坤. 产业扶贫:国外经验及其政策启示经济地理, 2018, 38(1):127-134.
|
| [27] |
|
| [28] |
宋美喆, 刘寒波, 叶琛. 财政分权对全要素生产率的影响——基于“省直管县”改革的准自然实验[J]. 经济地理, 2020, 40(3):33-42.
|
/
| 〈 |
|
〉 |