
Spatial Distribution Characteristics and Influencing Factors of China National Forest Villages
Received date: 2020-07-03
Revised date: 2021-05-07
Online published: 2025-04-08
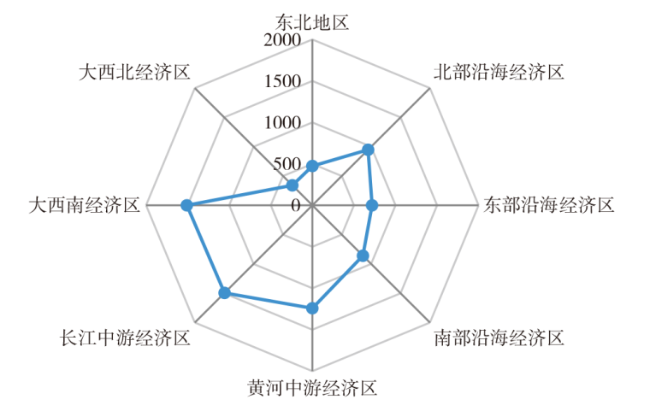
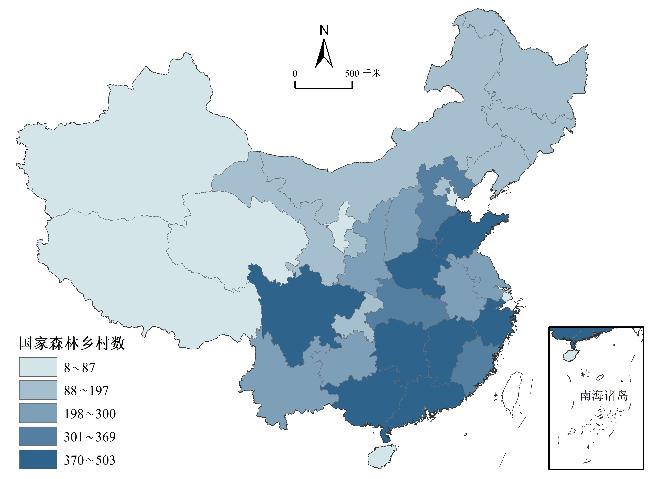
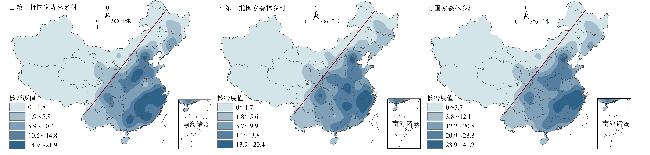
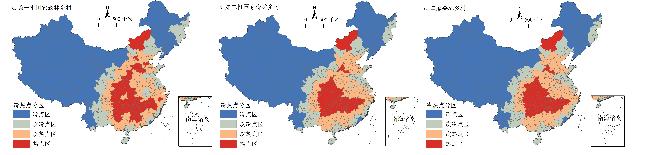
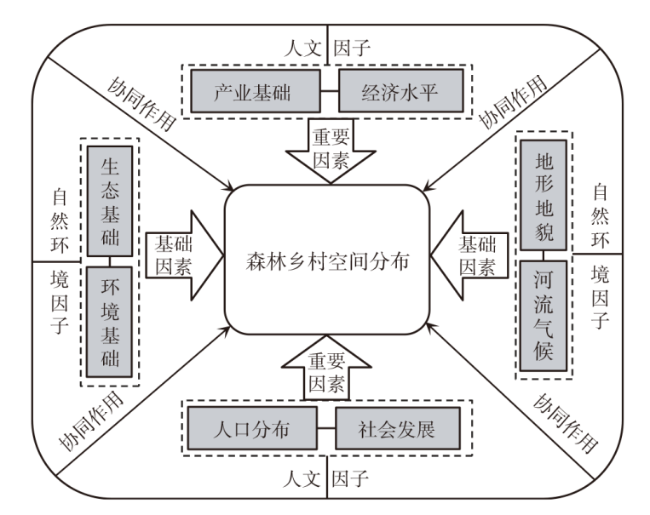
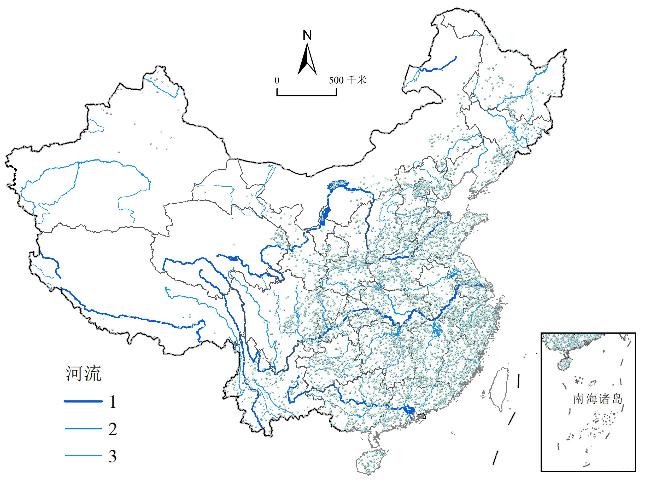
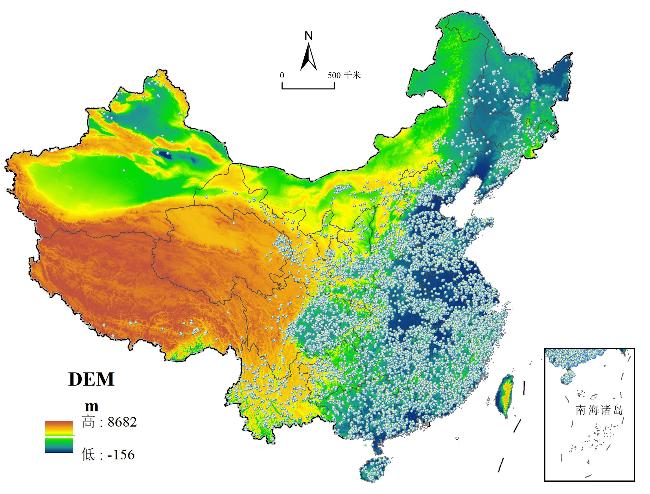
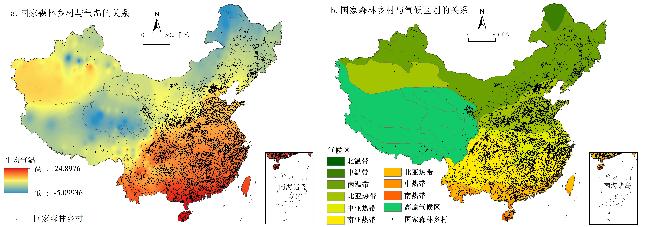
Based on the methods of imbalance index,kernel density analysis,spatial autocorrelation,this paper analyzes the spatial distribution characteristics of 7586 countries' forests and villages,and use geographic detectors and geographic overlay analysis to detect its influencing factors. The results show that: 1) In terms of overall spatial distribution,it presents a distribution pattern of "large agglomeration and small dispersion",and more significant agglomeration characteristic in the east of China than the west. 2) In terms of regional spatial distribution,it is in three major regions and eight sub-regions that it shows the characteristic of uneven distribution,and the distribution at the provincial level is extremely uneven. It accounts for 40.23% of the forest villages in the eastern region,and 79.79% in the six regions which includes the southwest and the middle reaches of the Yangtze River. 3) In terms of spatial density distribution,high-density regions distribute in the Heihe-Tengchong,the east of Beijing and the junction of Jiangsu,Zhejiang,Anhui,Jiangxi and Hunan. North China,Central China and South China are the two core continuous areas. 4) In terms of the spatial correlation,hot spot areas locate in the central and eastern regions and change from the scattered and band-shaped distribution to cluster-shaped agglomeration. Cold spot areas locate in the northwest and northeast regions and have little change. 5) In terms of influencing factors,the spatial distribution of national forest villages is affected by multiple factors which are economy,society,ecology and physical geography,among which ecological factor has greater influence than other factors. Rivers,topography,and climate also have a greater impact on the spatial distribution of national forest villages.
CHEN Gang , WU Qing , YANG Jianbo , LIU Shu'an . Spatial Distribution Characteristics and Influencing Factors of China National Forest Villages[J]. Economic geography, 2021 , 41(6) : 196 -204 . DOI: 10.15957/j.cnki.jjdl.2021.06.022
表1 基本地理分析模型释义表Tab.1 Interpretation of basic geographic analysis model |
| 地理模型 | 分析公式 | 模型释义 | 地理意义 | 备注 |
|---|---|---|---|---|
| 不均衡指数 | n为区域数量;Yi为各区国家森林乡村数占全国比重中由大到小排列第i位的累计百分比 | S为不均衡指数,若S=0表明均匀分布,若S=1表示分布极不均衡 | 公式1 | |
| 核密度值 | 为核函数;h>0为带宽;x-xi表示估值点x到事件xi处的距离 | 值越大,表示点越密集,发生的概率越高 | 公式2 | |
| 全局自相关 | N为国家森林乡村数量;Xi、Xj,表示在第i、j省域单元上的国家森林乡村; 为国家森林乡村的均值;Wij为空间权重矩阵;S0为空间权重矩阵之和 | Moran's I指数取值范围介于-1~1之间 | 公式3 | |
| 局部关联指数 | Wij是i、j单元之间的距离权重 | 显著的正 表示单元i的邻居的观测值高,显著的负 表示单元i的邻居的观测值低 | 公式4 | |
| 地理探测器 | L是国家森林乡村空间分布区;Nh和 分别表示层h的方差;N和 为整体的单元数和方差 | q为各因子对国家森林乡村对空间分布的影响力,值域范围为[0,1],值越大,对国家森林乡村空间分布的解释力越大 | 公式5 |
表2 三大区域国家森林乡村及其占比统计Tab.2 Forests villages and their proportion statistics in three regions |
| 第一批国家森林 乡村数(个) | 第一批国家森林 乡村占比(%) | 第二批国家森林 乡村数(个) | 第二批国家森林 乡村占比(%) | 国家森林 乡村数(个) | 国家森林 乡村占比(%) | |
|---|---|---|---|---|---|---|
| 东部 | 1 620 | 41.04 | 1 432 | 39.35 | 3 052 | 40.23 |
| 中部 | 1 432 | 36.28 | 1 352 | 37.15 | 2 784 | 36.70 |
| 西部 | 895 | 22.68 | 855 | 23.50 | 1 750 | 23.07 |
| 全国 | 3 947 | 100 | 3 639 | 100 | 7 586 | 100 |
表3 中国国家森林乡村的全局Moran's I指数Tab.3 Global Moran' s I index of China national forest villages |
| 第一批国家 森林乡村 | 第二批国家 森林乡村 | 两批次国家 森林乡村 | |
|---|---|---|---|
| 全局Moran's I指数 | 0.0968 | 0.1237 | 0.1111 |
| 预期指数 | -0.0333 | -0.0333 | -0.0333 |
| 方差 | 0.0061 | 0.0061 | 0.0061 |
| Z值 | 1.6581 | 2.0002 | 1.8394 |
| P值 | 0.0972 | 0.0454 | 0.0658 |
表4 中国国家森林乡村空间分布的影响因素地理探测器分析Tab.4 Geodetector analysis of influencing factors of China national forest villages |
| 一级指标 | 二级指标 | q值 |
|---|---|---|
| 社会人口因素 | 美丽乡村数量 | 0.361 |
| 年末总人口 | 0.767 | |
| 公路里程 | 0.383 | |
| 人均可支配收入 | 0.155 | |
| 消费价格指数 | 0.157 | |
| 产业经济因素 | GDP | 0.443 |
| 旅游外汇收入 | 0.228 | |
| 第三产业增加值 | 0.455 | |
| 人均GDP | 0.117 | |
| 生态环境因素 | 森林面积 | 0.237 |
| 造林面积 | 0.148 | |
| 人工林面积 | 0.602 | |
| 湿地面积 | 0.556 | |
| 环境投资 | 0.418 |
| [1] |
国家林业和草原局. 国家森林乡村评定办法(暂行)[EB/OL]. http://www.zjly.gov.cn/art/2019/9/6/art_1346870_385.html 2019-09-05
|
| [2] |
中华人民共和国中央人民政府. 中共中央国务院关于实施乡村振兴战略的意见[EB/OL]. http://gov.cn/zhengce/201802/04/content_5263807.html 2018-08-16.
|
| [3] |
贺艳华, 邬建国, 周国华, 等. 论乡村可持续性与乡村可持续性科学[J]. 地理学报, 2020, 75(4):736-752.
|
| [4] |
李红波, 张小林. 国外乡村聚落地理研究进展及近今趋势[J]. 人文地理, 2012, 27(4):103-108.
|
| [5] |
|
| [6] |
|
| [7] |
|
| [8] |
|
| [9] |
|
| [10] |
李雅丽, 陈宗兴. 陕北乡村聚落地理的初步研究[J]. 干旱区地理, 1994(1):46-52.
|
| [11] |
周扬, 黄晗, 刘彦随. 中国村庄空间分布规律及其影响因素[J]. 地理学报, 2020, 75(10):2206-2223.
|
| [12] |
|
| [13] |
吴清, 冯嘉晓, 朱春晓, 等. 中国美丽乡村空间分异及其影响因素研究[J]. 地域研究与开发, 2020, 39(3):19-24.
|
| [14] |
陈烨烽, 王艳慧, 王小林. 中国贫困村测度与空间分布特征分析[J]. 地理研究, 2016, 35(12):2298-2308.
|
| [15] |
陈刚, 彭庭莹, 吴清. 大别山片区国家级贫困村空间分布特征与影响因素[J]. 地域研究与开发, 2019, 38(5):120-124.
|
| [16] |
刘大均, 胡静, 陈君子, 等. 中国传统村落的空间分布格局研究[J]. 中国人口·资源与环境, 2014, 24(4):157-162.
|
| [17] |
陈君子, 刘大均, 周勇, 等. 嘉陵江流域传统村落空间分布及成因分析[J]. 经济地理, 2018, 38(2):148-153.
|
| [18] |
刘晨光. 黄河流域专业村空间格局演化及影响因素[J]. 资源科学, 2020, 42(12):2300-2313.
|
| [19] |
马斌斌, 陈兴鹏, 马凯凯, 等. 中国乡村旅游重点村空间分布、类型结构及影响因素[J]. 经济地理, 2020, 40(7):190-199.
|
| [20] |
郭远智, 周扬, 刘彦随. 贫困地区的精准扶贫与乡村振兴:内在逻辑与实现机制[J]. 地理研究, 2019, 38(12):2819-2832.
|
| [21] |
刘彦随, 周扬, 李玉恒. 中国乡村地域系统与乡村振兴战略[J]. 地理学报, 2019, 74(12):2511-2528.
|
| [22] |
龙花楼, 邹健, 李婷婷, 等. 乡村转型发展特征评价及地域类型划分——以“苏南—陕北”样带为例[J]. 地理研究, 2012, 31(3):495-506.
|
| [23] |
王社教. 论历史乡村地理学研究[J]. 陕西师范大学学报:哲学社会科学版, 2006(4):71-77.
|
| [24] |
李全林, 马晓冬, 沈一. 苏北地区乡村聚落的空间格局[J]. 地理研究, 2012, 31(1):144-154.
|
| [25] |
戈大专, 龙花楼. 论乡村空间治理与城乡融合发展[J]. 地理学报, 2020, 75(6):1272-1286.
|
| [26] |
吴清, 冯嘉晓, 陈刚, 等. 山岳型乡村旅游地“三生”空间演变及优化——德庆金林水乡的案例实证[J]. 生态学报, 2020, 40(16):5560-5570
|
| [27] |
李细归, 肖鹏南, 吴清, 等. 中国公共图书馆时空格局演变及影响因素研究[J]. 人文地理, 2019, 34(1):140-150.
|
| [28] |
王劲峰, 徐成东. 地理探测器:原理与展望[J]. 地理学报, 2017, 72(1):116-134.
|
| [29] |
王兆峰, 刘庆芳. 中国少数民族特色村寨空间异质性特征及其影响因素[J]. 经济地理, 2019, 39(11):150-158.
|
| [30] |
李佳洺, 陆大道, 徐成东, 等. 胡焕庸线两侧人口的空间分异性及其变化[J]. 地理学报, 2017, 72(1):148-160.
|
| [31] |
龚胜生, 张涛. 中国“癌症村”时空分布变迁研究[J]. 中国人口·资源与环境, 2013, 23(9):156-164.
|
/
| 〈 |
|
〉 |
