
The Influence of Urban Public Rail Transport on the Land Use Change:A Case Study of the Metro Line 3 and Line 7 in Guangzhou
Received date: 2020-12-27
Revised date: 2021-05-01
Online published: 2025-04-08
Based on "3S" and POI data,this paper obtains the fine-scale land use information in the study area. According to the urbanization development level of each region,it delimited corresponding buffer range of the Metro Line 3 and Line 7 in Guangzhou,and investigated the spatio-temporal impacts of public rail transport on land-use change. It simulated and predicted the land use in 2027 using CA-Markov probability model. The results indicated that: 1) Reasonable buffers are important to obtain fine statistical area of land change affected by public rail transport by reducing interference of other factors to some extent. 2) The public rail transport promotes denser development and more intense utilization of land in the imminent areas,which thus brings huge economic benefits and inevitable impacts on urban ecological landscape. 3) The most significant land use change mainly distributed in undeveloped urban areas. 4) Based on the results of the CA-Markov model,land use configuration in the proximity of Line 3 will keep stable if there is no major policy intervention in the future,while it will become more intensive in the proximity of Line 7.
HE Yinjie , WU Dafang , LIU Yanyan , ZHANG Zhanlu , LIU Yihua . The Influence of Urban Public Rail Transport on the Land Use Change:A Case Study of the Metro Line 3 and Line 7 in Guangzhou[J]. Economic geography, 2021 , 41(6) : 171 -179 . DOI: 10.15957/j.cnki.jjdl.2021.06.019
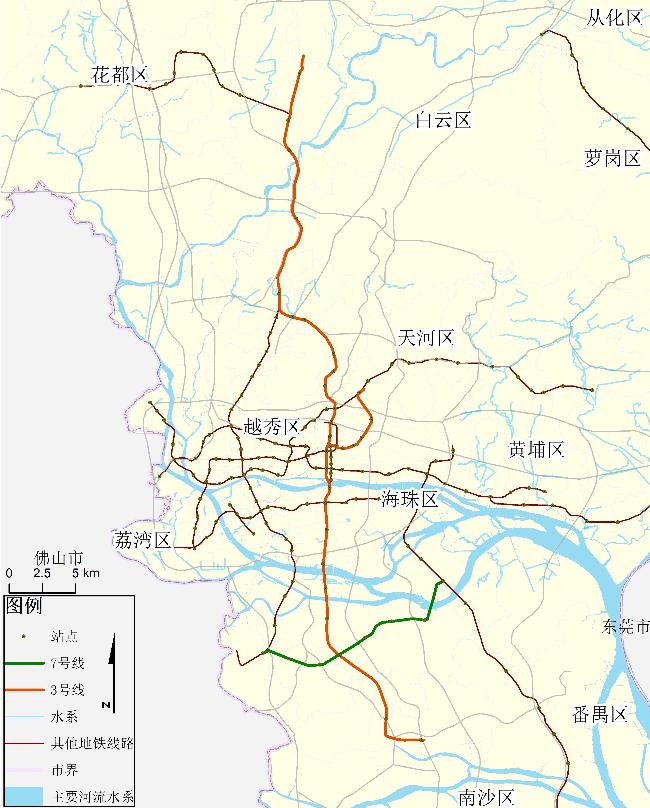
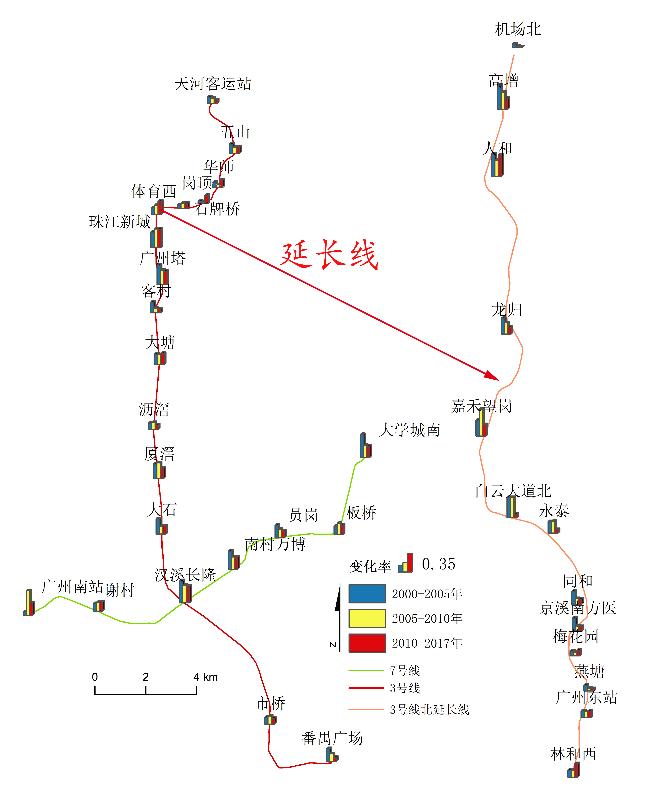
表1 广州地铁3、7号线概况Tab.1 Overview of Guangzhou Metro Line 3 and Line 7 |
| 线路 | 路段 | 建前规划时间 | 运营时间 | 线路长度(km) |
|---|---|---|---|---|
| 广州地铁3号线 | 广州东站—客村站 | 1997 | 2005年12月 | 64.41 |
| 广州东站—番禺广场站 | 2000 | 2006年12月 | ||
| 天河客运站—石牌桥站 | 2000 | 2006年12月 | ||
| 机场南站—体育西路站 | 2003 | 2010年10月 | ||
| 广州地铁7号线 | 广州南站—大学城南站 | - | 2016年12月 | 17.41 |
表2 广州各区域划分表Tab.2 Partition of different districts of Guangzhou |
| 区域名称 | 人口城市化率 (PU)/% | 各区GDP占全市的比重(EU)/% | 城市建设用地面积占土地 面积的比重(SU)/% | 城市化水平复合指数(IU)/% | 区域划分 | 交通线路影响范围/m |
|---|---|---|---|---|---|---|
| 天河区 | 100.00 | 20.10 | 57.00 | 61.29 | 特别繁华区 | 1 400 |
| 海珠区 | 100.00 | 8.10 | 65.00 | 59.09 | 繁华区 | 1 200 |
| 番禺区 | 89.07 | 9.10 | 34.00 | 47.31 | 一般区 | 1 000 |
| 白云区 | 80.93 | 8.30 | 38.00 | 44.78 | 一般区 | 1 000 |
注:数据为2017年,PU、EU来源于广州市各区统计年鉴,SU来源于遥感图像解译。 |
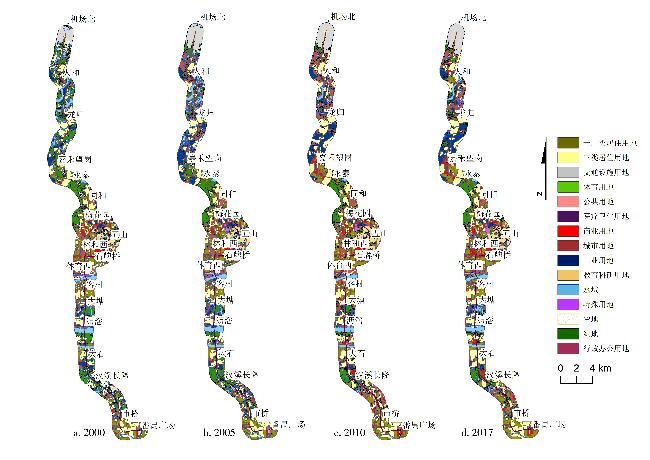
图2 2000—2017年广州地铁3号线沿线土地利用分布图Fig.2 The land use of Guangzhou Metro Line 3 from 2000 to 2017 |
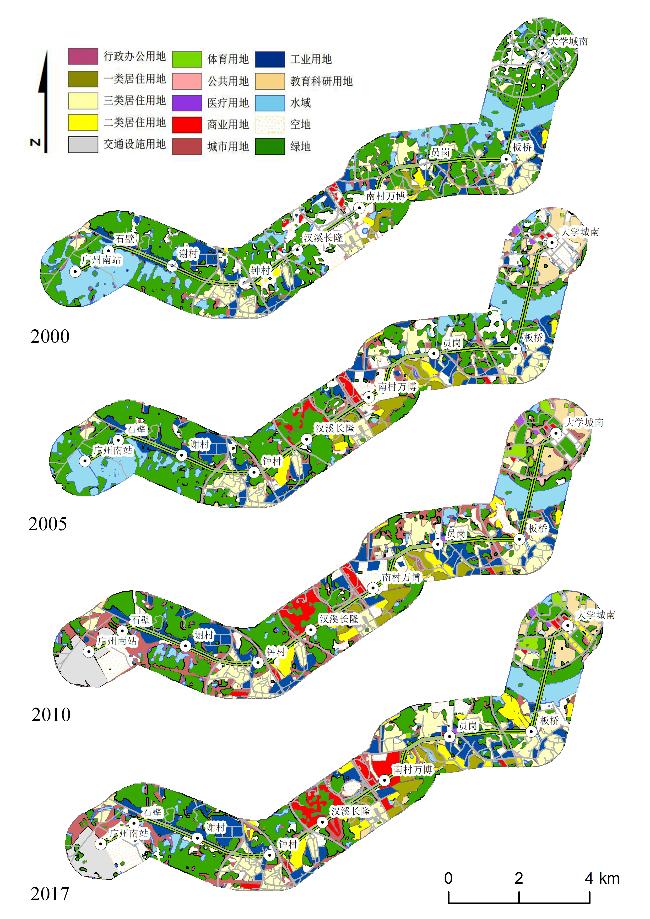
图3 2000—2017年广州地铁7号线沿线土地利用分布图Fig.3 The land-use of Guangzhou Metro Line 7 from 2000 to 2017 |
表3 2000—2017年地铁3号线各类型的土地利用面积Tab.3 The land use area of Metro Line 3 from 2000 to 2017 |
| 用地类型 | 2000 | 2005 | 2010 | 2017 | |||||||
|---|---|---|---|---|---|---|---|---|---|---|---|
| 面积(hm2) | 百分比(%) | 面积(hm2) | 百分比(%) | 面积(hm2) | 百分比(%) | 面积(hm2) | 百分比(%) | ||||
| 城市其他用地 | 2 091.65 | 14.42 | 2 583.66 | 17.96 | 3 261.81 | 22.66 | 2 603.72 | 17.92 | |||
| 工业用地 | 973.05 | 6.71 | 1 153.48 | 8.02 | 1 129.34 | 7.85 | 1 217.26 | 8.38 | |||
| 公共用地 | 33.08 | 0.23 | 16.24 | 0.11 | 27.07 | 0.19 | 58.87 | 0.41 | |||
| 行政办公用地 | 28.52 | 0.20 | 31.05 | 0.22 | 53.57 | 0.37 | 60.78 | 0.42 | |||
| 交通设施用地 | 422.20 | 2.91 | 603.29 | 4.19 | 634.73 | 4.41 | 643.36 | 4.43 | |||
| 教育科研用地 | 665.68 | 4.59 | 757.94 | 5.27 | 871.99 | 6.06 | 771.08 | 5.31 | |||
| 空地 | 1 198.46 | 8.26 | 587.81 | 4.09 | 423.01 | 2.94 | 182.79 | 1.26 | |||
| 绿地 | 3 124.40 | 21.54 | 2 525.20 | 17.55 | 1 580.30 | 10.98 | 1 812.33 | 12.48 | |||
| 三类居住用地 | 2 562.60 | 17.66 | 2 413.80 | 16.78 | 2 758.45 | 19.17 | 2 882.64 | 19.84 | |||
| 商业用地 | 588.22 | 4.05 | 635.00 | 4.41 | 900.08 | 6.25 | 1 055.73 | 7.27 | |||
| 水域 | 1 207.19 | 8.32 | 1 284.17 | 8.93 | 603.10 | 4.19 | 869.09 | 5.98 | |||
| 特殊用地 | 60.96 | 0.42 | 45.07 | 0.31 | 45.87 | 0.32 | 52.07 | 0.36 | |||
| 体育用地 | 36.62 | 0.25 | 43.19 | 0.30 | 39.89 | 0.28 | 56.88 | 0.39 | |||
| 一二类居住用地 | 1 510.21 | 10.41 | 1 700.97 | 11.82 | 2 023.59 | 14.06 | 2 221.84 | 15.29 | |||
| 医疗用地 | 3.91 | 0.03 | 6.17 | 0.04 | 39.00 | 0.27 | 39.03 | 0.27 | |||
表4 2000—2017年地铁7号线各类型的土地利用面积Tab.4 The land use area of Metro Line 7 from 2000 to 2017 |
| 用地类型 | 2000 | 2005 | 2010 | 2017 | |||||||
|---|---|---|---|---|---|---|---|---|---|---|---|
| 面积(hm2) | 百分比(%) | 面积(hm2) | 百分比(%) | 面积(hm2) | 百分比(%) | 面积(hm2) | 百分比(%) | ||||
| 城市其他用地 | 214.40 | 5.71 | 632.21 | 15.95 | 1 014.13 | 25.16 | 743.54 | 18.66 | |||
| 二类居住用地 | 54.22 | 1.44 | 87.37 | 2.20 | 121.68 | 3.02 | 214.40 | 5.38 | |||
| 工业用地 | 314.98 | 8.38 | 393.00 | 9.92 | 417.68 | 10.36 | 379.57 | 9.53 | |||
| 公共用地 | 0.43 | 0.01 | 12.64 | 0.32 | 17.45 | 0.43 | 5.40 | 0.14 | |||
| 行政办公用地 | 0.00 | 0.00 | 0.00 | 0.00 | 2.23 | 0.06 | 2.23 | 0.06 | |||
| 交通设施用地 | 1.38 | 0.04 | 1.55 | 0.04 | 169.46 | 4.20 | 138.95 | 3.49 | |||
| 教育科研用地 | 8.42 | 0.22 | 139.09 | 3.51 | 147.13 | 3.65 | 157.29 | 3.95 | |||
| 空地 | 465.97 | 12.40 | 342.82 | 8.65 | 311.13 | 7.72 | 299.05 | 7.51 | |||
| 绿地 | 1 667.58 | 44.38 | 1 357.30 | 34.25 | 886.40 | 21.99 | 987.07 | 24.77 | |||
| 三类居住用地 | 338.28 | 9.00 | 360.13 | 9.09 | 415.24 | 10.30 | 441.86 | 11.09 | |||
| 商业用地 | 21.11 | 0.56 | 57.31 | 1.45 | 121.57 | 3.02 | 200.03 | 5.02 | |||
| 水域 | 633.72 | 16.87 | 456.16 | 11.51 | 209.00 | 5.19 | 226.50 | 5.68 | |||
| 体育用地 | 0.66 | 0.02 | 4.87 | 0.12 | 42.22 | 1.05 | 38.36 | 0.96 | |||
| 一类居住用地 | 36.05 | 0.96 | 112.13 | 2.83 | 144.06 | 3.57 | 139.57 | 3.50 | |||
| 医疗用地 | 0.00 | 0.00 | 6.14 | 0.15 | 11.32 | 0.28 | 10.76 | 0.27 | |||
表5 景观格局指数(景观级别)Tab.5 Landscape pattern indexes (landscape) |
| 线路 | CONTAG蔓延度(%) | SHDI香浓多样性 | SHEI香浓均匀度 | |||||||||||
|---|---|---|---|---|---|---|---|---|---|---|---|---|---|---|
| 2017 | 2010 | 2005 | 2000 | 2017 | 2010 | 2005 | 2000 | 2017 | 2010 | 2005 | 2000 | |||
| 7号线 | 45.97 | 47.36 | 50.40 | 54.29 | 2.16 | 2.12 | 1.93 | 1.67 | 0.80 | 0.78 | 0.73 | 0.65 | ||
| 3号线 | 47.78 | 48.09 | 45.57 | 45.91 | 2.17 | 2.17 | 2.19 | 2.16 | 0.80 | 0.80 | 0.81 | 0.80 | ||
表6 2017—2027年研究区土地利用变化Tab.6 Land-use changes of the study area from 2017 to 2027 |
| 用地类型 | 7号线 | 3号线 | |||||||||
|---|---|---|---|---|---|---|---|---|---|---|---|
| 2017 | 2027 | 2017 | 2027 | ||||||||
| 面积(hm2) | 百分比(%) | 面积(hm2) | 百分比(%) | 面积(hm2) | 百分比(%) | 面积(hm2) | 百分比(%) | ||||
| 城市其他用地 | 743 | 18.66 | 796 | 20.00 | 2 604 | 17.92 | 2 236 | 15.27 | |||
| 工业用地 | 379 | 9.53 | 396 | 9.94 | 1 217 | 8.38 | 1 202 | 8.29 | |||
| 公共用地 | 5 | 0.14 | 16 | 0.39 | 59 | 0.41 | 74 | 0.51 | |||
| 行政办公用地 | 2 | 0.06 | 2 | 0.04 | 61 | 0.42 | 54 | 0.37 | |||
| 交通设施用地 | 138 | 3.49 | 154 | 3.86 | 643 | 4.43 | 645 | 4.45 | |||
| 教育科研用地 | 157 | 3.95 | 157 | 3.95 | 771 | 5.31 | 615 | 4.24 | |||
| 空地 | 299 | 7.51 | 40 | 1.00 | 183 | 1.26 | 39 | 0.27 | |||
| 绿地 | 987 | 24.77 | 975 | 24.46 | 1 812 | 12.48 | 2 208 | 15.22 | |||
| 三类居住用地 | 441 | 11.09 | 459 | 11.51 | 2 883 | 19.84 | 2 896 | 19.97 | |||
| 商业用地 | 200 | 5.02 | 341 | 8.72 | 1 056 | 7.27 | 1 072 | 7.39 | |||
| 水域 | 226 | 5.68 | 223 | 5.60 | 869 | 5.98 | 802 | 5.53 | |||
| 体育用地 | 38 | 0.96 | 37 | 0.94 | 57 | 0.39 | 51 | 0.35 | |||
| 一类居住用地 | 139 | 3.50 | 139 | 3.49 | 2 222 | 15.29 | 2 524 | 17.39 | |||
| 二类居住用地 | 214 | 5.38 | 232 | 5.82 | |||||||
| 医疗用地 | 10 | 0.27 | 11 | 0.28 | 39 | 0.27 | 39 | 0.27 | |||
| 特殊用地 | 0 | 0.00 | 0 | 0.00 | 52 | 0.36 | 71 | 0.49 | |||
| [1] |
|
| [2] |
|
| [3] |
|
| [4] |
|
| [5] |
|
| [6] |
|
| [7] |
|
| [8] |
|
| [9] |
何尹杰, 吴大放, 刘艳艳. 城市轨道交通对土地利用的影响研究综述——基于Citespace的计量分析[J]. 地球科学进展, 2018, 33(12):1259-1271.
|
| [10] |
|
| [11] |
|
| [12] |
|
| [13] |
|
| [14] |
|
| [15] |
|
| [16] |
|
| [17] |
李少英, 彭洁玲, 吴志峰, 等. 基于地铁与土地利用影响关系的广州地铁站点特征聚类[J]. 广州大学学报:自然科学版, 2016, 15(3):63-69.
|
| [18] |
谭章智, 李少英, 黎夏, 等. 城市轨道交通对土地利用变化的时空效应[J]. 地理学报, 2017, 72(5):850-862.
|
| [19] |
何冬华. TOD影响下的站点地区空间发展演进与土地利用形态重组[J]. 规划师, 2017, 33(4):126-131.
|
| [20] |
李铖, 李俊祥, 李蓉, 等. 上海轨道交通对城市土地利用变化的影响[J]. 应用生态学报, 2008, 19(7):1537-1543.
|
| [21] |
刘保奎, 冯长春. 城市轨道交通对站点周边土地利用结构的影响[J]. 城市发展研究, 2009, 16(4):149-155.
|
| [22] |
刘诗奇, 郭静, 李若溪, 等. 北京轨道交通典型站点周边的土地利用特征分析[J]. 城市发展研究, 2014, 21(4):66-71.
|
| [23] |
胡金晓, 朱明, 濮励杰, 等. 交通道路对区域土地利用变化的影响研究进展[J]. 长江流域资源与环境, 2018, 27(1):205-214.
|
| [24] |
丁建龙, 何霖. 广州地铁集团有限公司2017年年度报[R]. 广州: 广州地铁集团有限公司, 2018.
|
| [25] |
惠英. 城市轨道交通站点地区规划与建设研究[J]. 城市规划学刊, 2002, 8(2):30-33.
|
| [26] |
王志如, 张满银. 北京地铁网络时空演化特征评估及演化机制[J]. 经济地理, 2021, 41(4):1-9.
|
| [27] |
薛俊菲, 陈雯, 张蕾. 中国市域综合城市化水平测度与空间格局研究[J]. 经济地理, 2010, 30(12):2005-2011.
|
/
| 〈 |
|
〉 |