
Evolution and Differentiation of Coupling Coordination Between Technological Innovation and Green Development in Chinese Cities
Received date: 2020-07-30
Revised date: 2021-02-09
Online published: 2025-04-08
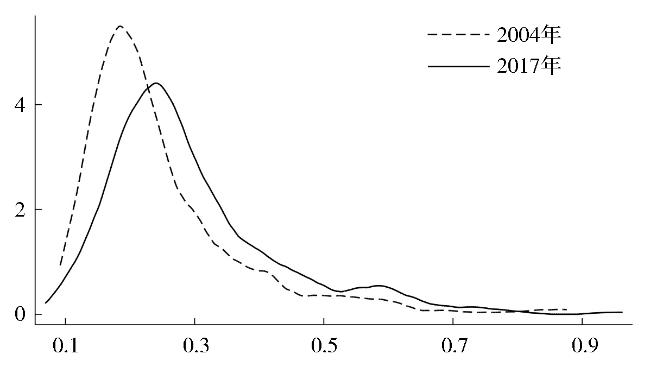
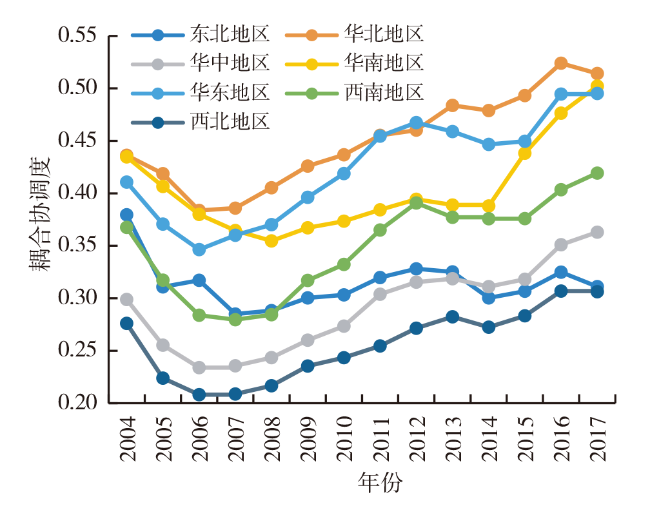
Based on the sample of 283 cities in China,this paper uses the coupling coordination model,Dagum Gini coefficient to reveal the spatial-temporal characteristics of the coupling coordination degree between technological innovation and green development in China,and its differential facts. Results show that: 1) Owing to the continuous improvement of technological innovation,the coupling coordination degree between technological innovation and green development of Chinese cities is slowly increasing annually. Northeast China,North China,South China,East China and Southwest China are areas with moderate coupling coordination,while Central China and Northwest China are areas with low coupling coordination. Only Northeast China shows a downward trend on the coupling coordination degree. The city size is positively correlated with the coupling coordination degree,and such relationship evinces great differences among different city sizes. 2) The difference of coupling coordination degree among regions accounts for 48.7% of the overall difference,especially the difference between East China,South China and Northwest,Southwest and Northeast China. The difference among different city sizes accounts for 84.18% of the total difference,whereas that within the same city size is small. This paper studies the coupling coordination between technological innovation and green development in Chinese cities from the perspective of system theory,whose conclusions provide policy support for the implementation of green development strategy of innovation driven economy.
HAN Yongnan , GE Pengfei , ZHOU Bole . Evolution and Differentiation of Coupling Coordination Between Technological Innovation and Green Development in Chinese Cities[J]. Economic geography, 2021 , 41(6) : 12 -19 . DOI: 10.15957/j.cnki.jjdl.2021.06.002
表1 指标体系Tab.1 Index system |
| 一级指标 | 二级指标 | 三级指标 | 指标说明 |
|---|---|---|---|
| 技术创新 | 创新投入 | 政府投入 | 政府科技拨款占财政支出比重 |
| 科研人员 | 高等学校专任教师数 | ||
| 创新产出 | 发明专利 | 发明专利数量 | |
| 外观专利 | 外观专利数量 | ||
| 实用新型专利 | 实用新型专利数量 | ||
| 创新环境 | 公共图书馆图书藏量 | 公共图书馆馆藏图书数量 | |
| 绿色发展 | 投入要素 | 资本要素 | 全社会固定资产投资总额 |
| 劳动力要素 | 年末单位从业人数 | ||
| 能源要素 | 供水总量、城市建成区面积、全社会用电量 | ||
| 期望产出 | 经济效益 | GDP(2005年不变价) | |
| 社会效益 | 城市职工平均工资、社会消费品零售总额 | ||
| 环境效益 | 城市绿地覆盖率、工业固体废物综合利用率、污水处理厂集中处理率、生活垃圾无害化处理率 | ||
| 非期望产出 | 环境污染 | 工业废水排放量、工业SO2排放量、工业烟尘排放量 |
表2 耦合协调度的整体时间演变Tab.2 Temporal evolution of the coupling coordination degree |
| 年份 | Uino | Ugd | Uino/Ugd | Dino_gd |
|---|---|---|---|---|
| 2004 | 0.1214 | 0.6606 | 0.1838 | 0.3919 |
| 2005 | 0.1133 | 0.4936 | 0.2296 | 0.3540 |
| 2006 | 0.0869 | 0.4742 | 0.1833 | 0.3310 |
| 2007 | 0.0996 | 0.4178 | 0.2383 | 0.3311 |
| 2008 | 0.1111 | 0.3908 | 0.2843 | 0.3376 |
| 2009 | 0.1228 | 0.4165 | 0.2949 | 0.3584 |
| 2010 | 0.1346 | 0.3971 | 0.3390 | 0.3724 |
| 2011 | 0.1462 | 0.4322 | 0.3383 | 0.3874 |
| 2012 | 0.1518 | 0.4384 | 0.3463 | 0.3987 |
| 2013 | 0.1559 | 0.4173 | 0.3736 | 0.4077 |
| 2014 | 0.1631 | 0.3465 | 0.4707 | 0.3881 |
| 2015 | 0.1755 | 0.3421 | 0.5130 | 0.4113 |
| 2016 | 0.2072 | 0.4017 | 0.5158 | 0.4326 |
| 2017 | 0.1952 | 0.4445 | 0.4394 | 0.4391 |
表3 耦合协调度的分城市规模特征Tab.3 Characteristics of the coupling coordination degree based on city scale |
| 年份 | 一线 | 新一线 | 二线 | 三线 | 四线 | 五线 |
|---|---|---|---|---|---|---|
| 2004 | 0.8010 | 0.5476 | 0.3887 | 0.2757 | 0.2147 | 0.1819 |
| 2005 | 0.7382 | 0.4757 | 0.3433 | 0.2379 | 0.1847 | 0.1512 |
| 2006 | 0.6912 | 0.4531 | 0.3153 | 0.2220 | 0.1748 | 0.1379 |
| 2007 | 0.6920 | 0.4378 | 0.3259 | 0.2281 | 0.1774 | 0.1393 |
| 2008 | 0.7041 | 0.4542 | 0.3409 | 0.2361 | 0.1804 | 0.1396 |
| 2009 | 0.7313 | 0.4900 | 0.3686 | 0.2478 | 0.1876 | 0.1461 |
| 2010 | 0.7538 | 0.5155 | 0.3919 | 0.2579 | 0.1932 | 0.1516 |
| 2011 | 0.7474 | 0.5656 | 0.4283 | 0.2868 | 0.2135 | 0.1694 |
| 2012 | 0.7387 | 0.5884 | 0.4431 | 0.2994 | 0.2261 | 0.1787 |
| 2013 | 0.7443 | 0.5778 | 0.4335 | 0.3001 | 0.2315 | 0.1806 |
| 2014 | 0.7271 | 0.5627 | 0.4214 | 0.2947 | 0.2235 | 0.1707 |
| 2015 | 0.7739 | 0.5587 | 0.4317 | 0.3037 | 0.2284 | 0.1737 |
| 2016 | 0.8008 | 0.6135 | 0.4757 | 0.3301 | 0.2514 | 0.1917 |
| 2017 | 0.7963 | 0.6122 | 0.4775 | 0.3368 | 0.2578 | 0.1971 |
| 平均值 | 0.7752 | 0.5431 | 0.4196 | 0.2901 | 0.2208 | 0.1710 |
注:一线城市为北京、上海、广州、深圳,新一线城市为成都、杭州、重庆、武汉、西安、苏州、天津、南京、长沙、郑州、东莞、青岛、沈阳、宁波、昆明,二线城市包括无锡等30个城市,三线城市包括汕头等70个城市,四线城市包括韶关等79个城市,五线城市包括防城港等85个城市。 |
表4 耦合协调度的区域差异性分析Tab.4 Regional difference analysis of the coupling coordination degree |
| 年份 | 2004 | 2006 | 2008 | 2010 | 2012 | 2014 | 2015 | 2016 | 2017 | |
|---|---|---|---|---|---|---|---|---|---|---|
| 区域内差距 | 总体 | 0.2502 | 0.2715 | 0.2783 | 0.2809 | 0.2578 | 0.2535 | 0.2506 | 0.2426 | 0.2386 |
| 东北 | 0.2124 | 0.2496 | 0.2443 | 0.2591 | 0.2416 | 0.2623 | 0.2586 | 0.2535 | 0.2436 | |
| 华北 | 0.2655 | 0.2774 | 0.2896 | 0.2770 | 0.2507 | 0.2773 | 0.2810 | 0.2709 | 0.2559 | |
| 华中 | 0.1835 | 0.1724 | 0.1881 | 0.1888 | 0.1777 | 0.1763 | 0.1673 | 0.1601 | 0.1528 | |
| 华南 | 0.3075 | 0.3492 | 0.3415 | 0.3606 | 0.2682 | 0.2480 | 0.2524 | 0.2247 | 0.2301 | |
| 华东 | 0.2333 | 0.2465 | 0.2508 | 0.2328 | 0.2086 | 0.1923 | 0.1835 | 0.1821 | 0.1792 | |
| 西南 | 0.2395 | 0.2741 | 0.2722 | 0.2667 | 0.2698 | 0.2332 | 0.2155 | 0.2153 | 0.2129 | |
| 西北 | 0.2378 | 0.2560 | 0.2505 | 0.2529 | 0.2277 | 0.2091 | 0.2129 | 0.1838 | 0.1832 | |
| 贡献率(%) | 区域内 | 16.06 | 16.01 | 16.06 | 15.60 | 15.23 | 14.77 | 14.48 | 14.47 | 14.38 |
| 区域间 | 23.17 | 26.16 | 30.99 | 36.62 | 41.03 | 43.81 | 45.33 | 47.10 | 48.70 | |
| 超变密度 | 60.77 | 57.83 | 52.95 | 47.78 | 43.73 | 41.41 | 40.19 | 38.43 | 36.92 |
注:区域间差距未列出,备索。表5同。 |
表5 耦合协调度的城市规模差异性分析Tab.5 Analysis of differences of the coupling coordination degree based on city size |
| 年份 | 2004 | 2006 | 2008 | 2010 | 2012 | 2014 | 2015 | 2016 | 2017 | |
|---|---|---|---|---|---|---|---|---|---|---|
| 区域内差距 | 总体 | 0.2502 | 0.2715 | 0.2783 | 0.2809 | 0.2578 | 0.2535 | 0.2506 | 0.2426 | 0.2386 |
| 一线城市 | 0.0676 | 0.0764 | 0.1323 | 0.1452 | 0.3182 | 0.3158 | 0.0895 | 0.2946 | 0.2878 | |
| 新一线城市 | 0.0874 | 0.1055 | 0.0711 | 0.0727 | 0.0659 | 0.1096 | 0.0970 | 0.0950 | 0.0756 | |
| 二线城市 | 0.1190 | 0.1281 | 0.1211 | 0.1191 | 0.1196 | 0.0999 | 0.0979 | 0.0962 | 0.0900 | |
| 三线城市 | 0.1507 | 0.1629 | 0.1707 | 0.1535 | 0.1373 | 0.1320 | 0.1274 | 0.1106 | 0.1103 | |
| 四线城市 | 0.1174 | 0.1441 | 0.1488 | 0.1414 | 0.1256 | 0.1222 | 0.1115 | 0.1004 | 0.0957 | |
| 五线城市 | 0.1402 | 0.1580 | 0.1614 | 0.1774 | 0.1430 | 0.1414 | 0.1370 | 0.1319 | 0.1350 | |
| 贡献率(%) | 规模内 | 11.18 | 11.55 | 11.51 | 11.11 | 10.83 | 10.79 | 10.26 | 9.85 | 9.89 |
| 规模间 | 80.19 | 79.71 | 80.40 | 82.15 | 81.14 | 81.56 | 85.23 | 84.10 | 84.18 | |
| 超变密度 | 8.64 | 8.74 | 8.09 | 6.74 | 8.02 | 7.66 | 4.51 | 6.05 | 5.93 |
| [1] |
|
| [2] |
|
| [3] |
|
| [4] |
|
| [5] |
|
| [6] |
胡东兰, 申颢, 刘自敏. 中国城市能源回弹效应的时空演变与形成机制研究[J]. 中国软科学, 2019(11):96-108.
|
| [7] |
|
| [8] |
|
| [9] |
|
| [10] |
|
| [11] |
|
| [12] |
彭绪庶. 绿色经济促进创新发展的机制与路径[J]. 经济纵横, 2017(9):56-61.
|
| [13] |
逯进, 周惠民. 中国省域人力资本与经济增长耦合关系的实证分析[J]. 数量经济技术经济研究, 2013, 30(9):3-19.
|
| [14] |
蒋天颖, 华明浩, 许强, 等. 区域创新与城市化耦合发展机制及其空间分异——以浙江省为例[J]. 经济地理, 2014, 34(6):25-32.
|
| [15] |
周亮, 车磊, 周成虎. 中国城市绿色发展效率时空演变特征及影响因素[J]. 地理学报, 2019, 74(10):2027-2044.
|
| [16] |
刘阳, 秦曼. 中国东部沿海四大城市群绿色效率的综合测度与比较[J]. 中国人口·资源与环境, 2019, 29(3):11-20.
|
| [17] |
廖重斌. 环境与经济协调发展的定量评判及其分类体系——以珠江三角洲城市群为例[J]. 热带地理, 1999(2):76-82.
|
| [18] |
唐晓华, 张欣珏, 李阳. 中国制造业与生产性服务业动态协调发展实证研究[J]. 经济研究, 2018, 53(3):79-93.
|
| [19] |
李琼, 赵阳, 李松林, 等. 中国社会保障与经济发展耦合的时空特征及驱动力分析[J]. 地理研究, 2020, 39(6):1401-1417.
|
| [20] |
葛鹏飞, 韩永楠, 武宵旭. 中国创新与经济发展的耦合协调性测度与评价[J]. 数量经济技术经济研究, 2020, 37(10):101-117.
|
| [21] |
|
| [22] |
|
/
| 〈 |
|
〉 |