
Evaluating the Impact of Housing Purchase Restriction Policy in Changsha City on Transaction Based on Regression Discontinuity Method
Received date: 2020-11-15
Revised date: 2021-08-08
Online published: 2025-04-01
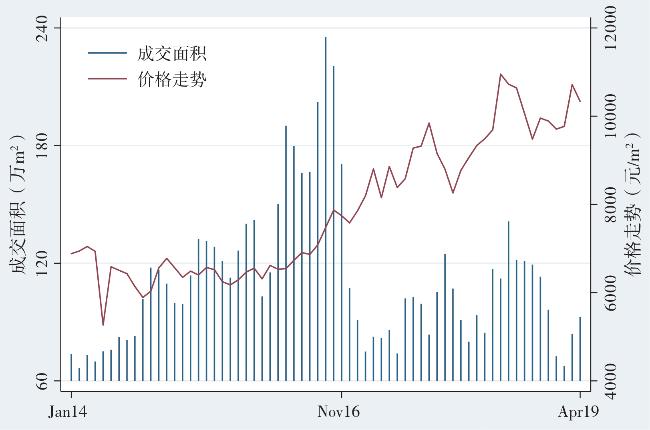
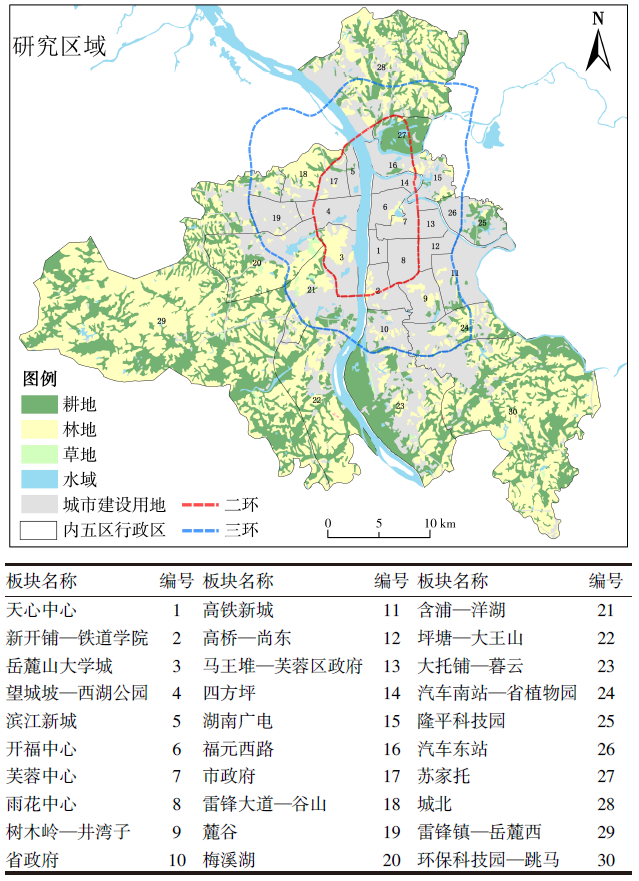
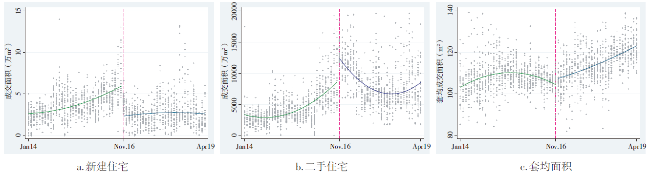
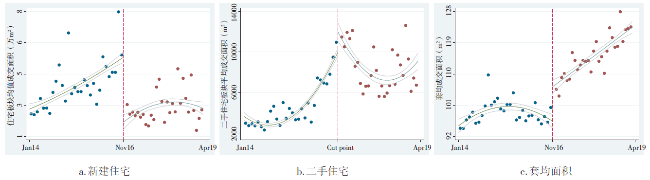
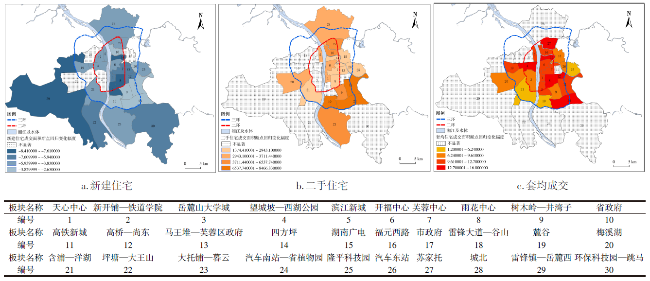
In response to the situation which the volume and price of real estate in multiple capital cities of mainland China has skyrocketed in 2016,the third round of China's purchase restriction regulation was launched in many places. The implementation of purchase restriction on the new-built housing that is targeted at the non-local households is a widely adopted,which is aimed at cooling the property market by forcibly reducing the transaction volume. This article takes Changsha as the research area and quantitatively evaluates the impact of housing purchase restriction policy on the market transaction volume of real estate applying the regression discontinuity model. It's found that,because of the restriction policy,the average monthly transaction volume of new-built housing in various sectors of Changsha drops by 55 000 m2,the average volume monthly transaction volume of second-hand houses increases by 6 300 m2. Average transaction area per household increased 10.55 m2. Transaction area of new-built housing reduced in the areas of city fringe and the old city after the purchase restriction policy,but transaction area of the second-hand houses and per household increased obviously in central city. Purchase restriction policy could reduce the transaction area of new-built housing and promote the demand of second-hand and large-area houses. The spatial pattern of residential transactions in Changsha shows a clear contraction trend after the policy. Residential purchase restriction is a temporary policy, and it is necessary to establish a long-term regulation mechanism to which the market will be subject.
HUANG Tuofu , HE Qingyun , ZHU Xiang . Evaluating the Impact of Housing Purchase Restriction Policy in Changsha City on Transaction Based on Regression Discontinuity Method[J]. Economic geography, 2021 , 41(9) : 79 -90 . DOI: 10.15957/j.cnki.jjdl.2021.09.009
表1 中国历年房地产宏观调控政策Tab.1 China's real estate macro-control policies |
| 实施时间 | 政策目的 | 主要控制手段 |
|---|---|---|
| 2003.06 | 央行发布“121号文”,敲定了房地产市场调控入手的大方向——住房供应、土地供应、信贷制度等方面 | 首次提出房地产为“国民经济的支柱产业”,并强调坚持住房市场化的基本方向。这被认为是房改以来的第一份楼市调控文件 |
| 2004.11 | 国土资源部发布“71号令”,土地出让制度的“831大限”由此而来 | 土地出让制度的“831大限”后,对房地产项目自有资金等做出规定 |
| 2005.03 | 国务院办公厅发布关于切实稳定住房价格的“国八条”以降温楼市 | “高度重视稳定住房价格”“大力调整住房供应结构,调整用地供应结构”等 |
| 2006.07 | 房贷政策全面收紧,加强住房保障建设并规定小户型供应比例 | “90/70”户型政策随着九部委的“十五条”出台。限制多套房贷款发放 |
| 2010.05 | 2010年初,国务院调控楼市的“新国十条”出台 | 对热点城市外地户籍人口和多套房购房的贷款发放给予限制 |
| 2010.09 | 9月“新国五条”出台 | 将房贷首付款比例调整到30%及以上,暂停三套房贷 |
| 2011.01 | “新国八条”出台,全国房市场过热的多个城市出台“限购令”,掀起第一轮“限购潮” | 限制购买新房。同时,新政将二套房的最低首付比例提升至60%,贷款利率调整至基准利率的1.1倍以上 |
| 2013.02 | “新国五条”出台五项加强房地产市场调控的政策措施 | 加大住宅用地供应,打压投资型购房需求,加大保障性住房建设力度 |
| 2016.07 | “房住不炒”指导思想,授予地方城市自主调控的权限,第二轮“限购潮”启动 | 各地根据实际情况限制购买,限制放贷,史上最严限制执行力度政策 |
表2 新建住宅成交面积全局多项式拟合结果Tab.2 Global polynomial fitting of transaction volume of new-built housing |
| 回归因子 | 因变量:新房成交面积(万m2) | |||||
|---|---|---|---|---|---|---|
| (1) | (2) | (3) | (4) | (5) | (6) | |
| 平均处理效应(Treat) | -1.722***(-14.859) | -1.830***(-15.928) | -4.144***(-23.075) | -4.422***(-21.740) | -3.613***(-11.991) | -4.786***(-13.742) |
| 常数项(Cons) | 5.892***(11.757) | 5.782***(11.527) | -3.434***(-4.575) | -7.191***(-8.956) | -7.902***(-5.604) | -2.451(-1.277) |
| 成交价格(Price) | 0.283***(6.266) | 0.301***(6.591) | 0.273***(5.654) | 0.218***(4.198) | 0.214***(4.135) | 0.216***(4.195) |
| 房地产投资额(Inv) | 0.179***(4.976) | 0.056(1.639) | 0.053(1.620) | 0.077**(2.341) | 0.059*(1.726) | 0.111***(3.099) |
| 房贷利率(M.rate) | -0.834***(-11.674) | -0.756***(-10.365) | 1.735***(12.075) | 2.895***(17.823) | 3.033***(11.469) | 2.062***(5.898) |
| 驱动变量(Date) | 0.218***(17.936) | 0.417***(16.682) | 0.350***(5.811) | 1.003***(6.884) | ||
| 交互效应(Interaction) | -0.305***(-15.378) | -0.765***(-17.378) | -0.992***(-14.997) | -1.679***(-9.266) | ||
| Region.FE | Y | Y | Y | Y | Y | Y |
| Cluster.SE | Y | Y | Y | Y | Y | Y |
| Season | N | Y | Y | Y | Y | Y |
| 二次项 | N | N | N | Y | Y | Y |
| 三次项 | N | N | N | N | Y | Y |
| 四次项 | N | N | N | N | N | Y |
| N | 1 920 | 1 920 | 1 920 | 1 920 | 1 920 | 1 920 |
| R2.a | 0.16 | 0.21 | 0.30 | 0.32 | 0.33 | 0.34 |
| AIC | 7 781.673 | 7 676.675 | 7 449.486 | 7 391.231 | 7 366.856 | 7 349.499 |
| BIC | 7 803.913 | 7 715.596 | 7 499.527 | 7 452.392 | 7 439.137 | 7 432.900 |
表3 二手住宅成交面积全局多项式拟合结果Tab.3 Global polynomial fitting of transaction volume of second-hand houses |
| 回归因子 | 因变量:二手房成交面积(m2) | |||||
|---|---|---|---|---|---|---|
| (1) | (2) | (3) | (4) | (5) | (6) | |
| 平均处理效应(Treat) | 3 456.94***(22.26) | 3 418.15***(22.78) | 5 045.31***(27.31) | 5 145.14***(19.05) | 6 317.50***(18.73) | 5 589.18***(13.66) |
| 常数项(Cons) | 10 112.84***(21.66) | 10 253.05***(21.77) | 9 175.80***(14.75) | -1 448.35**(-2.32) | -3 442.23**(-2.20) | -5 447.85**(-2.33) |
| 成交价格(Price) | 224.89***(6.02) | 258.22***(6.83) | 377.89***(15.21) | 405.60***(15.78) | 390.79***(13.71) | 356.57***(13.14) |
| 房地产投资额(Inv) | 123.65***(3.07) | 169.51***(4.26) | 222.86***(5.70) | 264.26***(6.74) | 244.08***(5.88) | 195.05***(4.01) |
| 房贷利率(M.rate) | -1 741.35***(-19.60) | -1 780.31***(-19.50) | -1 900.33***(-12.26) | 848.27***(5.66) | 1 261.00***(3.77) | 1 763.59***(3.82) |
| 驱动变量(Date) | -36.69**(-2.46) | 320.48***(10.55) | 192.57***(3.10) | 95.34(0.54) | ||
| 交互效应(Interaction) | -39.82(-1.52) | -1 067.05***(-19.05) | -1 344.55***(-18.03) | -559.43**(-2.16) | ||
| Region.FE | Y | Y | Y | Y | Y | Y |
| Cluster.SE | Y | Y | Y | Y | Y | Y |
| Season | N | Y | Y | Y | Y | Y |
| 二次项 | N | N | N | Y | Y | Y |
| 三次项 | N | N | N | N | Y | Y |
| 四次项 | N | N | N | N | N | Y |
| N | 1 920 | 1 920 | 1 920 | 1 920 | 1 920 | 1 920 |
| R2.a | 0.47 | 0.48 | 0.50 | 0.55 | 0.55 | 0.56 |
| AIC | 35 179.98 | 35 145.77 | 35 055.68 | 34 871.03 | 34 844.35 | 34 814.60 |
| BIC | 35 202.22 | 35 184.69 | 35 105.72 | 34 932.19 | 34 916.63 | 34 898.00 |
表4 新住宅套均成交面积全局多项式拟合结果Tab.4 Global polynomial fitting of average transaction volume per unit of new houses |
| 回归因子 | 因变量:套均成交面积(m2) | |||||
|---|---|---|---|---|---|---|
| (1) | (2) | (3) | (4) | (5) | (6) | |
| 平均处理效应(Treat) | 9.70***(7.76) | 9.63***(7.50) | 2.45*(1.73) | 10.34***(11.06) | 10.68***(8.29) | 10.45***(8.53) |
| 常数项(Cons) | 70.61***(18.54) | 70.88***(19.09) | 66.59***(7.82) | 60.87***(6.32) | 37.30**(2.18) | 33.52**(2.07) |
| 成交价格(Price) | 3.05***(6.59) | 3.09***(6.46) | 2.38***(3.88) | 2.83***(4.45) | 2.85***(4.45) | 2.83***(4.40) |
| 房地产投资额(Inv) | -0.18(-0.72) | -0.08(-0.28) | -0.24(-0.86) | -0.43(-1.54) | -0.26(-1.06) | -0.32(-1.29) |
| 房贷利率(M.rate) | 1.49***(-19.60) | 1.42***(-19.50) | 4.33***(-12.26) | 3.36**(5.66) | 8.17**(3.77) | 8.95***(3.82) |
| 驱动变量(Date) | 0.34***(3.20) | -0.91***(-10.14) | -1.65***(-3.38) | -1.97***(-3.70) | ||
| 交互效应(Interaction) | -0.14(-0.74) | 0.95***(4.00) | 2.07***(6.28) | 3.03***(4.37) | ||
| Region.FE | Y | Y | Y | Y | Y | Y |
| Cluster.SE | Y | Y | Y | Y | Y | Y |
| Season | N | Y | Y | Y | Y | Y |
| 二次项 | N | N | N | Y | Y | Y |
| 三次项 | N | N | N | N | Y | Y |
| 四次项 | N | N | N | N | N | Y |
| N | 1 920 | 1 920 | 1 920 | 1 920 | 1 920 | 1 920 |
| R2.a | 0.44 | 0.44 | 0.46 | 0.48 | 0.49 | 0.49 |
| AIC | 14 317.18 | 14 319.46 | 14 245.03 | 14 164.30 | 14 157.48 | 14 159.90 |
| BIC | 14 339.42 | 14 358.38 | 14 295.07 | 14 225.46 | 14 229.76 | 14 243.30 |
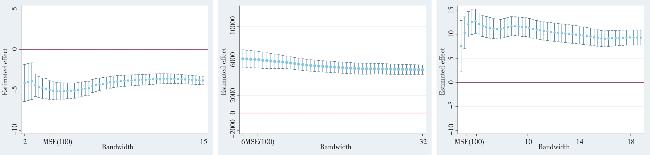
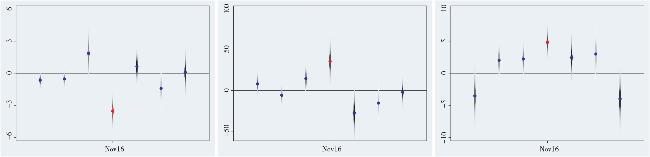
表5 局部线性回归结果Tab.5 Local linear regression of transaction volume |
| 因变量:新房成交面积(单位:万m2) | 因变量:二手房成交面积(单位:m2) | 因变量:套均成交面积(单位:m2) | ||||||||||||
|---|---|---|---|---|---|---|---|---|---|---|---|---|---|---|
| (1) | (2) | (3) | (4) | (5) | (6) | (7) | (8) | (9) | (10) | (11) | (12) | |||
| 最优带宽处理效应 | -5.19*** | -5.38*** | -5.30*** | -5.88*** | 6 089** * | 5 725*** | 6 237*** | 6 190*** | 11.08*** | 9.06*** | 10.55*** | 8.23*** | ||
| (-9.55) | (-9.21) | (-8.62) | (-8.89) | (12.73) | (13.33) | (13.71) | (14.73) | (9.30) | (7.27) | (8.33) | (5.65) | |||
| 0.5倍最优处理效应 | -4.14*** | -2.97*** | -3.60*** | -3.56*** | 6413*** | 5903*** | 6175*** | 5695*** | 29.01*** | 10.31*** | 27.51*** | 10.49*** | ||
| (-3.54) | (-2.97) | (-9.07) | (-7.32) | (9.61) | (8.94) | (9.21) | (8.48) | (3.06) | (6.37) | (2.88) | (6.45) | |||
| 2倍最优处理效应 | -3.82*** | -4.41*** | -3.64*** | -4.22*** | 5 227*** | 4 924*** | 4 903*** | 4 706*** | 11.37*** | 8.88*** | 11.59*** | 7.99*** | ||
| (-11.07) | (-11.85) | (-10.15) | (-10.84) | (15.89) | (17.71) | (15.41) | (16.91) | (11.17) | (9.09) | (11.09) | (7.60) | |||
| N | 1 920 | 1 920 | 1 920 | 1 920 | 1 920 | 1 920 | 1 920 | 1 920 | 1 920 | 1 920 | 1 920 | 1 920 | ||
| 最优带宽 | 4.97 | 4.97 | 3.90 | 3.90 | 10.76 | 10.76 | 8.45 | 8.45 | 5.61 | 5.61 | 4.40 | 4.40 | ||
| 0.5倍最优带宽 | 2.48 | 2.48 | 3.90 | 3.90 | 5.38 | 5.38 | 8.45 | 8.45 | 2.80 | 2.80 | 4.40 | 4.40 | ||
| 2倍最优带宽 | 9.94 | 9.94 | 15.61 | 15.61 | 21.52 | 21.52 | 33.80 | 33.80 | 11.21 | 11.21 | 17.62 | 17.62 | ||
| 协变量 | N | N | Y | Y | N | N | Y | Y | N | N | Y | Y | ||
| 核函数 | 三角核 | 矩形核 | 三角核 | 矩形核 | 三角核 | 矩形核 | 三角核 | 矩形核 | 三角核 | 矩形核 | 三角核 | 矩形核 | ||
| [1] |
|
| [2] |
|
| [3] |
|
| [4] |
|
| [5] |
|
| [6] |
|
| [7] |
|
| [8] |
|
| [9] |
孙翊, 马胜男, 韩钰, 等. 若干房地产行业宏观调控工具的模拟和比较——以北京和上海为例[J]. 经济地理, 2014, 34(8):23-32.
|
| [10] |
陈建东, 程树磊, 姚涛. 住房供求、地方政府行为与房地产市场调控有效性研究[J]. 经济理论与经济管理, 2014(9):72-84.
|
| [11] |
孟宪春, 张屹山, 李天宇. 有效调控房地产市场的最优宏观审慎政策与经济“脱虚向实”[J]. 中国工业经济, 2018(6):81-97.
|
| [12] |
张艾莲, 潘梦梦. “大水漫灌”还是“精准滴灌”:基于时—频域动态视角下房价调控机制研究[J]. 南方经济, 2020(6):1-18.
|
| [13] |
|
| [14] |
|
| [15] |
张小宇, 刘金全. 货币政策、产出冲击对房地产市场影响机制——基于经济发展新常态时期的分析[J]. 中国工业经济, 2015(12):20-35.
|
| [16] |
|
| [17] |
|
| [18] |
|
| [19] |
张德荣, 郑晓婷. “限购令”是抑制房价上涨的有效政策工具吗?[J]. 数量经济技术经济研究, 2013, 30(11):56-72.
|
| [20] |
|
| [21] |
|
| [22] |
张建同, 方陈承, 何芳. 上海市房地产限购限贷政策评估:基于断点回归设计的研究[J]. 科学决策, 2015(7):1-23.
|
| [23] |
廖奇云, 余建萍, 丁一方. 房地产限购政策的有效性评估研究——基于断点回归分析[J]. 建筑经济, 2018, 39(9):86-91.
|
| [24] |
|
| [25] |
|
| [26] |
|
| [27] |
乔坤元. 住房限购令真的起作用了吗?——来自中国70大中城市的证据[J]. 经济与管理研究, 2012(12):25-34.
|
| [28] |
|
| [29] |
|
| [30] |
|
| [31] |
邹琳华, 高波, 赵奉军. 投资需求扩张、房价上涨与住房限购——一个基于大国政策的准自然实验[J]. 城市发展研究, 2014, 21(6):53-58.
|
| [32] |
|
| [33] |
|
| [34] |
|
| [35] |
|
/
| 〈 |
|
〉 |