
Evolution Characteristics of Spatial Correlation Network of Inclusive Green Efficiency in China
Received date: 2020-09-30
Revised date: 2021-06-21
Online published: 2025-04-01
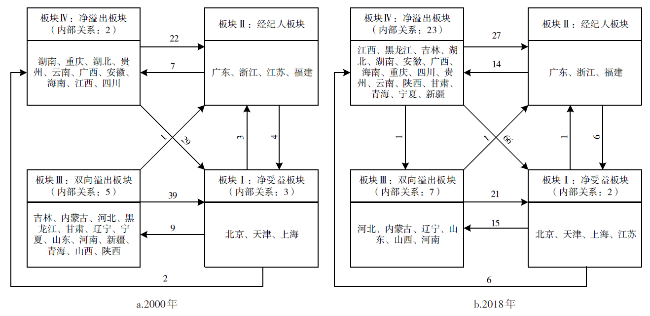
This article calculates the inclusive green efficiency of provincial units in China from 2000 to 2018 by using the Super-EBM model considering undesirable outputs. On this basis,the evolution characteristics of spatial correlation network structure of inclusive green efficiency in China are analyzed by using the modified gravity model and social network analysis method (SNA). The results show that: 1) From 2000 to 2018,inclusive green efficiency value in China declines at first and then increases,and the evolution trajectory is similar to the "V" character. The spatial distribution of inclusive green efficiency is unbalanced,and the highest value is in the eastern China,followed by the western,while the central region is in the low level. 2) The spatial correlation network of inclusive green efficiency in China presents the central-peripheral network structure form. Inclusive green efficiency has significant spatial spillover effect among provinces. The spillover effect is characterized by multiple super positions and the stability of the network is constantly enhanced. However,the hierarchical structure of the overall correlation network is relatively strict. 3) The provinces in northeast,northwest and southwest China have obvious spillover effect and belong to marginal actors. Beijing and Tianjin,Yangtze River Delta and Pearl River Delta which have significant "siphon effect",play the central actor in the correlation network and the functions of "intermediary" and "bridge". 4) Block model analysis shows that Beijing,Tianjin and the Yangtze River Delta region belong to the "net benefit" plate. The provinces in northwest,southwest and northeast are in the "net overflow" plate. Guangdong,Zhejiang and Fujian belong to the "brokers" plate,and the provinces in northeast and north China are in the "two-way overflow" plate.
ZHAO Lin , GAO Xiaotong , LIU Yanxu , HAN Zenglin . Evolution Characteristics of Spatial Correlation Network of Inclusive Green Efficiency in China[J]. Economic geography, 2021 , 41(9) : 69 -78 . DOI: 10.15957/j.cnki.jjdl.2021.09.008
表1 中国包容性绿色效率计算结果Tab.1 Measure result of inclusive green efficiency in China |
| 省区(地区) | 2000 | 2002 | 2004 | 2006 | 2008 | 2010 | 2012 | 2014 | 2016 | 2018 | 均值 |
|---|---|---|---|---|---|---|---|---|---|---|---|
| 北京 | 1.014 | 0.947 | 0.904 | 1.005 | 1.001 | 1.005 | 1.001 | 0.930 | 0.955 | 1.017 | 0.971 |
| 天津 | 1.015 | 1.002 | 1.005 | 0.969 | 0.891 | 0.841 | 0.834 | 0.882 | 0.940 | 1.001 | 0.934 |
| 河北 | 0.136 | 0.154 | 0.181 | 0.180 | 0.184 | 0.177 | 0.197 | 0.256 | 0.310 | 0.398 | 0.214 |
| 山西 | 0.478 | 0.305 | 0.248 | 0.264 | 0.289 | 0.311 | 0.364 | 0.439 | 0.537 | 0.667 | 0.380 |
| 内蒙古 | 0.657 | 0.442 | 0.327 | 0.327 | 0.340 | 0.368 | 0.423 | 0.436 | 0.473 | 0.549 | 0.423 |
| 辽宁 | 0.415 | 0.326 | 0.359 | 0.357 | 0.369 | 0.391 | 0.435 | 0.478 | 0.621 | 0.649 | 0.437 |
| 吉林 | 0.541 | 0.481 | 0.471 | 0.473 | 0.447 | 0.466 | 0.500 | 0.575 | 0.587 | 0.636 | 0.516 |
| 黑龙江 | 0.431 | 0.374 | 0.379 | 0.370 | 0.396 | 0.398 | 0.402 | 0.463 | 0.459 | 0.547 | 0.419 |
| 上海 | 0.831 | 0.728 | 0.757 | 0.769 | 0.754 | 0.707 | 1.006 | 0.818 | 0.851 | 0.881 | 0.803 |
| 江苏 | 0.209 | 0.190 | 0.216 | 0.274 | 0.297 | 0.348 | 0.436 | 0.577 | 0.659 | 0.746 | 0.394 |
| 浙江 | 0.216 | 0.221 | 0.264 | 0.304 | 0.342 | 0.375 | 0.442 | 0.642 | 0.899 | 1.003 | 0.465 |
| 安徽 | 0.109 | 0.072 | 0.084 | 0.084 | 0.112 | 0.152 | 0.195 | 0.214 | 0.237 | 0.379 | 0.157 |
| 福建 | 0.304 | 0.305 | 0.322 | 0.309 | 0.318 | 0.363 | 0.372 | 0.447 | 0.474 | 0.467 | 0.368 |
| 江西 | 0.337 | 0.209 | 0.191 | 0.190 | 0.225 | 0.181 | 0.255 | 0.323 | 0.374 | 0.367 | 0.257 |
| 山东 | 0.183 | 0.185 | 0.193 | 0.183 | 0.191 | 0.215 | 0.278 | 0.401 | 0.474 | 0.507 | 0.282 |
| 河南 | 0.118 | 0.115 | 0.107 | 0.115 | 0.115 | 0.128 | 0.162 | 0.247 | 0.307 | 0.427 | 0.178 |
| 湖北 | 0.196 | 0.150 | 0.182 | 0.213 | 0.233 | 0.249 | 0.303 | 0.359 | 0.417 | 0.580 | 0.277 |
| 湖南 | 0.182 | 0.178 | 0.186 | 0.200 | 0.205 | 0.206 | 0.217 | 0.244 | 0.260 | 0.326 | 0.218 |
| 广东 | 0.154 | 0.159 | 0.187 | 0.216 | 0.252 | 0.282 | 0.331 | 0.471 | 0.558 | 0.664 | 0.320 |
| 广西 | 0.077 | 0.093 | 0.091 | 0.112 | 0.134 | 0.156 | 0.178 | 0.227 | 0.270 | 0.335 | 0.165 |
| 海南 | 1.027 | 0.880 | 0.847 | 0.764 | 0.920 | 0.980 | 1.000 | 1.006 | 1.001 | 1.012 | 0.937 |
| 重庆 | 0.215 | 0.171 | 0.153 | 0.186 | 0.232 | 0.264 | 0.335 | 0.400 | 0.449 | 0.530 | 0.289 |
| 四川 | 0.112 | 0.097 | 0.108 | 0.130 | 0.162 | 0.212 | 0.274 | 0.315 | 0.363 | 0.446 | 0.219 |
| 贵州 | 0.037 | 0.026 | 0.042 | 0.071 | 0.092 | 0.122 | 0.168 | 0.232 | 0.295 | 0.336 | 0.139 |
| 云南 | 0.168 | 0.157 | 0.128 | 0.126 | 0.132 | 0.152 | 0.183 | 0.229 | 0.259 | 0.312 | 0.180 |
| 陕西 | 0.154 | 0.160 | 0.160 | 0.176 | 0.207 | 0.249 | 0.315 | 0.365 | 0.394 | 0.430 | 0.258 |
| 甘肃 | 0.179 | 0.133 | 0.140 | 0.158 | 0.186 | 0.202 | 0.259 | 0.327 | 0.365 | 0.458 | 0.237 |
| 青海 | 1.034 | 1.003 | 0.770 | 0.755 | 0.755 | 0.765 | 0.806 | 0.831 | 0.951 | 1.005 | 0.858 |
| 宁夏 | 0.762 | 0.609 | 0.605 | 0.549 | 0.590 | 0.647 | 0.715 | 0.746 | 0.887 | 1.012 | 0.701 |
| 新疆 | 0.493 | 0.398 | 0.441 | 0.440 | 0.432 | 0.456 | 0.471 | 0.499 | 0.483 | 0.493 | 0.453 |
| 全国 | 0.393 | 0.342 | 0.335 | 0.342 | 0.360 | 0.379 | 0.429 | 0.479 | 0.537 | 0.606 | 0.415 |
| 东部 | 0.500 | 0.463 | 0.476 | 0.485 | 0.502 | 0.517 | 0.576 | 0.628 | 0.704 | 0.759 | 0.557 |
| 中部 | 0.299 | 0.235 | 0.231 | 0.238 | 0.253 | 0.262 | 0.300 | 0.358 | 0.397 | 0.491 | 0.300 |
| 西部 | 0.353 | 0.299 | 0.270 | 0.276 | 0.296 | 0.327 | 0.375 | 0.419 | 0.472 | 0.537 | 0.356 |
表2 中国包容性绿色效率空间关联的网络中心性分析Tab.2 Network centrality analysis of spatial correlation of inclusive green efficiency in China |
| 省区 | 2000 | 2018 | |||||||||
|---|---|---|---|---|---|---|---|---|---|---|---|
| 度数中心度 | 接近中心度 | 中介中心度 | 度数中心度 | 接近中心度 | 中介中心度 | ||||||
| 点出度 | 点入度 | 中心度 | 点出度 | 点入度 | 中心度 | ||||||
| 北京 | 6 | 24 | 82.759 | 82.857 | 10.940 | 7 | 24 | 82.759 | 82.857 | 9.023 | |
| 天津 | 6 | 23 | 82.759 | 78.378 | 6.117 | 7 | 23 | 79.310 | 80.556 | 8.407 | |
| 河北 | 3 | 2 | 10.345 | 46.774 | 0.123 | 2 | 4 | 13.793 | 48.333 | 0.000 | |
| 山西 | 3 | 2 | 10.345 | 46.774 | 0.123 | 5 | 6 | 24.138 | 54.717 | 1.960 | |
| 内蒙古 | 3 | 2 | 10.345 | 46.774 | 0.123 | 5 | 2 | 17.241 | 46.774 | 0.669 | |
| 辽宁 | 4 | 1 | 13.793 | 3.567 | 0.000 | 4 | 2 | 13.793 | 46.774 | 1.357 | |
| 吉林 | 5 | 2 | 17.241 | 3.571 | 0.246 | 5 | 1 | 17.241 | 3.448 | 0.000 | |
| 黑龙江 | 4 | 1 | 13.793 | 3.567 | 0.000 | 6 | 1 | 20.690 | 3.448 | 0.062 | |
| 上海 | 5 | 28 | 96.552 | 96.667 | 14.717 | 6 | 25 | 86.207 | 85.294 | 17.096 | |
| 江苏 | 2 | 5 | 17.241 | 53.704 | 0.185 | 4 | 23 | 79.31 | 80.556 | 12.271 | |
| 浙江 | 1 | 9 | 31.034 | 58.000 | 0.000 | 4 | 16 | 58.621 | 67.442 | 4.215 | |
| 安徽 | 4 | 2 | 13.793 | 50.877 | 1.437 | 3 | 5 | 17.241 | 50.877 | 0.111 | |
| 福建 | 2 | 5 | 17.241 | 53.704 | 0.123 | 9 | 6 | 37.931 | 39.726 | 8.407 | |
| 江西 | 6 | 3 | 24.138 | 51.786 | 2.492 | 8 | 6 | 27.586 | 51.786 | 29.575 | |
| 山东 | 3 | 2 | 10.345 | 46.774 | 0.123 | 7 | 4 | 24.138 | 50.877 | 1.567 | |
| 河南 | 4 | 0 | 13.793 | 3.333 | 0.000 | 6 | 5 | 20.690 | 54.717 | 3.333 | |
| 湖北 | 4 | 0 | 13.793 | 3.333 | 0.000 | 7 | 5 | 31.034 | 50.877 | 0.720 | |
| 湖南 | 6 | 1 | 20.690 | 4.309 | 0.234 | 8 | 2 | 27.586 | 29.897 | 0.349 | |
| 广东 | 6 | 7 | 31.034 | 4.348 | 3.079 | 7 | 7 | 27.586 | 40.845 | 20.542 | |
| 广西 | 7 | 1 | 24.138 | 4.309 | 0.234 | 9 | 3 | 31.034 | 30.208 | 8.732 | |
| 海南 | 4 | 2 | 17.241 | 4.315 | 0.172 | 8 | 3 | 27.586 | 30.208 | 0.308 | |
| 重庆 | 4 | 2 | 17.241 | 4.315 | 0.172 | 8 | 5 | 31.034 | 28.155 | 17.469 | |
| 四川 | 5 | 0 | 17.241 | 3.333 | 0.000 | 7 | 1 | 24.138 | 22.137 | 0.194 | |
| 贵州 | 8 | 0 | 27.586 | 3.333 | 0.000 | 8 | 2 | 27.586 | 31.522 | 4.160 | |
| 云南 | 5 | 0 | 17.241 | 3.333 | 0.000 | 8 | 2 | 27.586 | 31.522 | 4.160 | |
| 陕西 | 3 | 0 | 10.345 | 3.333 | 0.000 | 7 | 1 | 24.138 | 18.954 | 0.031 | |
| 甘肃 | 4 | 0 | 13.793 | 3.333 | 0.000 | 9 | 4 | 31.034 | 23.200 | 11.909 | |
| 青海 | 3 | 1 | 13.793 | 3.448 | 0.000 | 6 | 1 | 20.690 | 18.954 | 0.000 | |
| 宁夏 | 3 | 1 | 10.345 | 46.032 | 0.123 | 5 | 1 | 17.241 | 18.954 | 0.000 | |
| 新疆 | 3 | 0 | 10.345 | 3.333 | 0.000 | 5 | 0 | 17.241 | 3.333 | 0.000 | |
| 均值 | 4.200 | 4.200 | 23.678 | 27.384 | 1.359 | 6.333 | 6.333 | 32.873 | 40.898 | 5.554 | |
表3 中国包容性绿色效率空间关联板块的溢出效应Tab.3 The spillover effect of spatial correlation plate of inclusive green efficiency in China |
| 板块类型 | 接收关系数合计(个) | 溢出关系数合计(个) | 期望内部关系比例(%) | 实际内部关系比例(%) | |||
|---|---|---|---|---|---|---|---|
| 板块内 | 板块外 | 板块内 | 板块外 | ||||
| 板块Ⅰ | 3/2 | 72/93 | 3/2 | 14/22 | 6.890/10.345 | 17.647/8.333 | |
| 板块Ⅱ | 0/0 | 26/29 | 0/0 | 11/20 | 10.345/6.897 | 0.000/0.000 | |
| 板块Ⅲ | 5/7 | 9/16 | 5/7 | 40/22 | 41.379/17.241 | 11.111/24.138 | |
| 板块Ⅳ | 2/23 | 9/20 | 2/23 | 51/94 | 31.034/55.172 | 3.774/19.658 | |
注:分子和分母分别表示2000和2018年数据。 |
表4 中国包容性绿色效率空间关联板块的密度矩阵和像矩阵Tab.4 The density matrix and image matrix of spatial correlation plate of inclusive green efficiency in China |
| 板块类型 | 密度矩阵 | 像矩阵 | |||||||
|---|---|---|---|---|---|---|---|---|---|
| 板块Ⅰ | 板块Ⅱ | 板块Ⅲ | 板块Ⅳ | 板块Ⅰ | 板块Ⅱ | 板块Ⅲ | 板块Ⅳ | ||
| 板块Ⅰ | 0.500/0.167 | 0.250/0.083 | 0.231/0.625 | 0.067/0.088 | 1/0 | 1/0 | 1/1 | 0/0 | |
| 板块Ⅱ | 0.333/0.500 | 0.000/0.000 | 0.000/0.000 | 0.175/0.275 | 1/1 | 0/0 | 0/0 | 1/1 | |
| 板块Ⅲ | 1.000/0.875 | 0.019/0.056 | 0.032/0.233 | 0.000/0.000 | 1/1 | 0/0 | 0/1 | 0/0 | |
| 板块Ⅳ | 0.967/0.971 | 0.550/0.529 | 0.000/0.010 | 0.022/0.085 | 1/1 | 1/1 | 0/0 | 0/0 | |
注:分子和分母分别表示2000和2018年数据。 |
| [1] |
邓祥征, 金贵, 何书金, 等. 发展地理学研究进展与展望[J]. 地理学报, 2020, 75(2):226-239.
|
| [2] |
任嘉敏, 马延吉. 地理学视角下绿色发展研究进展与展望[J]. 地理科学进展, 2020, 39(7):1196-1209.
|
| [3] |
刘华军, 贾文星. 中国区域经济增长的空间网络关联及收敛性检验[J]. 地理科学, 2019, 39(5):726-733.
|
| [4] |
|
| [5] |
|
| [6] |
|
| [7] |
|
| [8] |
|
| [9] |
周小亮. 包容性绿色发展:理论阐释与制度支撑体系[J]. 学术月刊, 2020, 52(11):41-54.
|
| [10] |
|
| [11] |
徐强, 陶侃. 基于广义Bonferroni曲线的中国包容性增长测度及其影响因素分析[J]. 数量经济技术经济研究, 2017(12):93-109.
|
| [12] |
|
| [13] |
陈红蕾, 覃伟芳. 中国经济的包容性增长:基于包容性全要素生产率视角的解释[J]. 中国工业经济, 2014(1):18-30.
|
| [14] |
程钰, 王晶晶, 王亚平, 等. 中国绿色发展时空演变轨迹与影响机理研究[J]. 地理研究, 2019, 38(11):2745-2765.
|
| [15] |
|
| [16] |
周亮, 车磊, 周成虎. 中国城市绿色发展效率时空演变特征及影响因素[J]. 地理学报, 2019, 74(10):2027-2044.
|
| [17] |
|
| [18] |
|
| [19] |
周小亮, 吴武林. 中国包容性绿色增长的测度及分析[J]. 数量经济技术经济研究, 2018, 35(8):3-20.
|
| [20] |
吴武林, 周小亮. 中国包容性绿色增长绩效评价体系的构建及应用[J]. 中国管理科学, 2019, 27(9):183-194.
|
| [21] |
杨雪星. 包容性绿色经济增长指数构建与实证研究——基于G20国家数据[J]. 福建论坛:人文社会科学版, 2014(6):42-48.
|
| [22] |
王宇昕, 余兴厚, 黄玲. 长江经济带包容性绿色增长的测度与区域差异分析[J]. 贵州财经大学学报, 2019, 20(3):89-98.
|
| [23] |
徐盈之, 王书斌, 魏莎. 碳排放约束下中国包容性增长效率研究[J]. 中国科技论坛, 2015(7):100-105.
|
| [24] |
赵林, 刘焱序, 曹乃刚, 等. 中国包容性绿色效率时空格局与溢出效应分析[J]. 地理科学进展, 2021, 40(3):382-396.
|
| [25] |
李政大, 刘坤. 中国绿色包容性发展图谱及影响机制分析[J]. 西安交通大学学报:社会科学版, 2018, 38(1):48-59.
|
| [26] |
|
| [27] |
邸玉娜. 中国实现包容性发展的内涵、测度与战略[J]. 经济问题探索, 2016(2):16-27.
|
| [28] |
郭苏文. 经济包容性增长水平的测度与评价——基于省级层面数据[J]. 工业技术经济, 2015(1):100-107.
|
| [29] |
范建双, 虞晓芬, 周琳. 城镇化、城乡差距与中国经济的包容性增长[J]. 数量经济技术经济研究, 2018(4):41-60.
|
| [30] |
|
| [31] |
车磊, 白永平, 周亮, 等. 中国绿色发展效率的空间特征及溢出分析[J]. 地理科学, 2018, 38(11):1788-1798.
|
| [32] |
吴志才, 张凌媛, 黄诗卉. 粤港澳大湾区旅游经济联系的空间结构及协同合作模式[J]. 地理研究, 2020, 39(6):1370-1385.
|
| [33] |
王圣云, 宋雅宁, 张玉, 等. 交通运输成本视角下长江中游城市群城市网络空间关联机制[J]. 经济地理, 2020, 40(6):87-97.
|
| [34] |
|
| [35] |
孙才志, 马奇飞. 中国省际水资源绿色效率空间关联网络研究[J]. 地理研究, 2020, 39(1):53-63.
|
| [36] |
|
| [37] |
|
| [38] |
|
| [39] |
刘佳, 宋秋月. 中国旅游产业绿色创新效率的空间网络结构与形成机制[J]. 中国人口·资源与环境, 2018, 28(8):127-137.
|
| [40] |
李琳, 牛婷玉. 基于SNA的区域创新产出空间关联网络结构演变[J]. 经济地理, 2017, 37(9):19-25.
|
| [41] |
刘军. 整体网分析——UCINET 软件实用指南(第二版)[M]. 上海: 格致出版社, 2014.
|
| [42] |
张鹏, 于伟. 基于社会网络分析的我国绿色全要素生产率增长空间特征及其动因研究[J]. 经济问题探索, 2017(2):39-46.
|
| [43] |
刘小瑜, 余海华. 中国省际绿色发展的空间关联及溢出效应[J]. 江西财经大学学报, 2020(3):14-24.
|
/
| 〈 |
|
〉 |


