
Spatial-Temporal Evolution of the Livability Levels in the Yangtze River Delta Urban Agglomerations and Its Influencing Factors
Received date: 2019-03-05
Revised date: 2019-07-28
Online published: 2025-04-01
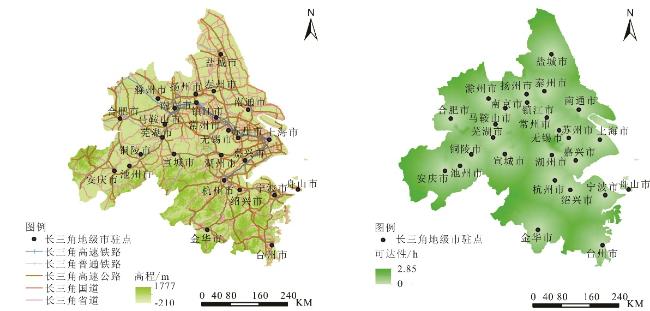
Under the background of new urbanization and ecological civilization construction, the city's livability levels has become a hot issue of concern. Based on the spatial database of livable elements in the Yangtze River Delta urban agglomerations from 2004 to 2017. The entropy method and Moran's I index are used to explore the temporal and spatial evolution characteristics of urban livability in the Yangtze River Delta urban agglomerations, and then the panel data model is used to analyze the influencing factors of its livability levels evolution. The study found that:1)From the perspective of the evolution of livability levels, the order of livability in the Yangtze River Delta urban agglomerations has changed significantly, and the cities in the middle and low levels have improved rapidly, and the gap between cities has been shrinking.2)From the perspective of the spatial evolution of livable level, the livable level of cities in the Yangtze River Delta is uneven and the spatial correlation is weak.3)There are significant differences between the livable level of each city under the single standard level and the comprehensive standard level. Each city under the single standard level has its advantages and disadvantages.4)The advantages and disadvantages of natural geographical environment and location have a direct impact on the construction of livable cities. In terms of social economy, the per capita investment in the maintenance and construction of municipal facilities, the per capita investment in the development of residential real estate, the balance of household savings at the end of the year and population density are positively related to the livable level of cities, while the industrial SO2 emissions are negatively related to the livable level of cities.
GUO Zheng , YAO Shimou , CHEN Shuang , WU Wei , LIU Weichen . Spatial-Temporal Evolution of the Livability Levels in the Yangtze River Delta Urban Agglomerations and Its Influencing Factors[J]. Economic geography, 2020 , 40(2) : 79 -88 . DOI: 10.15957/j.cnki.jjdl.2020.02.009
表1 长三角城市群城市宜居水平评价指标体系Tab.1 Evaluation index system of livability levels in the Yangtze River Delta urban agglomerations |
| 标准层 | 指标层 | 2004权重 | 2008权重 | 2012权重 | 2017权重 |
|---|---|---|---|---|---|
| 经济富裕度 | 人均GDP/元 | 0.0310 | 0.0333 | 0.0305 | 0.0333 |
| 第三产业占GDP比重/% | 0.0192 | 0.0241 | 0.0171 | 0.0117 | |
| 人均公共财政收入/元 | 0.0297 | 0.0364 | 0.0342 | 0.0333 | |
| 人均固定资产投资总额/元 | 0.0318 | 0.0339 | 0.0296 | 0.0332 | |
| 人均科学技术财政支出/元 | 0.0273 | 0.0354 | 0.0383 | 0.0466 | |
| 人均教育财政支出/元 | 0.0287 | 0.0325 | 0.0282 | 0.0307 | |
| 城镇居民人均可支配收入/元 | 0.0335 | 0.0404 | 0.0373 | 0.0401 | |
| 人均社会消费品零售额/元 | 0.0294 | 0.0462 | 0.0428 | 0.0325 | |
| 在岗职工平均工资/元 | 0.0533 | 0.0277 | 0.0250 | 0.0325 | |
| 环境优美度 | 人均绿地面积/m2 | 0.0264 | 0.0214 | 0.0268 | 0.0250 |
| 建成区绿化覆盖率/% | 0.0234 | 0.0197 | 0.0295 | 0.0324 | |
| 一般工业固体废物综合利用率/% | 0.0241 | 0.0216 | 0.0369 | 0.0340 | |
| 污水处理厂集中处理率/% | 0.0258 | 0.0217 | 0.0338 | 0.0326 | |
| 生活垃圾无害化处理率/% | 0.0456 | 0.0198 | 0.0225 | 0.0186 | |
| 空气质量优良率/% | 0.0194 | 0.0213 | 0.0225 | 0.0206 | |
| 年均降水量/mm | 0.0218 | 0.0199 | 0.0187 | 0.0199 | |
| 安全保障度 | 城市职工基本养老保险参保人数/人 | 0.0301 | 0.0478 | 0.0337 | 0.0351 |
| 城镇职工基本医疗保险参保人数/人 | 0.0452 | 0.0376 | 0.0323 | 0.0362 | |
| 失业保险参保人数/人 | 0.0369 | 0.0413 | 0.0342 | 0.0169 | |
| 城镇登记失业人数/人 | 0.0312 | 0.0341 | 0.0296 | 0.0169 | |
| 刑事案件数/件 | 0.0205 | 0.0215 | 0.0192 | 0.0234 | |
| 交通事故死亡人数/人 | 0.0220 | 0.0210 | 0.0233 | 0.0191 | |
| 生活便利度 | 万人拥有公共汽车数量/辆 | 0.0329 | 0.0335 | 0.0362 | 0.0283 |
| 万人拥有出租车数量/辆 | 0.0446 | 0.0422 | 0.0314 | 0.0330 | |
| 人均城市道路面积/m2 | 0.0318 | 0.0336 | 0.0476 | 0.0299 | |
| 城市燃气普及率/% | 0.0192 | 0.0189 | 0.0253 | 0.0339 | |
| 建成区排水管道密度 | 0.0433 | 0.0305 | 0.0247 | 0.0229 | |
| 通讯指数* | 0.0198 | 0.0255 | 0.0340 | 0.0283 | |
| 万人拥有医院、卫生院床位数/张 | 0.0400 | 0.0336 | 0.0317 | 0.0337 | |
| 每百人公共图书馆藏书/册 | 0.0316 | 0.0343 | 0.0330 | 0.0364 | |
| 学校数量/所 | 0.0346 | 0.0349 | 0.0301 | 0.0350 | |
| 人均住房建筑面积/m2 | 0.0243 | 0.0263 | 0.0355 | 0.0399 | |
| 就业人口中批发零售业、住宿 餐饮业及居民服务业就业比重/% | 0.0216 | 0.0279 | 0.0245 | 0.0250 |
注:“*”指年末固定电话与互联网宽带使用户数和移动电话使用人数之和比上年末总人口。 |
表2 2004、2008、2012、2017年长三角城市群城市宜居水平综合得分Tab.2 Comprehensive scores of livability levels in the Yangtze River Delta urban agglomerations in 2004, 2008, 2012 and 2017 |
| 序号 | 2004年 | 2008年 | 2012年 | 2017年 | |||||||
|---|---|---|---|---|---|---|---|---|---|---|---|
| 综合得分 | 城位序 | 综合得分 | 城位序 | 综合得分 | 城位序 | 综合得分 | 城位序 | ||||
| 1 | 0.0533 | 上海 | 0.0547 | 上海 | 0.0529 | 上海 | 0.0513 | 上海 | |||
| 2 | 0.0430 | 宁波 | 0.0441 | 杭州 | 0.0434 | 杭州 | 0.0430 | 杭州 | |||
| 3 | 0.0429 | 杭州 | 0.0435 | 宁波 | 0.0432 | 宁波 | 0.0426 | 南京 | |||
| 4 | 0.0429 | 南京 | 0.0432 | 南京 | 0.0423 | 南京 | 0.0419 | 苏州 | |||
| 5 | 0.0420 | 无锡 | 0.0429 | 无锡 | 0.0422 | 无锡 | 0.0418 | 合肥 | |||
| 6 | 0.0409 | 合肥 | 0.0421 | 苏州 | 0.0422 | 苏州 | 0.0413 | 宁波 | |||
| 7 | 0.0403 | 绍兴 | 0.0407 | 合肥 | 0.0422 | 合肥 | 0.0411 | 无锡 | |||
| 8 | 0.0402 | 苏州 | 0.0391 | 绍兴 | 0.0404 | 绍兴 | 0.0386 | 镇江 | |||
| 9 | 0.0396 | 常州 | 0.0386 | 常州 | 0.0390 | 常州 | 0.0385 | 嘉兴 | |||
| 10 | 0.0395 | 马鞍山 | 0.0382 | 南通 | 0.0381 | 镇江 | 0.0384 | 常州 | |||
| 11 | 0.0377 | 扬州 | 0.0378 | 马鞍山 | 0.0380 | 嘉兴 | 0.0379 | 芜湖 | |||
| 12 | 0.0374 | 南通 | 0.0375 | 嘉兴 | 0.0380 | 马鞍山 | 0.0378 | 马鞍山 | |||
| 13 | 0.0373 | 镇江 | 0.0373 | 镇江 | 0.0373 | 芜湖 | 0.0378 | 南通 | |||
| 14 | 0.0372 | 嘉兴 | 0.0372 | 芜湖 | 0.0372 | 南通 | 0.0376 | 铜陵 | |||
| 15 | 0.0371 | 芜湖 | 0.0370 | 扬州 | 0.0370 | 湖州 | 0.0374 | 金华 | |||
| 16 | 0.0369 | 铜陵 | 0.0369 | 舟山 | 0.0368 | 铜陵 | 0.0374 | 绍兴 | |||
| 17 | 0.0367 | 安庆 | 0.0367 | 铜陵 | 0.0366 | 舟山 | 0.0372 | 湖州 | |||
| 18 | 0.0367 | 泰州 | 0.0365 | 金华 | 0.0366 | 滁州 | 0.0372 | 舟山 | |||
| 19 | 0.0363 | 金华 | 0.0363 | 台州 | 0.0365 | 台州 | 0.0371 | 滁州 | |||
| 20 | 0.0362 | 湖州 | 0.0361 | 湖州 | 0.0363 | 泰州 | 0.0369 | 台州 | |||
| 21 | 0.0360 | 舟山 | 0.0355 | 泰州 | 0.0360 | 金华 | 0.0362 | 安庆 | |||
| 22 | 0.0356 | 盐城 | 0.0354 | 安庆 | 0.0358 | 扬州 | 0.0361 | 扬州 | |||
| 23 | 0.0358 | 台州 | 0.0340 | 滁州 | 0.0347 | 安庆 | 0.0353 | 泰州 | |||
| 24 | 0.0339 | 滁州 | 0.0334 | 盐城 | 0.0331 | 盐城 | 0.0343 | 盐城 | |||
| 25 | 0.0323 | 宣城 | 0.0327 | 宣城 | 0.0322 | 池州 | 0.0333 | 池州 | |||
| 26 | 0.0317 | 池州 | 0.0326 | 池州 | 0.0321 | 宣城 | 0.0322 | 宣城 | |||
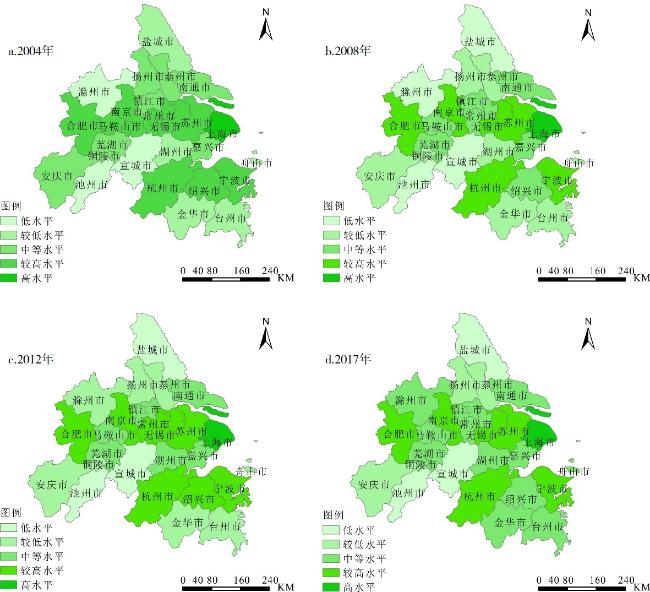
表3 2004、2008、2012、2017年长三角城市群城市宜居水平空间变化Tab.3 Spatial changes of livability levels in the Yangtze River Delta urban agglomerations in 2004, 2008, 2012 and 2017 |
| 宜居水平 | 2004年 | 2008年 | 2012年 | 2017年 |
|---|---|---|---|---|
| 低 | 滁州、池州、宣城 | 盐城、滁州、池州、宣城 | 盐城、池州、宣城 | 盐城、池州、宣城 |
| 较低 | 金华、台州、湖州、舟山、盐城 | 金华、台州、湖州、泰州、 扬州、安庆、舟山 | 金华、台州、泰州、扬州、 滁州、铜陵、安庆舟山 | 扬州、泰州、安庆、舟山 |
| 中等 | 嘉兴、南通、泰州、扬州、芜湖、 铜陵、安庆 | 绍兴、嘉兴、南通、常州、 镇江、马鞍山、芜湖 | 湖州、嘉兴、南通、镇江、 马鞍山、芜湖 | 金华、台州、绍兴、湖州、嘉兴、常州、 镇江、南通、滁州、马鞍山、芜湖、铜陵 |
| 较高 | 杭州、绍兴、宁波、苏州、无锡、 常州、南京、马鞍山、合肥 | 杭州、宁波、苏州、无锡、 南京、合肥 | 杭州、绍兴、宁波、苏州、 无锡、常州、南京、合肥 | 杭州、宁波、苏州、无锡、南京、合肥 |
| 高 | 上海 | 上海 | 上海 | 上海 |
表4 长三角城市群城市宜居水平的全局Moran's I指数值Tab.4 Global Moran's I index for the livability levels in the Yangtze River Delta urban agglomerations |
| 年份 | Moran's I | 预期指数 | 标准差 | Z值 |
|---|---|---|---|---|
| 2004 | 0.0084 | -0.0400 | 0.1393 | 2.5739 |
| 2008 | 0.0318 | -0.0400 | 0.1427 | 2.3266 |
| 2012 | 0.0886 | -0.0400 | 0.1520 | 2.3556 |
| 2017 | 0.0791 | -0.0400 | 0.1456 | 2.1324 |
表5 2004、2017年长三角城市群城市在单一标准层和综合标准层下宜居水平排名Tab.5 Ranking of livable levels in the Yangtze River Delta urban agglomerations under single criteria level and comprehensive criteria level in 2004 and 2017 |
| 名次 | 2004 | 2017 | |||||||||
|---|---|---|---|---|---|---|---|---|---|---|---|
| 经济富裕度 | 环境优美度 | 生活便利度 | 安全保障度 | 综合水平 | 经济富裕度 | 环境优美度 | 生活便利度 | 安全保障度 | 综合水平 | ||
| 1 | 上海 | 南京 | 上海 | 上海 | 上海 | 上海 | 杭州 | 上海 | 上海 | 上海 | |
| 2 | 宁波 | 杭州 | 杭州 | 宁波 | 宁波 | 杭州 | 苏州 | 合肥 | 杭州 | 杭州 | |
| 3 | 杭州 | 苏州 | 南京 | 杭州 | 杭州 | 苏州 | 南京 | 苏州 | 南京 | 南京 | |
| 4 | 无锡 | 无锡 | 合肥 | 南京 | 南京 | 南京 | 嘉兴 | 南京 | 苏州 | 苏州 | |
| 5 | 南京 | 常州 | 无锡 | 苏州 | 无锡 | 合肥 | 舟山 | 杭州 | 合肥 | 合肥 | |
| 6 | 苏州 | 舟山 | 绍兴 | 无锡 | 合肥 | 宁波 | 绍兴 | 无锡 | 宁波 | 宁波 | |
| 7 | 绍兴 | 上海 | 宁波 | 常州 | 绍兴 | 无锡 | 安庆 | 宁波 | 无锡 | 无锡 | |
| 8 | 常州 | 台州 | 苏州 | 马鞍山 | 苏州 | 常州 | 台州 | 镇江 | 常州 | 镇江 | |
| 9 | 南通 | 合肥 | 常州 | 合肥 | 常州 | 绍兴 | 湖州 | 嘉兴 | 绍兴 | 嘉兴 | |
| 10 | 合肥 | 安庆 | 芜湖 | 舟山 | 马鞍山 | 镇江 | 上海 | 金华 | 嘉兴 | 常州 | |
表6 模型设定检验结果Tab. 6 model setting test results |
| 检验方法 | 原假设 | 统计量 | P值 | 检验结论 |
|---|---|---|---|---|
| F检验 | 混合模型 | 228.7739 | 0.0000 | 固定效应模型 |
| Hausman检验 | 随机效应模型 | 23.7367 | 0.0002 | 固定效应模型 |
表7 固定效应模型的整体估计量Tab.7 Overall estimation of fixed effects model |
| F统计量 | 77.5282 | R2 | 0.7695 |
|---|---|---|---|
| P值 | 0.0000 | 调整R2 | 0.7571 |
表8 固定效应模型估计结果Tab.8 Fixed effect model estimation results |
| 变量 | 系数 | 标准误差 | T统计量 |
|---|---|---|---|
| C | -3.8182*** | 0.1309 | -29.1688 |
| lnJs | 0.1040*** | 0.0220 | 4.7272 |
| lnKf | 0.1321* | 0.0750 | 1.7613 |
| lnYe | 0.1902** | 0.0824 | 2.3083 |
| lnMd | 0.0331*** | 0.0090 | 3.6778 |
| lnSO2 | -0.0165*** | 0.0059 | -2.7966 |
注:*、**、***分别表示0.1、0.05和0.01的显著性水平。 |
| [1] |
艾比尼泽∙霍华德. 明日的田园城市[M]. 北京: 商务印书馆, 2002.
|
| [2] |
日笠端. 都市规划(日文)[M]. 东京: 共立出版,1977.
|
| [3] |
谌丽, 张文忠, 李业锦. 大连居民的城市宜居性评价[J]. 地理学报, 2008(10): 1 022-1 032.
|
| [4] |
|
| [5] |
|
| [6] |
Hannah Basland,Carolyn Whitman, Melanie Lowe, et al. Urban livability:Emerging lessons from Australia for exploring the potential for indicators to measure the social determinants of health[J]. Social Science & Medicine, 2014(111):64-73.
|
| [7] |
|
| [8] |
|
| [9] |
吴良镛. 人居环境科学导论[M]. 北京: 中国建筑工业出版社, 2001.
|
| [10] |
宁越敏, 查志强. 大都市人居环境评价和优化研究——以上海市为例[J]. 城市规划, 1999(6):14-19,63.
|
| [11] |
张文忠, 谌丽, 杨翌朝. 人居环境演变研究进展[J]. 地理科学进展, 2013, 32(5):710-721.
|
| [12] |
湛东升, 张文忠, 余建辉, 等. 基于客观评价的北京城市宜居性空间特征及机制[J]. 地域研究与开发, 2016, 35(4):68-73,98.
|
| [13] |
吴箐, 程金屏, 钟式玉, 等. 基于不同主体的城镇人居环境要素需求特征——以广州市新塘镇为例[J]. 地理研究, 2013, 32(2):307-316.
|
| [14] |
张延伟, 裴颖, 葛全胜. 基于BDI决策的居住空间宜居性分析——以大连沙河口区为例[J]. 地理研究, 2016, 35(12):2 227-2 237.
|
| [15] |
宋戈, 王盼盼. 松嫩高平原县域土地利用空间格局地形梯度特征分析——以巴彦县为例[J]. 地理科学, 2017, 37(8):1 218-1 225.
|
| [16] |
王玉明, 王瑞康. 城市化时期郊区土地利用结构信息熵上升的原因[J]. 地理学报, 2018, 73(9):1 647-1 657.
|
| [17] |
杨迪, 杨旭, 吴相利, 等. 东北地区能源消费碳排放时空演变特征及其驱动机制[J]. 环境科学学报, 2018, 38(11):4 554-4 565.
|
| [18] |
崔凤琪, 唐海萍, 张钦. 京津冀地区城市宜居性评价及影响因素分析:基于2010—2016年面板数据的实证研究[J]. 北京师范大学学报:自然科学版, 2018, 54(5):666-673.
|
| [19] |
张文忠. 宜居城市的内涵及评价指标体系探讨[J]. 城市规划学刊, 2007(3):30-34.
|
| [20] |
金星星, 叶士琳, 吴小影, 等. 海岛型城市人居环境质量评价——基于厦门市和平潭综合实验区的对比[J]. 生态学报, 2016, 36(12):3 678-3 686.
|
| [21] |
陈菁, 洪婉娜. 近17年粤东与闽南地区人居环境变化对比研究[J]. 经济地理, 2018, 38(7):84-89.
|
| [22] |
李雪铭, 晋培育. 中国城市人居环境质量特征与时空差异分析[J]. 地理科学, 2012, 32(5):521-529.
|
| [23] |
张文忠. 城市内部居住环境评价的指标体系和方法[J]. 地理科学, 2007(1):17-23.
|
| [24] |
贾占华, 谷国锋. 东北地区城市宜居性评价及影响因素分析——基于2007—2014年面板数据的实证研究[J]. 地理科学进展, 2017, 36(7):832-842.
|
| [25] |
王婷婷. 东北地区城市宜居性评价与时空演变研究[D]. 长春: 东北师范大学, 2014.
|
| [26] |
李雪铭, 田深圳, 杨俊, 等. 城市人居环境的失配度——以辽宁省14个市为例[J]. 地理研究, 2014, 33(4):687-697.
|
| [27] |
陈呈奕, 张文忠, 湛东升, 等. 环渤海地区城市人居环境质量评估及影响因素[J]. 地理科学进展, 2017, 36(12):1 562-1 570.
|
| [28] |
李航, 李雪铭, 田深圳, 等. 城市人居环境的时空分异特征及其机制研究——以辽宁省为例[J]. 地理研究, 2017, 36(7):1 323-1 338.
|
| [29] |
邹辉, 段学军. 长江经济带经济—环境协调发展格局及演变[J]. 地理科学, 2016, 36(9):1 408-1 417.
|
| [30] |
王玉娟, 杨山, 吴连霞. 多元主体视角下城市人居环境需求异质性研究——以昆山经济技术开发区为例[J]. 地理科学, 2018, 38(7):1 156-1 164.
|
/
| 〈 |
|
〉 |