
A Comparative Analysis of Urban Sprawl Characteristics of High-Density and Low-Density Cities Comparative Analysis of Large Cities in China and America
Received date: 2019-04-12
Revised date: 2019-12-18
Online published: 2025-04-01
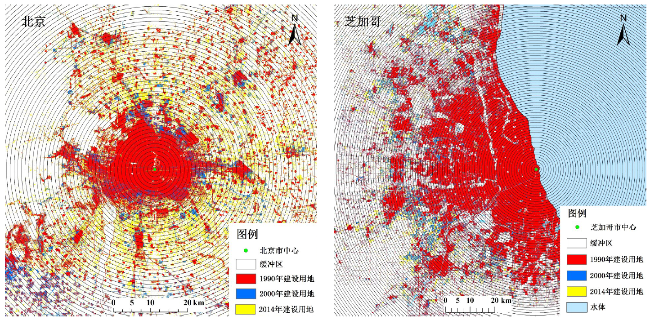
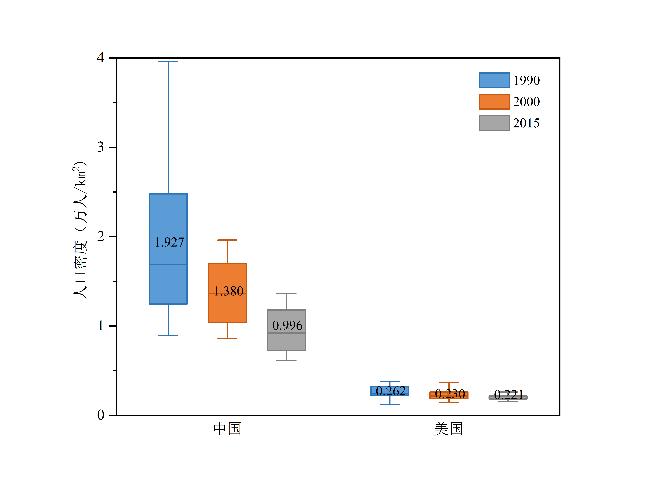
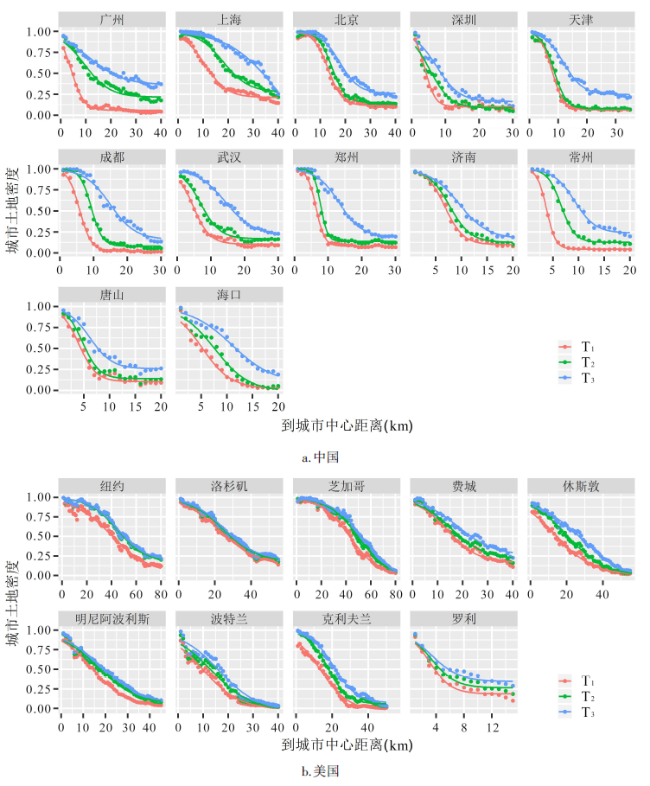
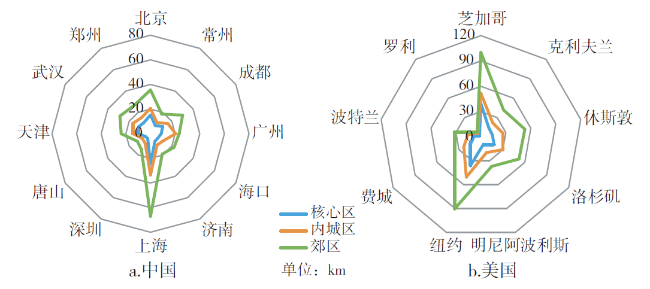
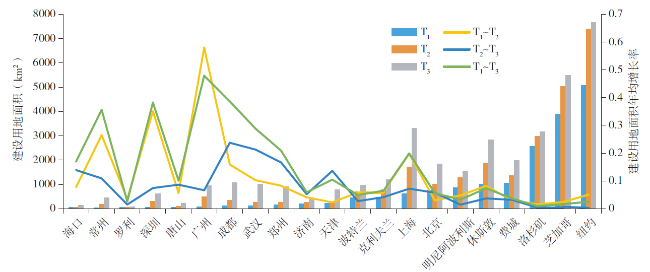
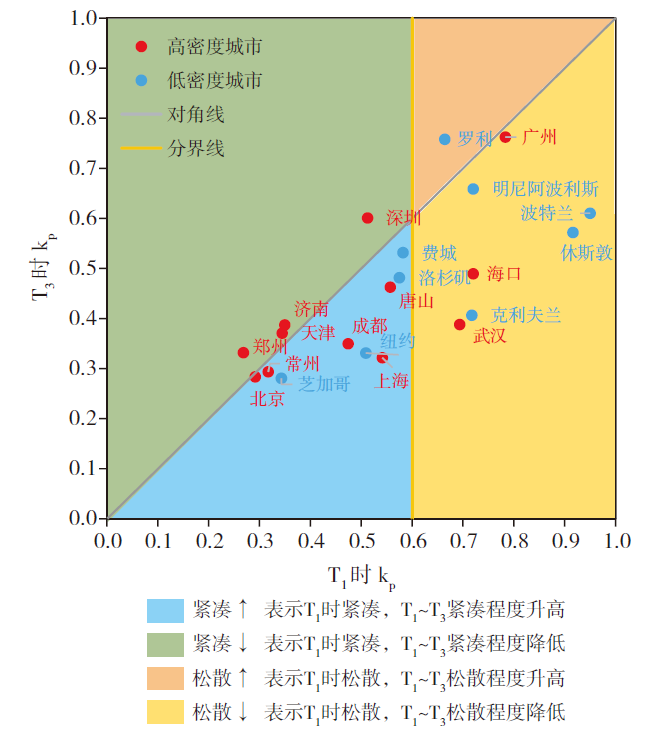
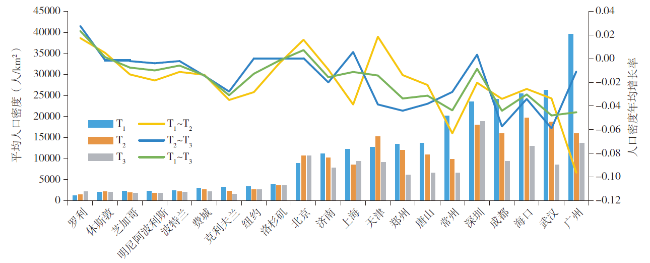
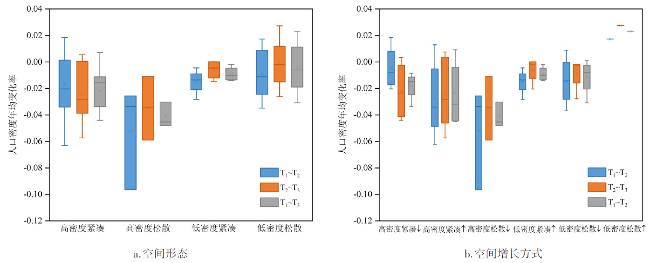
Research on differences of urban sprawl characteristics of high-density cities and low-density cities will help to provide reference for urban planning and management. In this paper,we take 12 Chinese cities and 9 American cities with a population of more than 1 million as sample cities. Based on circle analysis method and inverse S-shaped function,this paper compares and analyzes the characteristics of urban sprawl of high-density cities represented by Chinese cities and low-density cities represented by American cities in 1990,2000 and 2014,from two aspects of land expansion and population density change. The results show that: 1) Under the same population size,the built-up land area of Chinese cities is smaller,but the land expansion rate is faster than American cities. The land expansion of Chinese cities and American cities mainly occurs in the suburbs and the interior of cities respectively. 2) Chinese cities are more compact than American cities. The land expansion of loose high-density cities tend to be compact. In low-density cities,Raleigh has become more loose and other cities' sprawl degree has reduced. 3) The overall population density of high-density cities and low-density cities is both declining. Although high-density Chinese cities are more compact in space,their population density declines faster. It means that it is necessary to curb the sprawl trend of Chinese cities. 4) The population density of compact cities declines more slowly; In high-density cities,the sprawl of land has made population density fall faster,and the compact space growth has slowed down the decline rate of population density. However,the sprawl or compactness of land has no significant effect on the change of population density in low-density cities.
WANG Xue , JIAO Limin , DONG Ting . A Comparative Analysis of Urban Sprawl Characteristics of High-Density and Low-Density Cities Comparative Analysis of Large Cities in China and America[J]. Economic geography, 2020 , 40(2) : 70 -78 . DOI: 10.15957/j.cnki.jjdl.2020.02.008
表1 样本城市概况Tab.1 Sample cities |
| 城市名称 | 人口数量(万人) | ||
|---|---|---|---|
| 1990 | 2000 | 2014 | |
| 广州 | 240.507 | 1 203.912 | 2 465.722 |
| 上海 | 1 004.452 | 1 446.068 | 2 438.727 |
| 北京 | 603.739 | 986.984 | 2 066.940 |
| 深圳 | 45.578 | 595.550 | 1 094.513 |
| 天津 | 433.542 | 472.341 | 1 005.608 |
| 成都 | 201.942 | 511.763 | 933.973 |
| 武汉 | 211.207 | 467.440 | 817.406 |
| 郑州 | 125.696 | 201.221 | 715.662 |
| 济南 | 171.669 | 223.991 | 331.683 |
| 常州 | 100.196 | 152.324 | 307.575 |
| 唐山 | 81.933 | 113.999 | 269.987 |
| 海口 | 50.181 | 75.604 | 124.766 |
| 纽约 | 1 623.530 | 1 795.555 | 1 841.209 |
| 洛杉矶 | 1 235.530 | 1 409.141 | 1 513.897 |
| 芝加哥 | 732.502 | 850.973 | 891.378 |
| 费城 | 476.054 | 532.983 | 585.288 |
| 休斯敦 | 273.974 | 375.862 | 539.934 |
| 明尼阿波利斯 | 189.916 | 228.158 | 262.692 |
| 波特兰 | 113.157 | 151.240 | 190.441 |
| 克利夫兰 | 137.623 | 162.273 | 186.502 |
| 罗利 | 26.255 | 70.216 | 118.842 |
表2 城市土地密度函数拟合参数Tab.2 Parameters of the fitted urban land density functions |
| 城市 | T1 | T2 | T3 | |||||||||||
|---|---|---|---|---|---|---|---|---|---|---|---|---|---|---|
| c | D | c | D | c | D | |||||||||
| 广州 | 1.682 | 0.059 | 8.50 | 0.986 | 1.848 | 0.216 | 18.80 | 0.965 | 1.728 | 0.363 | 23.28 | 0.977 | ||
| 上海 | 2.434 | 0.212 | 21.40 | 0.984 | 3.555 | 0.276 | 35.97 | 0.983 | 4.097 | 0 | 67.01 | 0.975 | ||
| 北京 | 4.523 | 0.115 | 25.96 | 0.995 | 5.327 | 0.152 | 29.06 | 0.994 | 4.648 | 0.259 | 35.52 | 0.988 | ||
| 深圳 | 2.572 | 0.103 | 7.87 | 0.956 | 1.742 | 0.088 | 10.67 | 0.959 | 2.193 | 0.164 | 14.75 | 0.973 | ||
| 天津 | 3.828 | 0.067 | 15.59 | 0.995 | 3.850 | 0.076 | 16.93 | 0.994 | 3.554 | 0.247 | 23.82 | 0.990 | ||
| 成都 | 2.780 | 0.020 | 11.24 | 0.994 | 5.481 | 0.076 | 18.85 | 0.998 | 3.769 | 0.134 | 30.13 | 0.983 | ||
| 武汉 | 1.900 | 0.105 | 9.51 | 0.986 | 2.442 | 0.169 | 14.00 | 0.982 | 3.396 | 0.213 | 28.61 | 0.994 | ||
| 郑州 | 4.917 | 0.082 | 12.73 | 0.998 | 7.537 | 0.137 | 15.52 | 0.997 | 3.972 | 0.191 | 26.52 | 0.991 | ||
| 济南 | 3.771 | 0.099 | 13.57 | 0.995 | 3.712 | 0.126 | 15.33 | 0.994 | 3.403 | 0.17 | 19.09 | 0.995 | ||
| 常州 | 4.159 | 0.046 | 7.49 | 0.999 | 4.945 | 0.127 | 13.17 | 0.996 | 4.488 | 0.237 | 18.39 | 0.993 | ||
| 唐山 | 2.366 | 0.106 | 8.00 | 0.977 | 2.955 | 0.140 | 9.550 | 0.973 | 2.848 | 0.258 | 12.31 | 0.971 | ||
| 海口 | 1.830 | 0.023 | 10.28 | 0.975 | 2.337 | 0 | 15.13 | 0.975 | 2.692 | 0.078 | 22.09 | 0.979 | ||
| 纽约 | 2.589 | 0.021 | 80.74 | 0.979 | 3.924 | 0.174 | 89.31 | 0.989 | 3.981 | 0.188 | 90.27 | 0.989 | ||
| 洛杉矶 | 2.292 | 0.107 | 48.21 | 0.990 | 2.659 | 0.159 | 50.77 | 0.989 | 2.736 | 0.169 | 52.08 | 0.988 | ||
| 芝加哥 | 3.845 | 0.032 | 83.65 | 0.992 | 4.390 | 0.050 | 95.60 | 0.993 | 4.696 | 0.073 | 100.1 | 0.989 | ||
| 费城 | 2.264 | 0.162 | 27.76 | 0.982 | 2.288 | 0.208 | 30.76 | 0.979 | 2.478 | 0.258 | 36.11 | 0.976 | ||
| 休斯敦 | 1.438 | 0.009 | 28.98 | 0.989 | 2.056 | 0.001 | 41.45 | 0.993 | 2.304 | 0 | 52.86 | 0.990 | ||
| 明尼阿波利斯 | 1.830 | 0.029 | 27.87 | 0.991 | 1.896 | 0.050 | 33.54 | 0.981 | 2.000 | 0.055 | 37.10 | 0.986 | ||
| 波特兰 | 1.387 | 0 | 19.66 | 0.976 | 1.709 | 0 | 25.59 | 0.964 | 2.159 | 0 | 31.55 | 0.961 | ||
| 克利夫兰 | 1.837 | 0 | 26.42 | 0.985 | 3.095 | 0.056 | 34.64 | 0.995 | 3.241 | 0.070 | 41.73 | 0.993 | ||
| 罗利 | 1.984 | 0.186 | 6.16 | 0.957 | 1.900 | 0.264 | 6.650 | 0.938 | 1.738 | 0.347 | 6.89 | 0.928 | ||
表3 中国和美国城市的kp值Tab.3 The kp values of cities in China and America |
| 国家 | 城市 | T1 | T2 | T3 |
|---|---|---|---|---|
| 中国 | 广州 | 0.7830 | 0.7126 | 0.7621 |
| 上海 | 0.5411 | 0.3705 | 0.3214 | |
| 北京 | 0.2912 | 0.2472 | 0.2833 | |
| 深圳 | 0.5120 | 0.756 | 0.6005 | |
| 天津 | 0.3440 | 0.3421 | 0.3706 | |
| 成都 | 0.4737 | 0.2403 | 0.3494 | |
| 武汉 | 0.6931 | 0.5393 | 0.3878 | |
| 郑州 | 0.2678 | 0.1747 | 0.3316 | |
| 济南 | 0.3492 | 0.3548 | 0.3870 | |
| 常州 | 0.3167 | 0.2663 | 0.2934 | |
| 唐山 | 0.5566 | 0.4457 | 0.4624 | |
| 海口 | 0.7196 | 0.5635 | 0.4892 | |
| 平均值 | 0.4873 | 0.4177 | 0.4199 | |
| 美国 | 纽约 | 0.5087 | 0.3356 | 0.3308 |
| 洛杉矶 | 0.5746 | 0.4953 | 0.4813 | |
| 芝加哥 | 0.3425 | 0.3000 | 0.2804 | |
| 费城 | 0.5817 | 0.5756 | 0.5315 | |
| 休斯敦 | 0.9158 | 0.6405 | 0.5716 | |
| 明尼阿波利斯 | 0.7196 | 0.6946 | 0.6585 | |
| 波特兰 | 0.9495 | 0.7706 | 0.6100 | |
| 克利夫兰 | 0.7169 | 0.4255 | 0.4063 | |
| 罗利 | 0.6638 | 0.6931 | 0.7577 | |
| 平均值 | 0.6637 | 0.5479 | 0.5142 |
表4 样本城市土地扩张方式分类Tab.4 Classification of land expansion patterns in sample cities |
| 类型 | 城市 | |
|---|---|---|
| 高密度 | 紧凑↓ | 郑州、天津、济南、深圳 |
| 紧凑↑ | 北京、常州、成都、上海、唐山 | |
| 松散↓ | 武汉、海口、广州 | |
| 松散↑ | - | |
| 低密度 | 紧凑↓ | - |
| 紧凑↑ | 芝加哥、纽约、洛杉矶、费城 | |
| 松散↓ | 克利夫兰、明尼阿波利斯、休斯敦、波特兰 | |
| 松散↑ | 罗利 |
| [1] |
Williams, Donald C.Urban Sprawl:A Reference Handbook[M].Santa Barbara, CA:ABC-CLIO, 2000.
|
| [2] |
Gottmann, Jean. Megalopolis:The urbanized northeastern seaboard of the United States[M]. New York: TwentiethCentury Fund,1961.247.
|
| [3] |
|
| [4] |
|
| [5] |
|
| [6] |
张庭伟. 控制城市用地蔓延:一个全球的问题[J]. 城市规划, 1999(8):44-48.
|
| [7] |
张景奇, 娄成武. 中美城市蔓延特征差异对比及对中国蔓延治理的启示[J]. 资源科学, 2014, 36(10):2131-2139.
|
| [8] |
兰肖雄, 刘盛和, 胡章. 我国城市蔓延概念的界定与思考[J]. 地域研究与开发, 2012, 31(3):53-57.
|
| [9] |
周一星, 孟延春. 沈阳的郊区化——兼论中西方郊区化的比较[J]. 地理学报, 1997, 64(4):289-299.
|
| [10] |
周一星, 孟延春. 中国大城市的郊区化趋势[J]. 城市规划汇刊, 1998(3):22-27.
|
| [11] |
蒋芳, 刘盛和, 袁弘. 北京城市蔓延的测度与分析[J]. 地理学报, 2007, 17(6):649-658.
|
| [12] |
|
| [13] |
|
| [14] |
洪世键, 张京祥. 城市蔓延的界定及其测度问题探讨——以长江三角洲为例[J]. 城市规划. 2013, 37(7):42-45.
|
| [15] |
张琳琳, 岳文泽, 范蓓蕾. 中国大城市蔓延的测度研究——以杭州市为例[J]. 地理科学. 2014, 34(4):394-400.
|
| [16] |
童陆亿, 胡守庚. 中国主要城市建设用地扩张特征[J]. 资源科学, 2016, 38(1):50-61
|
| [17] |
张衔春, 向乔玉, 张宇, 等. 中国城市蔓延研究回顾与展望[J]. 规划师, 2014, 30(9):76-81.
|
| [18] |
程玉鸿, 卢婧. 城市蔓延研究述评[J]. 城市发展研究, 2016, 23(4):45-50.
|
| [19] |
史守正, 石忆邵. 城市蔓延的多维度思考[J]. 人文地理, 2017(4):60-65.
|
| [20] |
|
| [21] |
|
| [22] |
|
| [23] |
|
| [24] |
|
| [25] |
|
| [26] |
孙萍, 唐莹,
|
| [27] |
李效顺, 曲福田, 张绍良, 等. 基于国际比较与策略选择的中国城市蔓延治理[J]. 农业工程学报, 2011, 27(10):1-10.
|
| [28] |
张景奇, 孙蕊. 美国城市蔓延应对策略转变对中国的启示[J]. 经济地理, 2013, 33(3):42-46.
|
| [29] |
熊柴, 蔡继明. 我国城镇用地扩展过快吗?——基于国际比较的研究[J]. 河北经贸大学学报, 2014, 35(4):27-33.
|
| [30] |
焦利民, 李泽慧, 许刚, 等. 武汉市城市空间集聚要素的分布特征与模式[J]. 地理学报, 2017, 72(8):1432-1443.
|
| [31] |
|
| [32] |
|
| [33] |
|
| [34] |
张帆. 中国城市蔓延的影响因素分析——基于35个大中城市面板数据的实证研究[J]. 湖北社会科学, 2012(5):69-72.
|
/
| 〈 |
|
〉 |