
Evolution and Synergy of Urban Construction Land and Economic Growth Patterns in Guangdong-Hong Kong-Macao Greater Bay Area
Received date: 2019-06-03
Revised date: 2019-08-14
Online published: 2025-04-01
This paper studies the growth of construction land and the change of economic scale in Guangdong-Hong Kong-Macao Greater Bay Area from 1990 to 2017,and analyses the synergistic relationship between them. The main conclusions are as follows: from 1990 to 2017,the growth rate of construction land in the cities of Greater Bay Area has been accelerating. The change of the growth rate of construction land in different periods is closely related to the change of the development stage of the city. Most of the cities in the Greater Bay Area rank among the top ones in the area of Guangdong province,Hong Kong and Macau,and their rankings are gradually rising. Only Zhaoqing and Macao ranked significantly lower from 1990 to 2017. From 1990 to 2017, the synergy and ordered performance between the construction land and the economic growth in the Greater Bay Area has been on the rise. The growth rate of the construction land in 2010-2017 has obviously decreased compared with the previous period, which reflects that, in recent years,with the continuous advancement of urbanization, the degree of interdependence between the growth of construction land and the economy has decreased. There are obvious differences in the evolution of synergy degree between construction land and economic scale growth among cities. The efficiency of the growth of construction land in Shenzhen,Zhuhai and Zhongshan on economic growth has been rising during the study period. The efficiency of most other cities reached its highest level during the period 2000-2010,and declined significantly during 2010-2017. The different development stages and target orientation of industries among cities result in the difference of synergy between construction land and economic scale growth.
CAO Jing , ZHANG Wenzhong . Evolution and Synergy of Urban Construction Land and Economic Growth Patterns in Guangdong-Hong Kong-Macao Greater Bay Area[J]. Economic geography, 2020 , 40(2) : 52 -60 . DOI: 10.15957/j.cnki.jjdl.2020.02.006
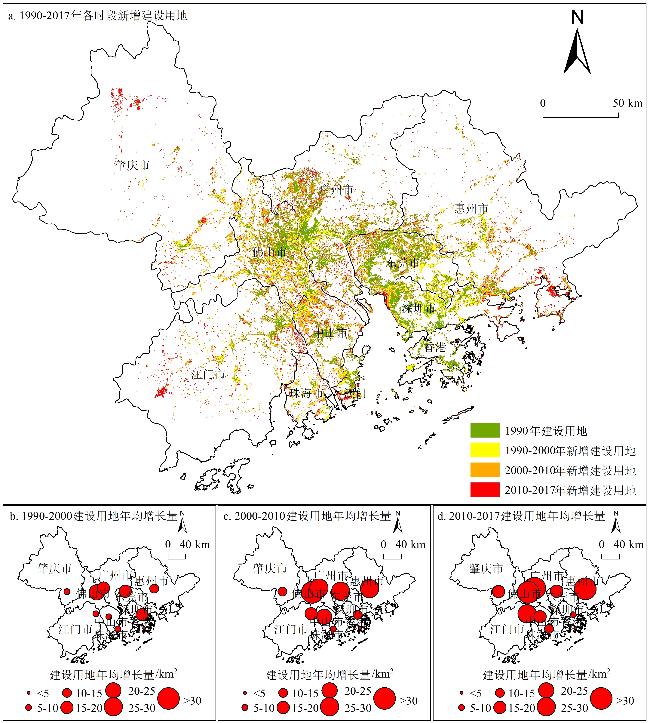
表1 1990—2017年大湾区各市建设用地面积及增长情况Tab.1 Growth of construction land in the Greater Bay Area from 1990 to 2017 |
| 城市 | 建设用地面积/km2 | 年均增长/% | ||||||
|---|---|---|---|---|---|---|---|---|
| 1990 | 2000 | 2010 | 2017 | 1990—2000 | 2000—2010 | 2010—2017 | ||
| 广州 | 644.0 | 798.9 | 1 095.7 | 1 374.4 | 15.5 | 29.7 | 39.8 | |
| 深圳 | 358.6 | 556.2 | 671.0 | 721.1 | 19.8 | 11.5 | 7.2 | |
| 珠海 | 67.4 | 151.8 | 233.3 | 307.1 | 8.4 | 8.2 | 10.5 | |
| 惠州 | 195.7 | 329.2 | 609.7 | 893.6 | 13.3 | 28.1 | 40.6 | |
| 东莞 | 529.9 | 723.4 | 992.3 | 1 121.3 | 19.3 | 26.9 | 18.4 | |
| 中山 | 152.9 | 245.1 | 450.2 | 581.7 | 9.2 | 20.5 | 18.8 | |
| 江门 | 181.9 | 281.5 | 469.6 | 660.4 | 10.0 | 18.8 | 27.3 | |
| 佛山 | 426.2 | 675.3 | 1 071.2 | 1 290.3 | 24.9 | 39.6 | 31.3 | |
| 肇庆 | 52.7 | 133.0 | 253.9 | 386.4 | 8.0 | 12.1 | 18.9 | |
| 香港 | 92.8 | 128.5 | 133.7 | 143.1 | 3.6 | 0.5 | 1.3 | |
| 澳门 | 7.0 | 11.1 | 17.9 | 20.8 | 0.4 | 0.7 | 0.4 | |
图1 1990—2017年大湾区各市建设用地增长情况注:在对建设用地的识别中,未将江门恩平市、肇庆怀集县等过于偏远的区县纳入识别范围。 Fig.1 Growth of construction land in the Greater Bay Area from 1990 to 2017 |
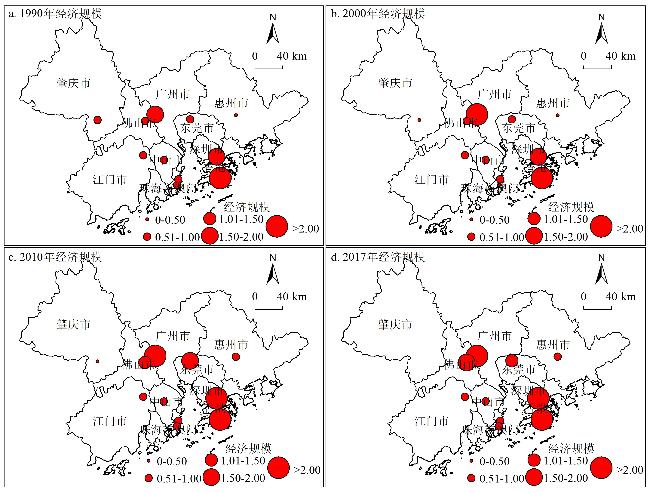
表2 1990—2017年大湾区及周边各市经济规模Tab.2 Economic scale of the cities in the Greater Bay Area and the surrouding cities from 1990 to 2017 |
| 城市 | 1990 | 2000 | 2010 | 2017 | |||||
|---|---|---|---|---|---|---|---|---|---|
| 经济规模 | 位序 | 经济规模 | 位序 | 经济规模 | 位序 | 经济规模 | 位序 | ||
| 粤 港 澳 大 湾 区 内 部 城 市 | 广州 | 1.98 | 2 | 2.16 | 2 | 2.50 | 2 | 2.57 | 3 |
| 深圳 | 1.51 | 3 | 1.68 | 3 | 2.27 | 3 | 2.86 | 1 | |
| 珠海 | 0.78 | 7 | 0.61 | 7 | 0.64 | 10 | 0.86 | 6 | |
| 惠州 | 0.50 | 15 | 0.41 | 13 | 0.76 | 6 | 0.80 | 8 | |
| 东莞 | 0.74 | 8 | 0.93 | 4 | 1.64 | 4 | 1.49 | 5 | |
| 中山 | 0.70 | 9 | 0.59 | 8 | 0.71 | 7 | 0.85 | 7 | |
| 江门 | 0.63 | 12 | 0.51 | 12 | 0.64 | 9 | 0.60 | 10 | |
| 佛山 | 0.84 | 6 | 0.75 | 5 | 1.34 | 5 | 1.51 | 4 | |
| 肇庆 | 0.70 | 10 | 0.40 | 14 | 0.50 | 16 | 0.39 | 15 | |
| 香港 | 2.82 | 1 | 2.78 | 1 | 2.55 | 1 | 2.58 | 2 | |
| 澳门 | 0.89 | 5 | 0.40 | 15 | 0.58 | 11 | 0.51 | 12 | |
| 粤 港 澳 大 湾 区 周 边 城 市 | 汕头 | 1.13 | 4 | 0.53 | 10 | 0.54 | 14 | 0.56 | 11 |
| 韶关 | 0.53 | 14 | 0.32 | 18 | 0.37 | 18 | 0.27 | 18 | |
| 河源 | 0.28 | 19 | 0.20 | 23 | 0.25 | 20 | 0.23 | 19 | |
| 梅州 | 0.50 | 16 | 0.38 | 16 | 0.40 | 17 | 0.36 | 16 | |
| 汕尾 | 0.23 | 20 | 0.24 | 19 | 0.24 | 21 | 0.18 | 23 | |
| 阳江 | 0.29 | 18 | 0.23 | 21 | 0.25 | 19 | 0.21 | 20 | |
| 湛江 | 0.70 | 11 | 0.63 | 6 | 0.68 | 8 | 0.62 | 9 | |
| 茂名 | 0.63 | 13 | 0.55 | 9 | 0.57 | 12 | 0.47 | 14 | |
| 清远 | 0.45 | 17 | 0.33 | 17 | 0.51 | 15 | 0.30 | 17 | |
| 潮州 | 0.15 | 21 | 0.21 | 22 | 0.24 | 22 | 0.20 | 21 | |
| 揭阳 | - | - | 0.51 | 11 | 0.57 | 13 | 0.51 | 13 | |
| 云浮 | - | - | 0.24 | 20 | 0.22 | 23 | 0.19 | 22 | |
注:1990年揭阳和云浮尚未设地级市。 |
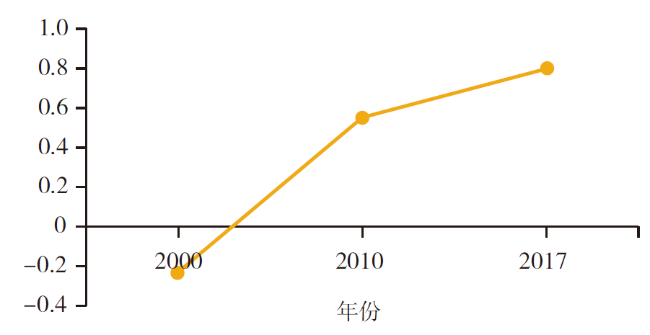
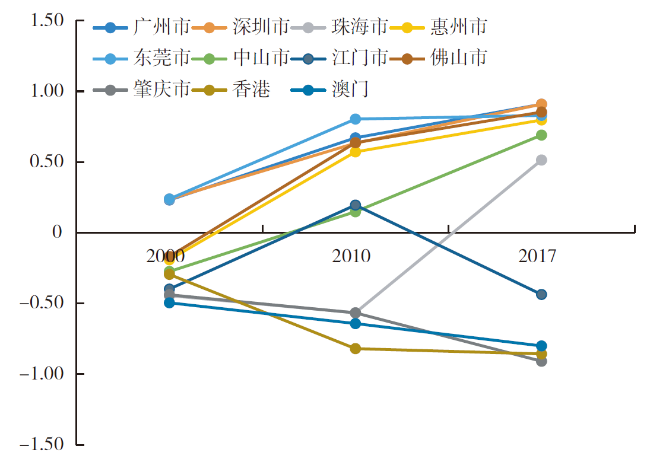
表3 大湾区各市建设用地与经济增长的协同度Tab.3 Synergy between construction land and eonomic gowth in the Greater Bay Area |
| 城市 | 2000 | 2010 | 2017 |
|---|---|---|---|
| 广州 | 0.23 | 0.67 | 0.91 |
| 深圳 | 0.24 | 0.63 | 0.91 |
| 珠海 | -0.44 | -0.57 | 0.51 |
| 惠州 | -0.19 | 0.57 | 0.80 |
| 东莞 | 0.24 | 0.80 | 0.83 |
| 中山 | -0.27 | 0.15 | 0.69 |
| 江门 | -0.40 | 0.20 | -0.44 |
| 佛山 | -0.17 | 0.64 | 0.85 |
| 肇庆 | -0.44 | -0.57 | -0.91 |
| 香港 | -0.29 | -0.82 | -0.86 |
| 澳门 | -0.50 | -0.64 | -0.80 |
| 大湾区总体 | -0.23 | 0.55 | 0.80 |
表4 大湾区各市建设用地增长对经济规模增长的作用效率Tab.4 The efficiency of the growth of construction land on economic growth in the cities in Greater Bay Area |
| 城市 | 1990—2000年 | 2000—2010年 | 2010—2017年 |
|---|---|---|---|
| 广州 | 0.10 | 0.10 | 0.02 |
| 深圳 | 0.07 | 0.44 | 1.00 |
| 珠海 | 0 | 0.03 | 0.25 |
| 惠州 | 0 | 0.11 | 0.01 |
| 东莞 | 0.08 | 0.22 | 0 |
| 中山 | 0 | 0.05 | 0.09 |
| 江门 | 0 | 0.06 | 0 |
| 佛山 | 0 | 0.13 | 0.07 |
| 肇庆 | 0 | 0.07 | 0 |
注:由于香港、澳门建设用地增长空间极小,缺少对比分析价值,因此未纳入分析模型当中。 |
| [1] |
吴亚明. 建设大湾区吹响集结号[N]. 人民日报海外版,2019- 02-19(第1版).
|
| [2] |
彭芳梅. 粤港澳大湾区及周边城市经济空间联系与空间结构——基于改进引力模型与社会网络分析的实证分析[J]. 经济地理, 2017, 37(12):57-64.
|
| [3] |
周春山, 罗利佳, 史晨怡, 等. 粤港澳大湾区经济发展时空演变特征及其影响因素[J]. 热带地理, 2017, 37(6):802-813.
|
| [4] |
李郇, 周金苗, 黄耀福, 等. 从巨型城市区域视角审视粤港澳大湾区空间结构[J]. 地理科学进展, 2018, 37(12):1 609-1 622.
|
| [5] |
彭芳梅. 粤港澳大湾区金融禀赋、贸易开放度与经济空间演化及其实证[J]. 统计与决策, 2019, 35(6):119-123.
|
| [6] |
刘锦, 田银生. 粤港澳大湾区背景下的珠三角城市群产业—人口—空间交互影响机理[J]. 地理科学进展, 2018, 37(12):1 653-1 662.
|
| [7] |
潘苏, 种照辉, 覃成林. 基于先进生产性服务业的粤港澳大湾区城市网络演化及其影响因素[J]. 广东财经大学学报, 2019, 34(1):103-112.
|
| [8] |
安宁, 马凌, 朱竑. 政治地理视野下的粤港澳大湾区发展思考[J]. 地理科学进展, 2018, 37(12):1 633-1 643.
|
| [9] |
马海涛, 黄晓东, 李迎成. 粤港澳大湾区城市群知识多中心的演化过程与机理[J]. 地理学报, 2018, 73(12):2 297-2 314.
|
| [10] |
林贡钦, 徐广林. 国外著名湾区发展经验及对我国的启示[J]. 深圳大学学报:人文社会科学版, 2017, 34(5):25-31.
|
| [11] |
李睿. 国际著名“湾区”发展经验及启示[J]. 港口经济, 2015(9):5-8.
|
| [12] |
谭术魁, 饶映雪, 朱祥波. 土地投入对中国经济增长的影响[J]. 中国人口·资源与环境, 2012, 22(9):61-67.
|
| [13] |
夏方舟, 李洋宇, 严金明. 产业结构视角下土地财政对经济增长的作用机制——基于城市动态面板数据的系统GMM分析[J]. 经济地理, 2014, 34(12):85-92.
|
| [14] |
曾伟. 土地资源对城市经济增长的影响分析:理论与实证[J]. 资源科学, 2014, 36(7):1 317-1 326.
|
| [15] |
王建康, 谷国锋. 土地要素对中国城市经济增长的贡献分析[J]. 中国人口·资源与环境, 2015, 25(8):10-17.
|
| [16] |
黄凌翔, 张臣刚, 卢静, 等. 土地供应结构对经济增长影响的空间效应研究——以长江中游城市群为例[J]. 中国土地科学, 2018, 32(9):51-58.
|
| [17] |
陈翠芳, 卢新海, 刘茜, 等. 城市土地集约利用能提升经济增长质量吗?[J]. 资源与产业, 2019, 21(3):67-74.
|
| [18] |
胡应龙, 陈颖彪, 郑子豪, 等. 广州市生态系统服务价值空间异质性变化[J]. 热带地理, 2018, 38(4):475-486.
|
| [19] |
|
| [20] |
虞晓芬, 傅玳. 多指标综合评价方法综述[J]. 统计与决策, 2004(11):119-121.
|
| [21] |
李谭, 王利, 王瑜. 辽宁省港口物流效率及其与腹地经济协同发展研究[J]. 经济地理, 2012, 32(9):108-113.
|
/
| 〈 |
|
〉 |