
Spatio-Temporal Coupling Relationship between Tourism Poverty Alleviation Efficiency and Economic Development Level in Contiguous Destitute Areas:A Case Study of Wuling Mountain Area
Received date: 2019-03-27
Revised date: 2019-12-16
Online published: 2025-04-01
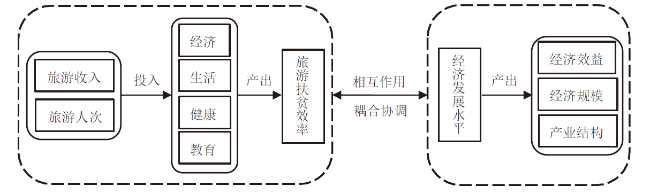
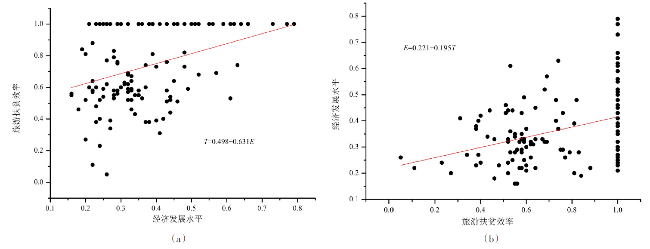
Using SBM model and entropy weight TOPSIS method,the poverty alleviation efficiency and economic development level of national poor counties in Wuling Mountain Area during the period of 2010-2016 are measured respectively,and the coupling degree model is adopted to explore the spatio-temporal coupling relationship between tourism poverty alleviation efficiency and economic development level. Results show that: 1)The tourism poverty alleviation efficiency of Wuling Mountain Area is relatively high and rises steadily in small fluctuations,but there are significant differences in the efficiency of tourism poverty alleviation between the national poor counties. 2)The economic development level of Wuling Mountain Area is generally on the rise,but the composite index is comparatively low,the economic growth rate shows a significant slow-growth trend,and the regional differences are distinct. 3)During the research period,the coupling degree between tourism poverty alleviation efficiency and economic development level is high and shows a continuous upward trend,and both of them tend to develop harmoniously. The tourism poverty alleviation efficiency and economic development level are significantly positively correlated with each other. Compared with the impact of tourism poverty alleviation efficiency on the economic development level,the growth of regional economic level has a more obvious effect on improving tourism poverty alleviation efficiency.
WANG Kai , LIN Hui , GAN Chang , DENG Chuxiong . Spatio-Temporal Coupling Relationship between Tourism Poverty Alleviation Efficiency and Economic Development Level in Contiguous Destitute Areas:A Case Study of Wuling Mountain Area[J]. Economic geography, 2020 , 40(2) : 200 -208 . DOI: 10.15957/j.cnki.jjdl.2020.02.022
表1 2010—2016年武陵山片区42个贫困县(市、区)经济发展水平综合指数Tab.1 Index of economic development level of 42 poor counties in Wuling Mountain Area in 2010-2016 |
| 县(市、区) | 2010 | 2013 | 2016 |
|---|---|---|---|
| 恩施市 | 0.52 | 0.55 | 0.57 |
| 利川市 | 0.38 | 0.32 | 0.35 |
| 建始县 | 0.34 | 0.27 | 0.33 |
| 巴东县 | 0.40 | 0.33 | 0.36 |
| 宣恩县 | 0.21 | 0.21 | 0.27 |
| 咸丰县 | 0.29 | 0.29 | 0.32 |
| 来凤县 | 0.33 | 0.32 | 0.36 |
| 鹤峰县 | 0.44 | 0.35 | 0.37 |
| 长阳县 | 0.61 | 0.44 | 0.42 |
| 秭归县 | 0.37 | 0.46 | 0.43 |
| 邵阳县 | 0.29 | 0.31 | 0.29 |
| 隆回县 | 0.32 | 0.32 | 0.30 |
| 城步县 | 0.24 | 0.34 | 0.27 |
| 桑植县 | 0.30 | 0.32 | 0.28 |
| 安化县 | 0.39 | 0.43 | 0.39 |
| 沅陵县 | 0.46 | 0.51 | 0.43 |
| 通道县 | 0.28 | 0.33 | 0.23 |
| 新化县 | 0.38 | 0.41 | 0.38 |
| 泸溪县 | 0.35 | 0.32 | 0.28 |
| 凤凰县 | 0.33 | 0.44 | 0.41 |
| 花垣县 | 0.49 | 0.43 | 0.32 |
| 保靖县 | 0.30 | 0.25 | 0.20 |
| 古丈县 | 0.26 | 0.40 | 0.27 |
| 永顺县 | 0.22 | 0.28 | 0.21 |
| 龙山县 | 0.24 | 0.28 | 0.25 |
| 江口县 | 0.22 | 0.26 | 0.32 |
| 石阡县 | 0.16 | 0.20 | 0.27 |
| 思南县 | 0.19 | 0.23 | 0.26 |
| 印江县 | 0.18 | 0.24 | 0.29 |
| 德江县 | 0.16 | 0.22 | 0.32 |
| 沿河县 | 0.22 | 0.24 | 0.23 |
| 松桃县 | 0.20 | 0.25 | 0.33 |
| 正安县 | 0.27 | 0.26 | 0.25 |
| 道真县 | 0.23 | 0.31 | 0.29 |
| 务川县 | 0.22 | 0.26 | 0.37 |
| 黔江区 | 0.79 | 0.77 | 0.73 |
| 丰都县 | 0.56 | 0.59 | 0.61 |
| 武隆县 | 0.63 | 0.66 | 0.64 |
| 石柱县 | 0.59 | 0.62 | 0.61 |
| 秀山县 | 0.48 | 0.56 | 0.52 |
| 酉阳县 | 0.45 | 0.48 | 0.45 |
| 彭水县 | 0.50 | 0.48 | 0.52 |
| 均值 | 0.35 | 0.37 | 0.36 |
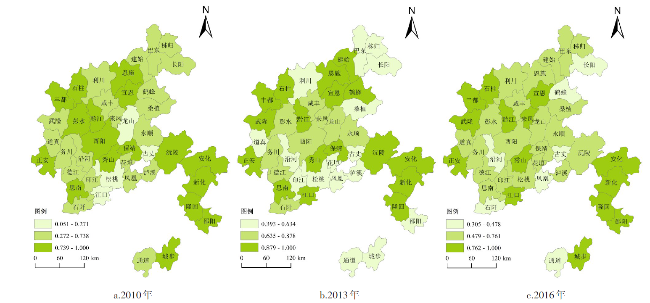
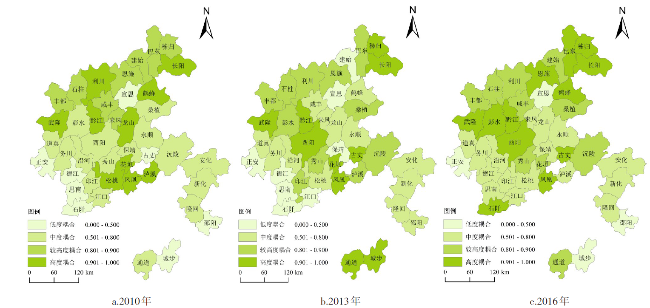
图3 2010—2016年武陵山片区42个贫困县(市、区)旅游扶贫效率与经济发展水平耦合类型空间分布Fig.3 Spatial distribution pattern of coupling types of tourism poverty alleviation efficiency and economic development level of 42 poor counties in Wuling Mountain Area in 2010-2016 |
表2 2010—2016年武陵山片区42个贫困县(市、区)旅游扶贫效率与经济发展水平耦合度Tab.2 Coupling degree of tourism poverty alleviation efficiency and economic development level of 42 poor counties in Wuling Mountain Area in 2010-2016 |
| 县(市、区) | 2010 | 2013 | 2016 | 均值 | 排名 |
|---|---|---|---|---|---|
| 恩施市 | 0.81 | 0.84 | 0.98 | 0.88 | 9 |
| 利川市 | 1.00 | 0.89 | 0.88 | 0.92 | 7 |
| 建始县 | 0.89 | 0.45 | 0.85 | 0.73 | 25 |
| 巴东县 | 0.84 | 0.85 | 0.93 | 0.87 | 12 |
| 宣恩县 | 0.33 | 0.33 | 0.45 | 0.37 | 42 |
| 咸丰县 | 0.81 | 0.64 | 0.83 | 0.76 | 23 |
| 来凤县 | 0.81 | 0.75 | 0.61 | 0.72 | 26 |
| 鹤峰县 | 1.00 | 0.59 | 1.00 | 0.86 | 14 |
| 长阳县 | 0.99 | 0.99 | 1.00 | 0.99 | 1 |
| 秭归县 | 0.89 | 0.99 | 0.99 | 0.96 | 3 |
| 邵阳县 | 0.49 | 0.78 | 0.49 | 0.58 | 35 |
| 隆回县 | 0.54 | 0.54 | 0.50 | 0.53 | 38 |
| 城步县 | 0.39 | 0.97 | 0.45 | 0.60 | 33 |
| 桑植县 | 0.79 | 0.81 | 0.82 | 0.81 | 19 |
| 安化县 | 0.77 | 0.71 | 0.65 | 0.71 | 28 |
| 沅陵县 | 0.75 | 0.80 | 0.85 | 0.80 | 20 |
| 通道县 | 0.80 | 0.95 | 0.88 | 0.88 | 10 |
| 新化县 | 0.64 | 0.68 | 0.64 | 0.65 | 31 |
| 泸溪县 | 0.90 | 0.81 | 0.77 | 0.83 | 17 |
| 凤凰县 | 0.90 | 0.98 | 0.96 | 0.95 | 4 |
| 花垣县 | 0.98 | 0.96 | 0.85 | 0.93 | 6 |
| 保靖县 | 0.50 | 0.41 | 0.64 | 0.52 | 39 |
| 古丈县 | 0.29 | 1.00 | 0.97 | 0.76 | 24 |
| 永顺县 | 0.58 | 0.57 | 0.59 | 0.58 | 36 |
| 龙山县 | 1.00 | 0.60 | 0.70 | 0.77 | 22 |
| 江口县 | 0.79 | 0.43 | 0.54 | 0.59 | 34 |
| 石阡县 | 0.48 | 0.40 | 0.93 | 0.61 | 32 |
| 思南县 | 0.36 | 0.37 | 0.69 | 0.48 | 40 |
| 印江县 | 0.65 | 0.88 | 0.79 | 0.77 | 21 |
| 德江县 | 0.49 | 0.41 | 0.76 | 0.55 | 37 |
| 沿河县 | 0.65 | 0.75 | 0.77 | 0.72 | 27 |
| 松桃县 | 0.96 | 0.75 | 0.78 | 0.83 | 16 |
| 正安县 | 0.45 | 0.43 | 0.41 | 0.43 | 41 |
| 道真县 | 0.64 | 0.79 | 0.65 | 0.69 | 29 |
| 务川县 | 0.64 | 0.57 | 0.79 | 0.67 | 30 |
| 黔江区 | 0.97 | 0.97 | 0.95 | 0.96 | 2 |
| 丰都县 | 0.85 | 0.87 | 0.89 | 0.87 | 13 |
| 武隆县 | 0.99 | 0.92 | 0.91 | 0.94 | 5 |
| 石柱县 | 0.87 | 0.89 | 0.89 | 0.88 | 8 |
| 秀山县 | 0.77 | 0.85 | 0.81 | 0.81 | 18 |
| 酉阳县 | 0.73 | 0.92 | 0.94 | 0.86 | 15 |
| 彭水县 | 0.79 | 0.87 | 0.96 | 0.87 | 11 |
| 均值 | 0.73 | 0.74 | 0.78 |
表3 旅游扶贫效率与经济发展水平回归分析结果Tab.3 Regression result of tourism poverty alleviation efficiency and economic development level |
| 因变量 | 自变量 | 系数 | 标准误差 | T | P |
|---|---|---|---|---|---|
| 旅游扶贫效率 | 常量 | 0.498 | 0.059 | 8.503 | 0.000 |
| 经济发展水平 | 0.631 | 0.151 | 4.167 | 0.000 | |
| 经济发展水平 | 常量 | 0.221 | 0.036 | 6.179 | 0.000 |
| 旅游扶贫效率 | 0.195 | 0.047 | 4.167 | 0.000 |
注:**在置信度(双侧)为0.01时,相关性是显著的。 |
| [1] |
李会琴, 侯林春, 杨树旺, 等. 国外旅游扶贫研究进展[J]. 人文地理, 2015, 30(1):26-32.
|
| [2] |
|
| [3] |
|
| [4] |
中共中央, 国务院. 中国农村扶贫开发纲要(2011-2020年)[R]. 2011.
|
| [5] |
|
| [6] |
|
| [7] |
|
| [8] |
|
| [9] |
|
| [10] |
丁水平, 林杰. 地区经济发展对旅游增长影响的空间效应分析[J]. 统计与决策, 2018, 34(15):154-157.
|
| [11] |
赵磊. 旅游发展与经济增长——来自中国的经验证据[J]. 旅游学刊, 2015, 30(4):33-49.
|
| [12] |
汪彬, 陈耀. 国内旅游业发展与区域经济增长——基于中国285个地级市的实证研究[J]. 经济问题探索, 2017(12):62-72.
|
| [13] |
|
| [14] |
|
| [15] |
|
| [16] |
龙祖坤, 李绪茂. 社会网络视角下县域旅游扶贫效率评价与分析——基于湖南省数据[J]. 农林经济管理学报, 2017, 16(5):683-691.
|
| [17] |
龙祖坤, 杜倩文, 周婷. 武陵山区旅游扶贫效率的时间演进与空间分异[J]. 经济地理, 2015, 35(10):210-217.
|
| [18] |
孙春雷, 张明善. 精准扶贫背景下旅游扶贫效率研究—以湖北大别山区为例[J]. 中国软科学, 2018(4):65-73.
|
| [19] |
鄢慧丽, 王强, 熊浩, 等. 海南省少数民族地区旅游扶贫效率测度与时空演化分析[J]. 中国软科学, 2018(8):63-76.
|
| [20] |
王凯, 甘畅, 王梦晗, 等. 湖北省旅游扶贫效率时空格局及其影响因素[J]. 长江流域资源与环境, 2019, 28(4):863-871.
|
| [21] |
曹妍雪, 马蓝. 基于三阶段DEA的我国民族地区旅游扶贫效率评价[J]. 华东经济管理, 2017, 31(9):91-97.
|
| [22] |
黄渊基. 连片特困地区旅游扶贫效率评价及时空分异——以武陵山湖南片区20个县(市、区)为例[J]. 经济地理, 2017, 37(11):229-235.
|
| [23] |
李定珍, 张琰飞, 鲁明勇, 等. 武陵山片区旅游扶贫发展报告[M]. 北京: 经济科学出版社, 2018.
|
| [24] |
游达明, 邸雅婷, 姜珂. 我国区域科技创新资源配置效率的实证研究——基于产出导向的SBM模型和Malmquist生产率指数[J]. 软科学, 2017, 31(8):71-75,85.
|
| [25] |
马勇, 黄智洵. 长江中游城市群生态文明水平测度及时空演变[J]. 生态学报, 2016, 36(23):7 778-7 791.
|
| [26] |
周成, 金川, 赵彪, 等. 区域经济—生态—旅游耦合协调发展省际空间差异研究[J]. 干旱区资源与环境, 2016, 30(7):203-208.
|
| [27] |
刘雷, 张华. 山东省城市化效率与经济发展水平的时空耦合关系[J]. 经济地理, 2015, 35(8):75-82.
|
| [28] |
徐佳萍, 郑林, 廖传清. 江西省城镇化效率与经济发展水平的时空耦合关系[J]. 经济地理, 2018, 38(5):93-100.
|
| [29] |
丛晓男. 耦合度模型的形式、性质及在地理学中的若干误用[J]. 经济地理, 2019, 39(4):18-25.
|
| [30] |
|
| [31] |
王小林. 贫困测量:理论与方法[M]. 北京: 社会科学文献出版社, 2017.
|
| [32] |
何静, 汪侠, 刘丹丽, 等. 国家级贫困县旅游发展与多维贫困的脱钩关系研究——以西南地区为例[J]. 地理研究, 2019, 38(5):1 189-1 207.
|
| [33] |
刘丹丽, 汪侠, 吴小根, 等. 全球贫困国家旅游竞争力与经济发展的耦合协调度及时空变化[J]. 地理科学进展, 2018, 37(10):1 381-1 391.
|
/
| 〈 |
|
〉 |