
Spatial and Temporal Differentiation of Urban Economic Influence in Prefecture-Level Cities of Shaanxi Province (2008-2017)
Received date: 2019-08-28
Revised date: 2020-05-10
Online published: 2025-04-01
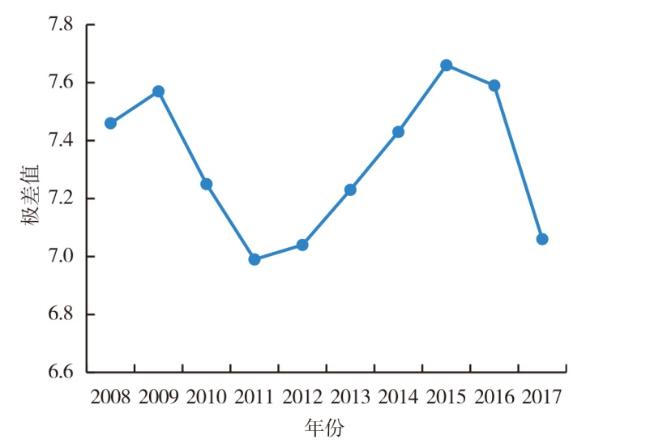
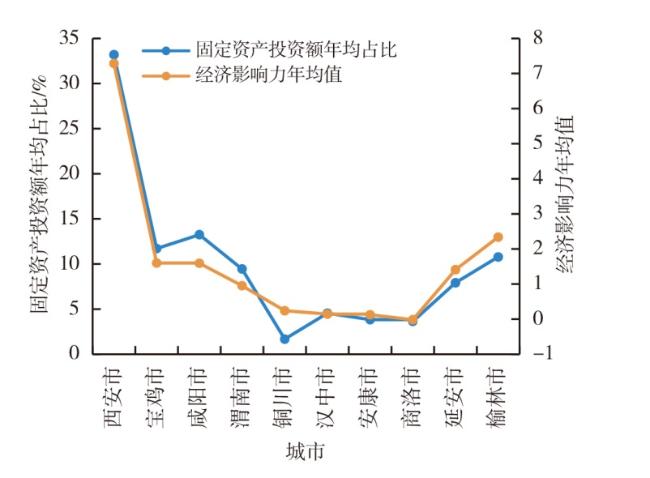
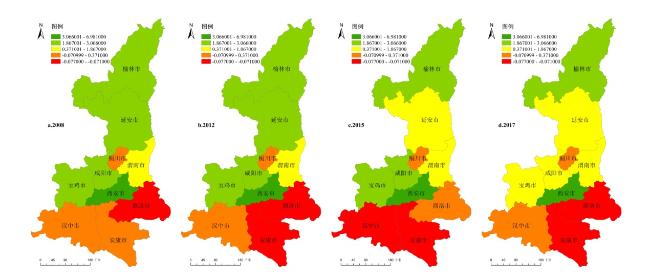
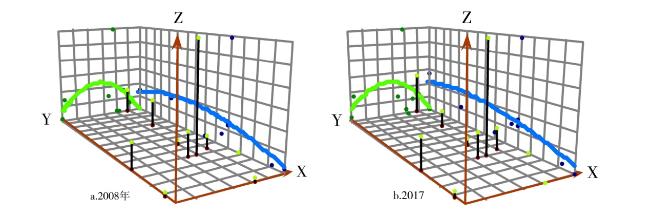
The urban economy is of great significance to the positioning and development of cities. With the development of cities,the differences in economic influence among cities gradually emerge,and their spatial and temporal distribution characteristics and driving mechanisms are explored in order to provide a basis for urban planning positioning and policy formulation. Based on the spatial and temporal differentiation of prefecture-level city economy in Shaanxi Province,this paper uses principal component analysis to calculate and analyze the economic influence of Shaanxi Province from 2008 to 2017. The research shows that: 1) The economic influence of each city in Shaanxi Province has increased year by year,the growth rate of each city is different,and the overall stability,local changes; 2) Nature,capital and policy jointly drive the change of the urban economy,and the score of urban economic influence is significant Positive correlation; 3) During 2008-2017,Shaanxi's urban economic influence hot spots and cold spots showed obvious spatial heterogeneity. Cold spots were mainly distributed in southern Shaanxi,with Xi'an ranking first in hot spots with 7.285,Followed by Yulin (2.337); 4) The trend surface of 2008 and 2017 showed an inverted U-shaped trend in the east and west,south and north directions,highlighting the influence of Xi'an as the economic center of Shaanxi Province.
ZHANG Xiaoyu , YUN Xuefeng , MA Chaoqun , WEI Xindong . Spatial and Temporal Differentiation of Urban Economic Influence in Prefecture-Level Cities of Shaanxi Province (2008-2017)[J]. Economic geography, 2020 , 40(7) : 65 -72 . DOI: 10.15957/j.cnki.jjdl.2020.07.008
表1 因子解释原有变量总方差Tab.1 Factor explains the total variance of the original variables |
| 成分 | 初始特征值 | ||
|---|---|---|---|
| 总计 | 方差百分比(%) | 累积贡献率(%) | |
| 1 | 9.533 | 79.445 | 79.445 |
| 2 | 1.351 | 11.257 | 90.701 |
| 3 | 0.672 | 5.598 | 96.299 |
| 4 | 0.192 | 1.602 | 97.902 |
| 5 | 0.165 | 1.376 | 99.277 |
| 6 | 0.069 | 0.579 | 99.856 |
| 7 | 0.015 | 0.128 | 99.984 |
| 8 | 0.001 | 0.009 | 99.993 |
| 9 | 0.001 | 0.007 | 100.000 |
| 10 | 3.467E-16 | 2.889E-15 | 100.000 |
| 11 | 1.086E-16 | 9.051E-16 | 100.000 |
| 12 | -1.439E-16 | -1.199E-15 | 100.000 |
表2 因子载荷矩阵Tab.2 Factor load matrix |
| 因子 | 成分矩阵 | |
|---|---|---|
| 成分1 | 成分2 | |
| 人均GDP | 0.951 | 0.041 |
| 地方财政收入 | 0.942 | 0.257 |
| 社会消费品零售总额 | 0.986 | -0.133 |
| 居民消费价格指数 | -0.617 | 0.030 |
| 城市居民家庭人均可支配收入 | 0.997 | -0.038 |
| 人民币存款余额 | 0.995 | -0.054 |
| 专利授权量 | 0.915 | -0.198 |
| 关区出口总额 | 0.898 | -0.300 |
| 年度旅客发送量 | -0.042 | 0.978 |
| 第三产业增加值 | 0.991 | -0.088 |
| 工业总增加值 | 0.952 | 0.237 |
| 年度货物运输量 | 0.933 | 0.335 |
表3 2008—2017年城市经济影响力综合得分Tab.3 Comprehensive score of urban economic influence in 2008-2017 |
| 西安 | 宝鸡 | 咸阳 | 渭南 | 铜川 | 汉中 | 安康 | 商洛 | 延安 | 榆林 | |
|---|---|---|---|---|---|---|---|---|---|---|
| 2008 | 7.46 | 1.65 | 1.61 | 0.82 | 0.26 | 0.15 | 0.24 | 0.00 | 2.03 | 1.93 |
| 2009 | 7.41 | 1.50 | 1.66 | 0.76 | 0.16 | 0.10 | 0.07 | -0.15 | 1.56 | 1.87 |
| 2010 | 7.30 | 1.53 | 1.48 | 0.83 | 0.41 | 0.19 | 0.21 | 0.06 | 1.56 | 1.97 |
| 2011 | 7.08 | 1.45 | 1.50 | 0.86 | 0.29 | 0.22 | 0.16 | 0.08 | 1.53 | 2.15 |
| 2012 | 7.10 | 1.78 | 1.60 | 0.72 | 0.17 | 0.22 | 0.09 | 0.06 | 1.50 | 2.25 |
| 2013 | 7.31 | 1.61 | 1.49 | 0.94 | 0.07 | 0.37 | 0.22 | 0.07 | 1.48 | 2.10 |
| 2014 | 7.23 | 1.28 | 1.34 | 0.67 | 0.04 | 0.00 | 0.28 | -0.19 | 1.26 | 2.22 |
| 2015 | 7.51 | 1.83 | 1.89 | 1.25 | 0.27 | -0.08 | -0.15 | 0.09 | 1.07 | 2.93 |
| 2016 | 7.47 | 1.50 | 1.90 | 1.32 | 0.36 | 0.10 | 0.21 | -0.11 | 0.94 | 2.88 |
| 2017 | 6.98 | 1.87 | 1.46 | 1.35 | 0.37 | 0.16 | -0.08 | -0.07 | 1.17 | 3.07 |
| 年均值 | 7.285 | 1.600 | 1.593 | 0.952 | 0.240 | 0.143 | 0.125 | -0.016 | 1.410 | 2.337 |
注:正值表示城市经济影响力高于省域平均水平,负值代表低于全省平均水平。 |
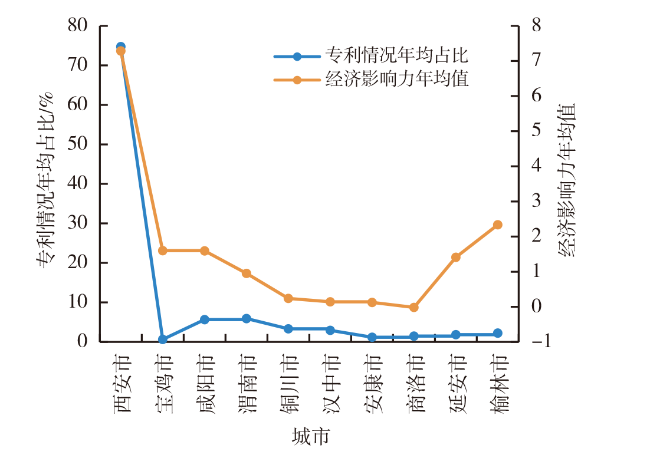
表4 全社会固定资产投资总额及专利申请授权量与城市经济影响力相关性分析Tab.4 Correlation analysis of total fixed asset investment and patent application authorization and urban economic influence |
| 城市 | 皮尔逊相关性 | |
|---|---|---|
| 全社会固定资产投资 总额与城市经济影响力 | 专利申请授权量与 城市经济影响力 | |
| 西安市 | 0.958** | 0.783** |
| 铜川市 | 0.985** | 0.880** |
| 宝鸡市 | 0.935** | 0.920** |
| 咸阳市 | 0.945** | 0.895** |
| 渭南市 | 0.987** | 0.903** |
| 汉中市 | 0.968** | 0.924** |
| 安康市 | 0.939** | 0.896** |
| 商洛市 | 0.969** | 0.813** |
| 延安市 | 0.966** | 0.668* |
| 榆林市 | 0.734* | 0.901** |
注:“*”代表在10%的水平上显著,“**”表示在5%的水平上显著。 |
表5 2008年城市经济影响力趋势面拟合模型摘要和参数估算值Tab.5 Urban economic impact trend surface fitting model summary and parameter estimation in 2008 |
| 方程 | 模型摘要 | 参数估算值 | ||||||||
|---|---|---|---|---|---|---|---|---|---|---|
| R2 | F | 自由度1 | 自由度2 | 显著性 | 常量 | b1 | b2 | b3 | ||
| 线性 | 0.177 | 1.718 | 1 | 8 | 0.226 | 3.295 | -0.306 | |||
| 对数 | 0.403 | 5.393 | 1 | 8 | 0.049 | 4.491 | -1.904 | |||
| 二次 | 0.609 | 5.450 | 2 | 7 | 0.037 | 7.449 | -2.382 | 0.189 | ||
| 三次 | 0.668 | 4.027 | 3 | 6 | 0.069 | 9.928 | -4.582 | 0.666 | -0.029 | |
表6 2017年城市经济影响力趋势面拟合模型摘要和参数估算值Tab.6 Urban economic impact trend surface fitting model summary and parameter estimation in 2017 |
| 方程 | 模型摘要 | 参数估算值 | ||||||||
|---|---|---|---|---|---|---|---|---|---|---|
| R2 | F | 自由度1 | 自由度2 | 显著性 | 常量 | b1 | b2 | b3 | ||
| 线性 | 0.150 | 1.407 | 1 | 8 | 0.270 | 3.127 | -0.270 | |||
| 对数 | 0.362 | 4.540 | 1 | 8 | 0.066 | 4.261 | -1.733 | |||
| 二次 | 0.642 | 6.285 | 2 | 7 | 0.027 | 7.384 | -2.399 | 0.194 | ||
| 三次 | 0.650 | 3.709 | 3 | 6 | 0.081 | 8.225 | -3.144 | 0.355 | -0.010 | |
| [1] |
周一星, 张莉. 改革开放条件下的中国城市经济区[J]. 地理学报, 2003, 58(2):271-284.
|
| [2] |
陆大道, 刘毅, 樊杰. 我国区域政策实施效果与区域发展的基本态势[J]. 地理学报, 1999(6):496-508.
|
| [3] |
方大春, 孙明月. 长江经济带核心城市影响力研究[J]. 经济地理, 2015, 35(1):76-81.
|
| [4] |
赵正, 王佳昊, 冯骥. 京津冀城市群核心城市的空间联系及影响测度[J]. 经济地理, 2017, 37(6):60-66,75.
|
| [5] |
刘涛, 曹广忠. 城市规模的空间聚散与中心城市影响力——基于中国637个城市空间自相关的实证[J]. 地理研究, 2012, 31(7):1 317-1 327.
|
| [6] |
冯德显, 贾晶, 巧旭宁. 区域性中心城市辐射力及其评价——以郑州市为例[J]. 地理科学, 2006(3):266-272.
|
| [7] |
刘敏. 高速公路建设对河南省城镇化结构演变的影响研究[D]. 郑州: 河南农业大学, 2016.
|
| [8] |
|
| [9] |
|
| [10] |
胡华杰. 中国城市经济发展中的政府功效研究[D]. 上海: 上海社会科学院, 2018.
|
| [11] |
周正柱, 王俊龙. 我国省域城镇化动力因素空间差异——基于面板数据的空间计量分析[J]. 科技与经济, 2018, 31(6):16-20.
|
| [12] |
龙拥军, 杨庆媛. 重庆城市经济空间影响力研究[J]. 经济地理, 2012, 32(5):71-76.
|
| [13] |
陕西省统计局. 陕西统计年鉴[M]. 北京: 中国统计出版社, 2008—2017.
|
| [14] |
张新红, 张志斌. 广东省中心城市发展潜力分析与省域城镇空间发展[J]. 亚热带资源与环境学报, 2007(1):68-75.
|
| [15] |
黄玲, 沈洁, 杨鹏辉. 上海市对长三角经济圈经济辐射力的计量分析[J]. 高师理科学刊, 2016. 36(8):12-17.
|
| [16] |
赵娴, 林楠. 中国国家中心城市经济辐射力分析与评价[J]. 经济与管理研究, 2013(12):106-113.
|
| [17] |
汪锁田, 王亚平. 西部省会城市影响力的实证分析[J]. 科技经济市场, 2007(5):62-63.
|
| [18] |
刘彦平. 城市影响力及其测度——基于200个中国城市的实证考察[J]. 城市与环境研究, 2017(1):25-41.
|
| [19] |
林木森, 王道飘, 刘博源, 等. 基于自发式地理信息的武汉市城市热点空间分析[J]. 华中师范大学学报:自然科学版, 2019, 53(1):147-153.
|
| [20] |
段滔, 刘耀林. 基于移动趋势面分析法的城市基准地价评估研究[J]. 武汉大学学报:信息科学版, 2004(6):529-532.
|
| [21] |
汤国安, 杨昕, 等. ArcGIS地理信息系统空间分析实验教程[M]. 北京: 科学出版社, 2012.
|
| [22] |
许陆军. 关于区域经济增长差异及影响因素的具体分析[J]. 纳税, 2019, 13(20):222.
|
| [23] |
吴爱芝, 杨开忠, 李国平. 中国区域经济差异变动的研究综述[J]. 经济地理, 2011, 31(5):705-711.
|
/
| 〈 |
|
〉 |