
Coordination Effect and Dynamic Relationship of Urban Ecological Environment and Tourism Economy:A Case Study of Qujing
Received date: 2019-08-10
Revised date: 2020-04-27
Online published: 2025-04-01
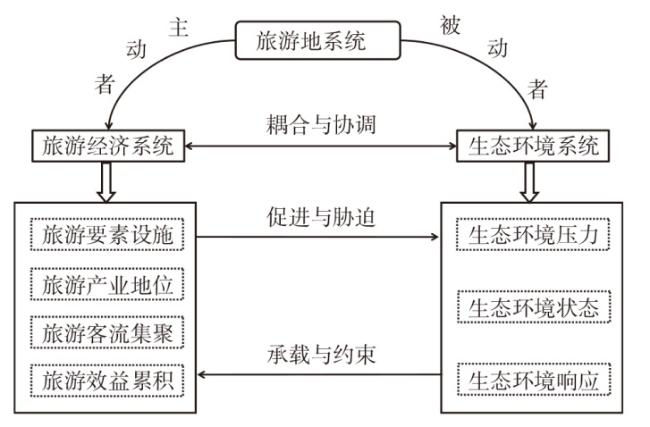
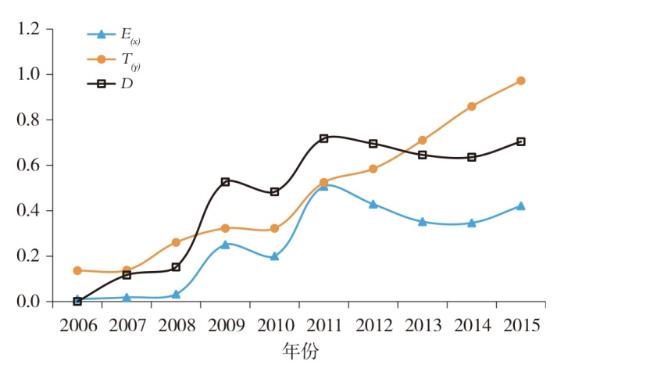
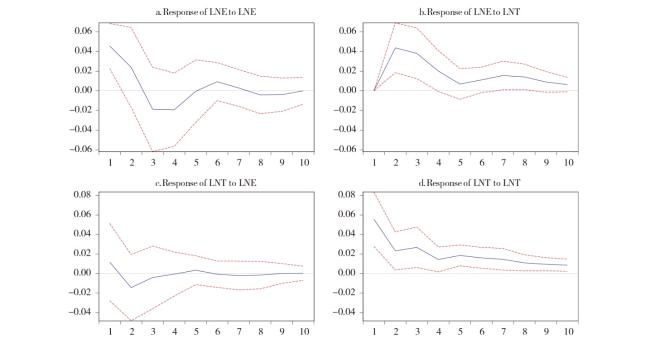
The coordinated development of urban ecological environment and tourism economy is of great significance to the realization of ecological civilization in the region. Taking Qujing City as a case study,as well as based on the analysis of the coupling mechanism between ecological environment and tourism economy,an index system for evaluating the coordinated development of the two is constructed,and the ecological environment is constructed by means of comprehensive power function and coordination degree model of Qujing City from 2006 to 2015. In addition,using the VAR model to verify the long-term dynamic interaction between urban ecological environment and tourism economy. The results show that: 1) From 2006 to 2015,the comprehensive evaluation index of ecological environment and tourism economy in Qujing City showed an overall growth trend,and the evaluation values of ecological environment and tourism economy changed from weak to strong. 2) From 2006 to 2015,The coordination effect of the ecological environment and tourism economy gradually turned from weak to strong of Qujing City,and the overall development showed a good momentum of development;the coupling and coordination phase experienced a"coordinated recession phase(2006-2008)→coordinated transition phase (2009-2010)→coordinated development phase (2011-2015) presents a staged characteristic of a benign coordinated transition. 3) Both the ecological environment and the tourism economy have a long-term equilibrium,and the two are mutually two-way Granger reasons,and the stability of the ecological environment quality is simultaneously influenced by its internal structure. With the dual impact of tourism economy,the stability of tourism economic growth depends to a large extent on its own internal structure and the quality of ecological environment. The response of the later tourism economic system to the ecological environment system tends to be stable,and the impact of the ecological environment on urban tourism development shows persistent characteristics.
GUO Xiangyang , MU Xueqing , DING Zhengshan , MING Qingzhong , LU Baoyi . Coordination Effect and Dynamic Relationship of Urban Ecological Environment and Tourism Economy:A Case Study of Qujing[J]. Economic geography, 2020 , 40(7) : 231 -240 . DOI: 10.15957/j.cnki.jjdl.2020.07.026
表1 生态环境与旅游经济耦合发展评价体系Tab.1 Evaluation system of coupling development of ecological environment and tourism economy |
| 子系统 | 层次(权重) | 指标 | 单位 | 指标性质 | 权重 |
|---|---|---|---|---|---|
| 生态环境系统 | 生态环境压力 (0.3883) | 单位GDP能耗 | 吨标准煤/万元 | 负向 | 0.0594 |
| PM2.5浓度 | μg/m3 | 负向 | 0.0519 | ||
| 工业废水排放量 | 万t | 负向 | 0.0604 | ||
| 工业SO2排放量 | t | 负向 | 0.0500 | ||
| 工业烟尘排放量 | t | 负向 | 0.0614 | ||
| 生态环境状态 (0.3011) | 人均公共绿地面积 | hm2 | 正向 | 0.0804 | |
| 植被覆盖率 | % | 正向 | 0.0308 | ||
| 人均水资源拥有量 | m3 | 正向 | 0.0362 | ||
| 建成区绿化覆盖面积 | hm2 | 正向 | 0.0954 | ||
| 空气质量达到及好于二级的天数 | 天 | 正向 | 0.0690 | ||
| 人均公园绿地面积 | hm2 | 正向 | 0.0300 | ||
| 建成区绿化覆盖率 | % | 正向 | 0.0645 | ||
| 生态环境响应 (0.3106) | 一般工业废物综合利用率 | % | 正向 | 0.0697 | |
| 污水处理厂集中处理率 | % | 正向 | 0.0715 | ||
| 生活垃圾无害化处理率 | % | 正向 | 0.0632 | ||
| 环境污染治理投资总额 | 万元 | 正向 | 0.1347 | ||
| 旅游经济系统 | 旅游效益 (0.3469) | 旅游外汇收入 | 万美元 | 正向 | 0.1010 |
| 国内旅游收入 | 亿元 | 正向 | 0.1362 | ||
| 旅游总收入 | 亿元 | 正向 | 0.1359 | ||
| 旅游规模 (0.2994) | 入境接待人次 | 人次 | 正向 | 0.0881 | |
| 国内旅游接待人次 | 万人次 | 正向 | 0.0857 | ||
| 旅游接待总人次 | 万人次 | 正向 | 0.0830 | ||
| 旅游地位 (0.1739) | 旅游总收入占第三产业产值比重 | % | 正向 | 0.0763 | |
| 旅游总收入占GDP比重 | % | 正向 | 0.0650 | ||
| 旅游从业人员占第三产业从业人员比重 | % | 正向 | 0.0326 | ||
| 旅游设施 (0.1798) | 城市人均公共汽车拥有量 | 辆 | 正向 | 0.0632 | |
| 星级酒店数量 | 家 | 正向 | 0.0416 | ||
| 旅行社数量 | 家 | 正向 | 0.0378 | ||
| 旅游景区数量 | 家 | 正向 | 0.0536 |
表2 曲靖市生态环境与旅游经济综合水平及耦合协调等级划分Tab.2 Comprehensive level of ecological environment and tourism economy coupling coordination of Qujing |
| 年份 | M | D | 协调等级 | 协调阶段 | ||
|---|---|---|---|---|---|---|
| 2006 | 0.0101 | 0.1364 | 0.0683 | 0.0007 | 极度失调 | 协调衰 退阶段 |
| 2007 | 0.0186 | 0.1384 | 0.0785 | 0.1171 | 严重失调 | |
| 2008 | 0.0328 | 0.2607 | 0.1467 | 0.1521 | 严重失调 | |
| 2009 | 0.2507 | 0.3226 | 0.2866 | 0.5270 | 勉强协调 | 协调过 渡阶段 |
| 2010 | 0.2006 | 0.3227 | 0.2616 | 0.4836 | 濒临失调 | |
| 2011 | 0.5076 | 0.5248 | 0.5162 | 0.7183 | 中度协调 | 协调发 展阶段 |
| 2012 | 0.4293 | 0.5848 | 0.5071 | 0.6953 | 初级协调 | |
| 2013 | 0.3522 | 0.7106 | 0.5314 | 0.6461 | 初级协调 | |
| 2014 | 0.3465 | 0.8592 | 0.6028 | 0.6360 | 初级协调 | |
| 2015 | 0.4216 | 0.9726 | 0.6971 | 0.7045 | 中度协调 |
表3 变量单位根检验结果Tab.3 Variable unit root test result |
| 变量 | 统计量 | 1%临界值 | 5%临界值 | 10%临界值 | P值 | 结论 |
|---|---|---|---|---|---|---|
| LNE | -1.8242 | -5.8352 | -4.2465 | -3.5905 | 0.5684 | 非平稳 |
| ΔLNE | -5.0201 | -6.2921 | -4.4504 | -3.7015 | 0.0305 | 平稳 |
| LNT | -3.2484 | -5.5532 | -4.6428 | -3.3695 | 0.1177 | 非平稳 |
| ΔLNT | -8.4881 | -5.8032 | -4.9632 | -3.7102 | 0.0012 | 平稳 |
注:Δ表示变量进行一阶差分。 |
表4 协整检验Tab.4 Cointegration test |
| 原假设 (Null hypothesis) | 迹检验(Trace statistic) | 最大特征值检验(Max-eigen statistic) | |||
|---|---|---|---|---|---|
| 统计量(Statistic) | 临界值(Critical value) | 统计量(Statistic) | 临界值(Critical value) | ||
| 0*** | 49.8202 | 25.8721 | 33.2488 | 19.3870 | |
| 1 | 16.5715 | 12.5179 | 16.5715 | 12.5179 | |
注:“***”表示在1%水平上显著;协整方程有截距,有线性趋势。 |
表5 格兰杰因果关系检验Tab.5 Granger causality test |
| 假设Hypothesis | 最优滞后期 | 样本数 | F统计值 | P值 | 结论 |
|---|---|---|---|---|---|
| LNE不是LNT的格兰杰原因 | 1 | 9 | 8.6549 | 0.0546 | 拒绝原假设 |
| LNT不是LNE的格兰杰原因 | 1 | 9 | 38.4216 | 0.0048 | 拒绝原假设 |
表6 曲靖市生态环境和旅游经济的方差分解表Tab.6 Variance decomposition table of ecological environment and tourism economy of Qujing |
| 周期 | 生态环境方差分解 | 周期 | 旅游经济方差分解 | ||||
|---|---|---|---|---|---|---|---|
| S.E. | LNE | LNT | S.E. | LNE | LNT | ||
| 1 | 0.019 | 100.000 | 0.000 | 1 | 0.024 | 4.272 | 95.728 |
| 2 | 0.029 | 58.051 | 41.949 | 2 | 0.027 | 8.705 | 91.294 |
| 3 | 0.034 | 47.132 | 52.868 | 3 | 0.029 | 7.692 | 92.308 |
| 4 | 0.036 | 47.191 | 52.809 | 4 | 0.030 | 7.376 | 92.624 |
| 5 | 0.037 | 46.874 | 53.126 | 5 | 0.031 | 7.103 | 92.897 |
| 6 | 0.037 | 46.723 | 53.273 | 6 | 0.032 | 6.781 | 93.219 |
| 7 | 0.038 | 45.293 | 54.707 | 7 | 0.032 | 6.603 | 93.397 |
| 8 | 0.038 | 44.255 | 55.745 | 8 | 0.033 | 6.514 | 93.486 |
| 9 | 0.039 | 43.906 | 56.094 | 9 | 0.033 | 6.416 | 93.584 |
| 10 | 0.039 | 43.681 | 56.319 | 10 | 0.034 | 6.339 | 93.661 |
注:LNE表示城市生态环境;LNT表征城市旅游经济。 |
| [1] |
|
| [2] |
|
| [3] |
|
| [4] |
|
| [5] |
|
| [6] |
|
| [7] |
|
| [8] |
|
| [9] |
耿松涛, 谢彦君. 副省级城市旅游经济与生态环境的耦合关系研究[J]. 城市发展研究, 2013, 20(1):91-97.
|
| [10] |
赵鑫. 旅游经济与生态环境耦合关系及协调发展[J]. 财经问题研究, 2014(5):238-240.
|
| [11] |
李淑娟, 李满霞. 我国滨海城市旅游经济与生态环境耦合关系研究[J]. 商业研究, 2016(2):185-192.
|
| [12] |
龚艳, 张阳. 基于耦合模型的旅游-经济-生态环境协调发展——以江苏沿海为例[J]. 社会科学家, 2016(4):107-112.
|
| [13] |
王兆峰, 霍菲菲, 徐赛. 湘鄂渝黔旅游产业与旅游环境耦合协调度变化[J]. 经济地理, 2018, 38(8):204-213.
|
| [14] |
程慧, 徐琼, 郭尧琦. 我国旅游资源开发与生态环境耦合协调发展的时空演变[J]. 经济地理, 2019, 39(7):233-240.
|
| [15] |
周彬, 钟林生, 陈田, 等. 浙江省旅游生态安全的时空格局及障碍因子[J]. 地理科学, 2015, 35(5):599-607.
|
| [16] |
保继刚, 楚义芳. 旅游地理学[M]. 北京: 高等教育出版社, 2014.
|
| [17] |
周彬, 钟林生, 陈田. 基于变权模型的舟山群岛生态安全预警[J]. 应用生态学报, 2015, 26(6):1 854-1 862.
|
| [18] |
|
| [19] |
国家统计局. 中国城市统计年鉴[M]. 北京: 中国统计出版社, 2007—2016.
|
| [20] |
云南省统计局. 云南统计年鉴[M]. 北京: 中国统计出版社, 2007—2016.
|
| [21] |
中国统计信息网. 曲靖市2006-2015年国民经济和社会发展统计公报[EB/OL]. http://www.tjcn.org/tigb/25yn/35199.html.
|
| [22] |
|
| [23] |
郭向阳, 穆学青, 明庆忠, 等. 旅游地快速交通优势度与旅游流强度的空间耦合分析[J]. 地理研究, 2019, 38(5):1 119-1 135.
|
| [24] |
王毅, 丁正山, 余茂军, 等. 基于耦合模型的现代服务业与城市化协调关系量化分析——以江苏省常熟市为例[J]. 地理研究, 2015, 34(1):97-108.
|
| [25] |
靳文凭, 华亮春, 王娟娟. 湖南省交通优势度与县域经济发展水平协调性演变[J]. 经济地理, 2017, 37(2):33-38,67.
|
| [26] |
|
| [27] |
廖进中, 韩峰, 张文静, 等. 长株潭地区城镇化对土地利用效率的影响[J]. 中国人口·资源与环境, 2010, 20(2):30-36.
|
| [28] |
武红, 谷树忠, 关兴良, 等. 中国化石能源消费碳排放与经济增长关系研究[J]. 自然资源学报, 2013, 28(3):381-390.
|
| [29] |
陈浩, 陆林. 都市圈旅游空间研究[M]. 北京: 科学出版社, 2017.
|
/
| 〈 |
|
〉 |
