
Dynamic Evolution and Spatial Differences of Network Attention in Wuzhen Scenic Area
Received date: 2019-08-13
Revised date: 2019-12-29
Online published: 2025-04-01
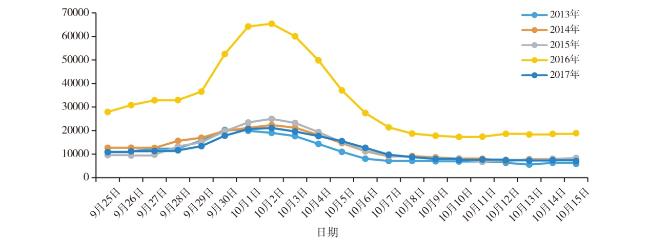
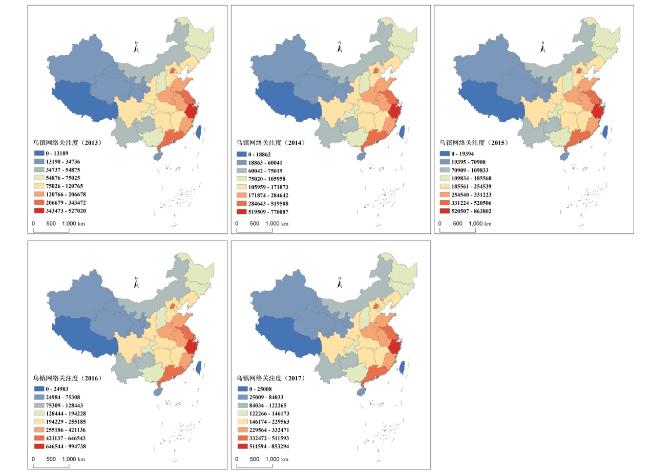
Taking 31 regions of the Chinese mainland as the scope of research,the 'Baidu Index' data sharing platform was used to obtain the Wuzhen scenic area network search index from 2013-2017. The dynamic evolution and spatial difference of network attention of Wuzhen scenic area were analyzed by combining the index of regional economic disparity. The study found that, 1) The overall attention of Wuzhen scenic area shows a fluctuating trend,the second half of the year is more fluctuating than the first half,and the seasonal differences are extremely significant. However,'big events', like variety shows and international events,have caused the tourism flow to basically balance the gap in the light season in recent years. 2) The network attention of each area presents a spatial distribution characteristic,namely higher in the east and lower in the west. What's more,the seasonal differences in regional network attentions are relatively large,and the western region is the most prominent. 3) There are significant differences in the attention of Wuzhen scenic area in the eastern,central and western regions. The difference between regions decreases year by year,and the degree of agglomeration tends to ease. The attention in the region is relatively scattered and the spatial structure is relatively balanced. 4) The spatial and temporal differences in network attention in Wuzhen scenic area are the result of the combined effects of economic development,network development,social and demographic characteristics,climate comfort,and geospatial distance.
XU Yan , LU Lin , ZHAO Hairong . Dynamic Evolution and Spatial Differences of Network Attention in Wuzhen Scenic Area[J]. Economic geography, 2020 , 40(7) : 200 -212 . DOI: 10.15957/j.cnki.jjdl.2020.07.023
表1 2013—2017年全国各月乌镇景区网络关注度指数与季节集中度指数Tab.1 Network attention index and seasonal concentration index of Wuzhen scenic area in every month from 2013 to 2017 |
| 月份 | 网络关注度指数 | 季节集中度指数 | |||||||||
|---|---|---|---|---|---|---|---|---|---|---|---|
| 2013 | 2014 | 2015 | 2016 | 2017 | 2013 | 2014 | 2015 | 2016 | 2017 | ||
| 1月 | 117 804 | 136 688 | 180 894 | 219 895 | 290 653 | 8.22 | 8.37 | 8.22 | 8.26 | 8.76 | |
| 2月 | 166 376 | 211 370 | 260 031 | 369 254 | 274 640 | 7.40 | 7.46 | 7.72 | 7.85 | 7.42 | |
| 3月 | 298 860 | 295 325 | 356 197 | 445 541 | 343 303 | 8.25 | 8.25 | 8.23 | 8.24 | 8.24 | |
| 4月 | 330 870 | 444 968 | 478 183 | 583 475 | 443 474 | 7.96 | 7.99 | 7.94 | 8.07 | 7.98 | |
| 5月 | 259 993 | 348 093 | 333 737 | 505 188 | 354 616 | 8.22 | 8.26 | 8.31 | 7.99 | 8.23 | |
| 6月 | 261 151 | 307 801 | 319 567 | 569 964 | 314 024 | 7.96 | 7.91 | 7.92 | 7.93 | 7.91 | |
| 7月 | 257 801 | 429 759 | 430 858 | 619 957 | 394 094 | 13.34 | 8.22 | 8.22 | 8.21 | 8.21 | |
| 8月 | 216 773 | 369 842 | 442 681 | 583 391 | 495 062 | 8.22 | 8.23 | 8.24 | 8.22 | 8.24 | |
| 9月 | 282 353 | 347 205 | 335 254 | 719 148 | 383 785 | 8.06 | 7.98 | 7.98 | 8.07 | 7.94 | |
| 10月 | 234 332 | 491 305 | 309 376 | 743 417 | 293 132 | 8.69 | 10.75 | 8.65 | 8.79 | 8.55 | |
| 11月 | 137 773 | 309 261 | 154 835 | 453 415 | 192 098 | 7.93 | 8.21 | 7.92 | 8.09 | 7.91 | |
| 12月 | 114 216 | 180 372 | 621 275 | 247 789 | 286 402 | 8.22 | 8.25 | 10.83 | 8.37 | 9.21 | |
| 全国 | 2 678 302 | 3 871 989 | 4 222 888 | 6 060 434 | 4 065 283 | 2.61 | 2.65 | 2.92 | 2.63 | 1.93 | |
表2 2013—2017年全国各地区乌镇景区网络关注度指数与季节集中度指数Tab.2 Network attention index and seasonal concentration index of Wuzhen scenic area in different cities of mainland China from 2013 to 2017 |
| 地区 | 网络关注度指数 | 季节集中度指数 | |||||||||
|---|---|---|---|---|---|---|---|---|---|---|---|
| 2013 | 2014 | 2015 | 2016 | 2017 | 2013 | 2014 | 2015 | 2016 | 2017 | ||
| 北京 | 206 678(5) | 381 314(4) | 329 828(6) | 421 136(5) | 332 471(5) | 2.54 | 2.80 | 2.37 | 1.75 | 1.29 | |
| 天津 | 95 919(13) | 135 895(15) | 139 681(17) | 194 228(17) | 122 265(20) | 2.28 | 1.40 | 1.91 | 2.52 | 1.22 | |
| 河北 | 105 237(11) | 171 873(10) | 211 776(10) | 316 060(11) | 229 563(12) | 2.74 | 1.77 | 2.29 | 2.03 | 1.54 | |
| 辽宁 | 97 290(12) | 141 067(14) | 167 809(14) | 239 212(16) | 194 160(14) | 2.38 | 1.26 | 1.76 | 1.96 | 1.57 | |
| 上海 | 283 608(3) | 409 488(3) | 457 876(3) | 509 364(4) | 467 488(3) | 2.78 | 1.79 | 1.63 | 1.29 | 1.04 | |
| 江苏 | 343 472(2) | 519 508(2) | 520 506(2) | 646 543(2) | 511 593(2) | 3.28 | 1.89 | 1.80 | 2.12 | 1.60 | |
| 浙江 | 527 020(1) | 770 087(1) | 863 802(1) | 994 738(1) | 853 294(1) | 3.06 | 1.70 | 2.30 | 2.21 | 1.80 | |
| 福建 | 151 745(8) | 221 269(8) | 235 416(9) | 321 411(10) | 271 351(10) | 3.20 | 1.79 | 2.16 | 2.25 | 2.00 | |
| 山东 | 172 336(6) | 284 642(6) | 331 223(5) | 403 196(6) | 324 255(7) | 2.93 | 1.99 | 2.34 | 1.86 | 1.35 | |
| 广东 | 244 330(4) | 359 830(5) | 421 577(4) | 523 014(3) | 423 737(4) | 3.01 | 1.65 | 2.20 | 1.75 | 0.97 | |
| 海南 | 41 551(28) | 53 863(28) | 58 129(28) | 68 556(28) | 64 340(28) | 2.76 | 0.71 | 1.75 | 1.36 | 0.82 | |
| 山西 | 75 025(18) | 105 958(18) | 127 248(18) | 192 356(18) | 146 173(18) | 3.08 | 1.31 | 2.25 | 2.40 | 1.41 | |
| 吉林 | 61 522(22) | 89 124(21) | 99 181(21) | 147 421(21) | 121 783(21) | 2.65 | 1.18 | 1.63 | 1.84 | 1.37 | |
| 黑龙江 | 65 651(19) | 97 274(19) | 109 833(19) | 161 880(19) | 132 047(19) | 2.43 | 1.16 | 1.64 | 1.82 | 1.40 | |
| 安徽 | 143 082(9) | 227 527(7) | 254 539(8) | 326 802(9) | 288 629(9) | 3.20 | 2.51 | 2.60 | 2.36 | 2.39 | |
| 江西 | 90 622(17) | 141 086(13) | 162 480(16) | 239 314(15) | 184 565(15) | 3.17 | 2.02 | 2.35 | 2.73 | 2.09 | |
| 河南 | 154 370(7) | 239 195(6) | 302 330(7) | 400 871(7) | 324 641(6) | 3.31 | 2.23 | 2.71 | 2.25 | 1.95 | |
| 湖北 | 120 765(10) | 170 757(11) | 199 282(11) | 300 385(13) | 223 555(13) | 3.33 | 2.09 | 2.47 | 2.59 | 2.14 | |
| 湖南 | 95 032(14) | 143 244(12) | 164 506(15) | 255 185(14) | 323 709(8) | 3.12 | 1.82 | 2.12 | 2.65 | 1.95 | |
| 四川 | 93 758(15) | 128 789(17) | 185 560(12) | 341 026(8) | 259 065(11) | 2.96 | 1.57 | 2.90 | 2.12 | 2.34 | |
| 重庆 | 62 101(21) | 90 442(20) | 103 843(20) | 157 817(20) | 182 341(17) | 2.84 | 1.36 | 1.61 | 2.50 | 4.04 | |
| 贵州 | 51 945(25) | 67 705(25) | 79 467(25) | 109 048(25) | 105 623(24) | 2.81 | 1.02 | 1.65 | 2.08 | 2.15 | |
| 云南 | 54 875(23) | 74 892(24) | 84 717(24) | 119 421(24) | 120 229(22) | 2.92 | 1.06 | 1.84 | 1.95 | 3.28 | |
| 西藏 | 13 189(31) | 18 862(31) | 19 394(31) | 24 983(31) | 25 008(31) | 3.59 | 1.99 | 2.83 | 1.58 | 1.39 | |
| 陕西 | 93 312(16) | 133 253(16) | 169 119(13) | 310 482(12) | 182 586(16) | 3.29 | 1.46 | 2.48 | 2.22 | 1.65 | |
| 甘肃 | 44 709(27) | 60 041(26) | 70 908(26) | 93 557(26) | 80 219(27) | 2.79 | 0.82 | 1.81 | 1.70 | 1.02 | |
| 青海 | 27 893(30) | 38 612(30) | 40 486(30) | 48 366(30) | 41 014(30) | 3.28 | 0.93 | 0.91 | 1.32 | 1.14 | |
| 宁夏 | 34 736(29) | 44 365(29) | 45 422(29) | 57 175(29) | 47 595(29) | 2.99 | 0.70 | 1.50 | 1.70 | 1.35 | |
| 新疆 | 45 685(26) | 59 362(27) | 63 644(27) | 75 308(27) | 84 033(26) | 2.73 | 0.62 | 1.55 | 1.10 | 2.27 | |
| 广西 | 64 060(20) | 86 618(22) | 96 833(22) | 128 443(22) | 109 203(23) | 2.72 | 1.13 | 2.06 | 1.80 | 1.55 | |
| 内蒙古 | 52 795(24) | 75 019(23) | 87 042(23) | 128 102(23) | 102 238(25) | 2.72 | 0.96 | 1.59 | 1.95 | 0.98 | |
注:括号中数值代表该地区乌镇景区网络关注度的规模序位。 |
表3 2013—2017年全国乌镇景区网络关注度的省域间差异和三大区域间差异Tab.3 The difference between provinces and three regions of the network attention in Wuzhen scenic area (2013-2017) |
| 年份 | 省域间差异 | 三大区域间差异 | |||||||
|---|---|---|---|---|---|---|---|---|---|
| CV | H | P | G | CV | H | P | G | ||
| 2013 | 0.8840 | 0.0575 | 1.5344 | 23.9722 | 0.5914 | 0.4499 | 2.8151 | 67.0771 | |
| 2014 | 0.8986 | 0.0583 | 1.4823 | 24.1475 | 0.6177 | 0.4605 | 2.8405 | 67.8628 | |
| 2015 | 0.8692 | 0.0566 | 1.6595 | 23.7963 | 0.5757 | 0.4438 | 2.6332 | 66.6200 | |
| 2016 | 0.7592 | 0.0509 | 1.5385 | 22.5504 | 0.4887 | 0.4130 | 2.2910 | 62.2614 | |
| 2017 | 0.7641 | 0.0511 | 1.6679 | 22.6040 | 0.4687 | 0.4066 | 2.1744 | 63.7615 | |
表4 2013—2017年全国乌镇景区网络关注度的区域内差异Tab.4 Regional internal differences in network attention of Wuzhen scenic area from 2013 to 2017 |
| 年份 | CV | H | P | G | |||||||||||
|---|---|---|---|---|---|---|---|---|---|---|---|---|---|---|---|
| 东部 | 中部 | 西部 | 东部 | 中部 | 西部 | 东部 | 中部 | 西部 | 东部 | 中部 | 西部 | ||||
| 2013 | 0.648 | 0.326 | 0.426 | 0.129 | 0.138 | 0.098 | 1.534 | 1.079 | 1.005 | 35.876 | 37.187 | 31.374 | |||
| 2014 | 0.735 | 0.353 | 0.442 | 0.127 | 0.141 | 0.100 | 1.482 | 1.051 | 1.035 | 35.586 | 37.490 | 31.563 | |||
| 2015 | 0.630 | 0.376 | 0.536 | 0.127 | 0.143 | 0.107 | 1.660 | 1.188 | 1.097 | 35.638 | 37.773 | 32.746 | |||
| 2016 | 0.567 | 0.321 | 0.707 | 0.120 | 0.138 | 0.125 | 1.539 | 1.227 | 1.098 | 34.658 | 37.136 | 35.346 | |||
| 2017 | 0.604 | 0.364 | 0.580 | 0.124 | 0.142 | 0.111 | 1.668 | 1.00 | 1.419 | 35.227 | 37.627 | 33.375 | |||
表5 乌镇景区网络关注度时空分异的影响因素相关性分析Tab.5 Correlation analysis of influencing factors of time and space differentiation of network attention in Wuzhen scenic area |
| 影响因素 | 乌镇景区网络关注度 | |||
|---|---|---|---|---|
| Pearson相关性 | 显著性(双尾) | |||
| 经济发展水平 | GDP规模 | 0.338 | 0.063 | |
| 人均GDP | 0.581** | 0.001 | ||
| 网络发达程度 | 互联网普及率 | 0.474** | 0.007 | |
| 网民数量 | 0.637** | 0.000 | ||
| 社会人口统计特征 | 文化程度 | 初中 | 0.088 | 0.639 |
| 高中 | 0.307 | 0.093 | ||
| 大专及以上 | 0.240 | 0.193 | ||
| 年龄结构 | 0~14岁 | -0.398* | 0.026 | |
| 15~64岁 | 0.120 | 0.520 | ||
| 65岁及以上 | 0.496** | 0.005 | ||
| 气候舒适度 | 平均气温 | 0.611* | 0.035 | |
| 相对湿度 | 0.383 | 0.219 | ||
| 地理空间距离 | 两地间的距离 | -0.696** | 0.000 | |
注:*表示显著性水平为0.05;**表示显著性水平为0.01。文化程度与年龄结构使用比例指标表征。 |
| [1] |
李金早. 相融相盛健康同行——大力促进我国“旅游+互联网”又好又快发展[N]. 新华网, 2015-09-21.
|
| [2] |
|
| [3] |
|
| [4] |
|
| [5] |
|
| [6] |
严江平, 宋志江, 李巍. 广州市旅游景区网络关注度时空特征研究[J]. 资源开发与市场, 2018, 34(1):86-93,22.
|
| [7] |
丁鑫, 汪京强, 李勇泉. 基于百度指数的旅游目的地网络关注度时空特征与影响因素研究——以厦门市为例[J]. 资源开发与市场, 2018, 34(5):709-714.
|
| [8] |
|
| [9] |
|
| [10] |
黄先开, 张丽峰, 丁于思. 百度指数与旅游景区游客量的关系及预测研究——以北京故宫为例[J]. 旅游学刊, 2013, 28(11):93-100.
|
| [11] |
|
| [12] |
刘嘉毅, 陈玲, 陈玉萍. 旅游舆情网络关注度时空演变特征与影响因素[J]. 地域研究与开发, 2019, 38(1):88-94.
|
| [13] |
冷林燕, 郑向敏. 日本旅游安全网络关注度区域差异性及其影响因素分析[J]. 旅游研究, 2018, 10(4):67-76.
|
| [14] |
何小芊, 刘宇, 吴发明. 基于百度指数的温泉旅游网络关注度时空特征研究[J]. 地域研究与开发, 2017, 36(1):103-108,124.
|
| [15] |
陆林, 鲍捷. 基于耗散结构理论的千岛湖旅游地演化过程及机制[J]. 地理学报, 2010, 65(6):755-768.
|
| [16] |
李霞, 曲洪建. 邮轮旅游网络关注度的时空特征和影响因素——基于百度指数的研究[J]. 统计与信息论坛, 2016, 31(4):101-106.
|
| [17] |
郑玉莲, 陆林, 赵海溶. 芜湖方特网络关注度分布特征及与客流量关系研究——以PC端和移动端百度指数为例[J]. 资源开发与市场, 2018, 34(9):1 315-1 320.
|
| [18] |
邹永广, 林炜铃, 郑向敏. 旅游安全网络关注度时空特征及其影响因素[J]. 旅游学刊, 2015, 30(2):101-109.
|
| [19] |
林志慧, 马耀峰, 刘宪锋, 等. 旅游景区网络关注度时空分布特征分析[J]. 资源科学, 2012, 34(12):2 427-2 433.
|
| [20] |
张春慧, 洪晓. 三大古城网络关注度时空分布及其影响因素研究[J]. 资源开发与市场, 2018, 34(5):703-708.
|
| [21] |
李山, 邱荣旭, 陈玲. 基于百度指数的旅游景区络空间关注度:时间分布及其前兆效应[J]. 地理与地理信息科学, 2008(6):102-107.
|
| [22] |
马丽君, 孙根年, 黄芸玛, 等. 城市国内客流量与游客网络关注度时空相关分析[J]. 经济地理, 2011, 31(4):680-685.
|
| [23] |
中青旅控股股份有限公司. 中青旅控股股份有限公司2017年年度报告[R]. 2017.
|
| [24] |
|
/
| 〈 |
|
〉 |