
The Evolution of Regional Economic Disparity in the Yellow River Basin at Different Spatial Scales
Received date: 2020-02-15
Revised date: 2020-05-28
Online published: 2025-04-01
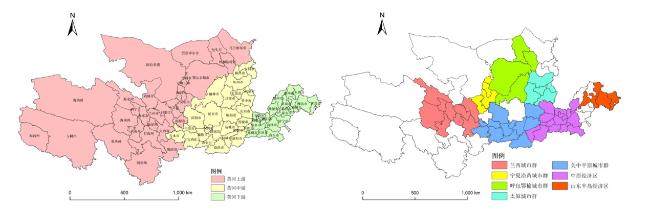
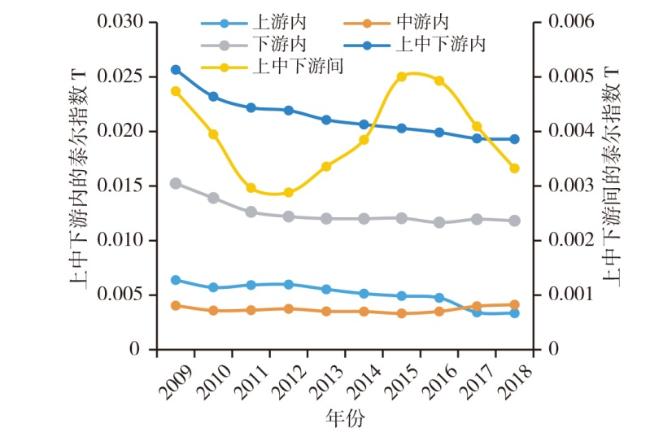
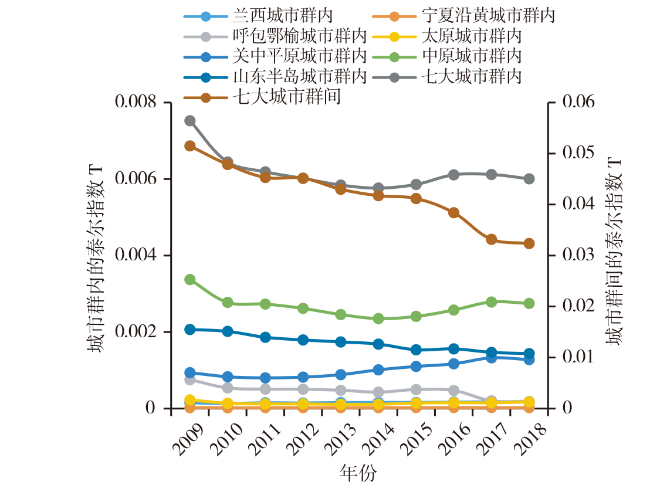
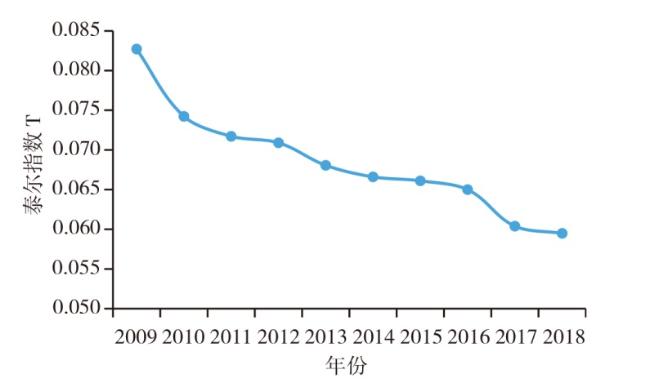
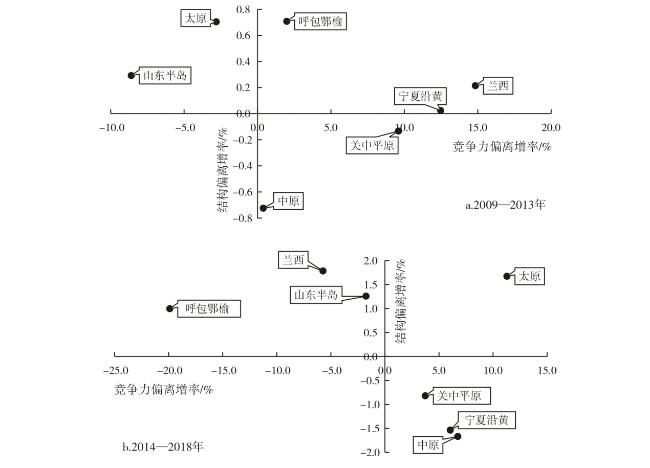
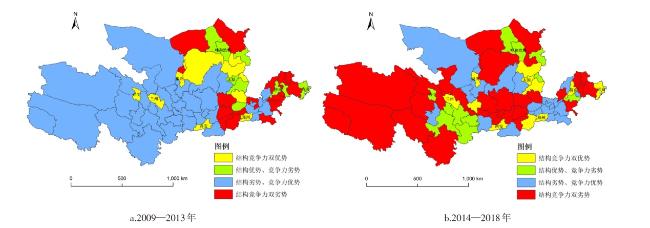
The Yellow River Basin is an important economic zone in China and plays a very important role in the economic and social development of the country. Based on Theil index decomposition method,shift-share analysis method and GIS analysis technology,this paper studies the evolution of regional economic disparity in the Yellow River Basin from 2009 to 2018 separately from the three different spatial scales,including upper,middle and lower reaches of the Yellow River Basin,seven major urban agglomerations along the Yellow River,and 73 cities (referred to a prefecture-level city,state,or alliance). The results of Theil index decomposition method show that from 2009 to 2018,the contribution of economic disparity of the upper,middle,and lower reaches of the Yellow River Basin has exceeded 80%,but the absolute disparity has been decreasing year by year; The contribution of the economic disparity among the seven major urban agglomerations along the Yellow River is nearly 90% while the absolute disparity is shrinking significantly; The economic disparity among cities in the Yellow River Basin is shrinking year by year. The results of shift-share analysis method show that comparing between 2009-2013 and 2014-2018,the upper reaches of the Yellow River Basin lost their industrial competitiveness advantage,the middle reaches lost their industrial structure advantages,and the industrial structure and competitiveness changed from inferior to better in the lower reaches; The dual advantages of industrial structure and competitiveness of the urban agglomerations in the upper reaches of the Yellow River Basin have been changed,and the competitive advantages of the three major industries of the urban agglomerations along the Yellow River in Ningxia have been maintained; The metropolitan circle with the central city as the core in the Yellow River Basin has basically formed. Therefore,the coordinated and high-quality development of the regional economy of the Yellow River Basin should be promoted collaboratively from multiple spatial scales,including upper,middle and lower reaches,urban agglomerations,and cities.
ZHANG Keyun , ZHANG Ying . The Evolution of Regional Economic Disparity in the Yellow River Basin at Different Spatial Scales[J]. Economic geography, 2020 , 40(7) : 1 -11 . DOI: 10.15957/j.cnki.jjdl.2020.07.001
表1 黄河流域上中下游间/内经济差异的泰尔指数分解及其对区域总体经济差异的贡献率Tab.1 Theil index decomposition of the economic disparities between and within the upper,middle and lower reaches of the Yellow River Basin and their contribution rate to the overall regional economic disparity |
| 年份 | 上游内 | 中游内 | 下游内 | 上中下游内 | 上中下游间 | |||||||||
|---|---|---|---|---|---|---|---|---|---|---|---|---|---|---|
| T | G/% | T | G/% | T | G/% | T | G/% | T | G/% | |||||
| 2009 | 0.0064 | 20.99 | 0.0040 | 13.29 | 0.0152 | 50.13 | 0.0257 | 84.41 | 0.0047 | 15.59 | ||||
| 2010 | 0.0057 | 21.03 | 0.0036 | 13.23 | 0.0139 | 51.20 | 0.0232 | 85.46 | 0.0039 | 14.54 | ||||
| 2011 | 0.0059 | 23.55 | 0.0036 | 14.42 | 0.0126 | 50.23 | 0.0222 | 88.20 | 0.0030 | 11.80 | ||||
| 2012 | 0.0060 | 24.08 | 0.0037 | 15.09 | 0.0122 | 49.20 | 0.0219 | 88.38 | 0.0029 | 11.62 | ||||
| 2013 | 0.0055 | 22.64 | 0.0035 | 14.41 | 0.0120 | 49.19 | 0.0211 | 86.25 | 0.0034 | 13.75 | ||||
| 2014 | 0.0051 | 21.00 | 0.0035 | 14.26 | 0.0120 | 49.03 | 0.0206 | 84.29 | 0.0038 | 15.71 | ||||
| 2015 | 0.0049 | 19.45 | 0.0033 | 13.14 | 0.0120 | 47.63 | 0.0203 | 80.22 | 0.0050 | 19.78 | ||||
| 2016 | 0.0048 | 19.13 | 0.0035 | 14.10 | 0.0117 | 46.94 | 0.0199 | 80.16 | 0.0049 | 19.84 | ||||
| 2017 | 0.0034 | 14.59 | 0.0040 | 17.00 | 0.0119 | 50.95 | 0.0194 | 82.54 | 0.0041 | 17.46 | ||||
| 2018 | 0.0033 | 14.80 | 0.0041 | 18.23 | 0.0118 | 52.28 | 0.0193 | 85.31 | 0.0033 | 14.69 | ||||
注:T为泰尔指数的值,G为相应的贡献率。 |
表2 七大沿黄城市群间/内经济差异对七大沿黄城市群总体差异的贡献率(单位:%)Tab.2 Contribution rate of economic disparities between and within the seven major urban agglomerations along the Yellow River to the overall disparities in the seven major urban agglomerations along the Yellow River (unit:%) |
| 年份 | 兰西 城市群 | 宁夏沿黄 城市群 | 呼包鄂榆 城市群 | 太原 城市群 | 关中平原 城市群 | 中原 城市群 | 山东半岛 城市群 | 七大 城市群内 | 七大 城市群间 |
|---|---|---|---|---|---|---|---|---|---|
| 2009 | 0.25 | 0.04 | 1.28 | 0.38 | 1.59 | 5.71 | 3.50 | 12.75 | 87.25 |
| 2010 | 0.24 | 0.03 | 0.99 | 0.25 | 1.53 | 5.11 | 3.71 | 11.87 | 88.13 |
| 2011 | 0.29 | 0.04 | 0.98 | 0.23 | 1.55 | 5.30 | 3.61 | 12.01 | 87.99 |
| 2012 | 0.28 | 0.04 | 0.98 | 0.23 | 1.60 | 5.11 | 3.50 | 11.76 | 88.24 |
| 2013 | 0.32 | 0.05 | 0.97 | 0.22 | 1.81 | 5.03 | 3.56 | 11.96 | 88.04 |
| 2014 | 0.33 | 0.05 | 0.90 | 0.23 | 2.13 | 4.95 | 3.54 | 12.13 | 87.87 |
| 2015 | 0.34 | 0.05 | 1.05 | 0.30 | 2.34 | 5.12 | 3.26 | 12.46 | 87.54 |
| 2016 | 0.37 | 0.05 | 1.05 | 0.34 | 2.63 | 5.79 | 3.50 | 13.73 | 86.27 |
| 2017 | 0.44 | 0.06 | 0.51 | 0.37 | 3.37 | 7.09 | 3.73 | 15.57 | 84.43 |
| 2018 | 0.43 | 0.06 | 0.48 | 0.45 | 3.33 | 7.17 | 3.74 | 15.66 | 84.34 |
表3 黄河流域上中下游总体经济的偏离—份额分析表Tab.3 Shift-share analysis of the overall economy of the upper,middle and lower reaches of the Yellow River Basin |
| 研究时段 | 区域 | 总增长 | 全流域分量 | 结构偏离分量 | 竞争力偏离分量 | 总偏离 | |||||||||
|---|---|---|---|---|---|---|---|---|---|---|---|---|---|---|---|
| 增量(亿元) | 增率(%) | 增量(亿元) | 增率(%) | 增量(亿元) | 增率(%) | 增量(亿元) | 增率(%) | 增量(亿元) | 增率(%) | ||||||
| 2009—2013 | 上游 | 6 347.58 | 53.34 | 5 920.23 | 49.75 | 49.55 | 0.42 | 377.80 | 3.17 | 427.35 | 3.59 | ||||
| 中游 | 10 710.12 | 54.11 | 9 846.39 | 49.75 | 10.07 | 0.05 | 853.66 | 4.31 | 863.73 | 4.36 | |||||
| 下游 | 15 236.84 | 45.86 | 16 527.92 | 49.75 | -59.62 | -0.18 | -1 231.46 | -3.71 | -1 291.08 | -3.89 | |||||
| 2014—2018 | 上游 | 1 499.51 | 8.00 | 3 939.22 | 21.02 | 185.35 | 0.99 | -2 625.07 | -14.01 | -2 439.71 | -13.02 | ||||
| 中游 | 7 948.47 | 25.25 | 6 616.62 | 21.02 | -265.60 | -0.84 | 1 597.44 | 5.07 | 1 331.84 | 4.23 | |||||
| 下游 | 11 907.85 | 23.17 | 10 799.98 | 21.02 | 80.24 | 0.16 | 1 027.62 | 2.00 | 1 107.87 | 2.16 | |||||
表4 黄河流域上中下游三次产业的偏离—份额分析Tab.4 Details of shift-share analysis of the three industries in the upper,middle and lower reaches of the Yellow River Basin |
| 研究时段 | 区域 | 全流域分量(亿元) | 结构偏离分量(亿元) | 竞争力偏离分量(亿元) | ||||||||
|---|---|---|---|---|---|---|---|---|---|---|---|---|
| 第一产业 | 第二产业 | 第三产业 | 第一产业 | 第二产业 | 第三产业 | 第一产业 | 第二产业 | 第三产业 | ||||
| 2009-2013 | 上游 | 433.01 | 3 007.63 | 2 479.59 | -95.86 | -114.97 | 260.39 | 61.14 | 331.37 | -14.71 | ||
| 中游 | 778.48 | 5 374.38 | 3 693.53 | -172.35 | -205.45 | 387.87 | 218.14 | 1 415.70 | -780.19 | |||
| 下游 | 1 511.62 | 9 088.67 | 5 927.63 | -334.66 | -347.43 | 622.47 | -279.28 | -1 747.07 | 794.89 | |||
| 2014-2018 | 上游 | 267.47 | 1 900.42 | 1 771.33 | -232.59 | -1 129.77 | 1 547.71 | 85.01 | -1 422.07 | -1 288.01 | ||
| 中游 | 506.13 | 3 517.51 | 2 592.98 | -440.13 | -2 091.11 | 2 265.64 | 15.25 | 513.99 | 1 068.20 | |||
| 下游 | 829.47 | 5 387.57 | 4 582.93 | -721.30 | -3 202.82 | 4 004.37 | -100.27 | 908.08 | 219.81 | |||
表5 七大沿黄城市群总体经济的偏离—份额分析Tab.5 Shift-share analysis of the seven major urban agglomerations along the Yellow River |
| 研究时段 | 城市群 | 总增长 | 七大城市群分量 | 结构偏离分量 | 竞争力偏离分量 | 总偏离 | |||||||||
|---|---|---|---|---|---|---|---|---|---|---|---|---|---|---|---|
| 增量 (亿元) | 增率 (%) | 增量 (亿元) | 增率 (%) | 增量 (亿元) | 增率 (%) | 增量 (亿元) | 增率 (%) | 增量 (亿元) | 增率 (%) | ||||||
| 2009—2013 | 兰西城市群 | 1 433.80 | 65.50 | 1 104.33 | 50.45 | 4.70 | 0.21 | 324.76 | 14.84 | 329.46 | 15.05 | ||||
| 宁夏沿黄城市群 | 785.64 | 62.94 | 629.68 | 50.45 | 0.30 | 0.02 | 155.66 | 12.47 | 155.96 | 12.49 | |||||
| 呼包鄂榆城市群 | 3 866.74 | 53.14 | 3 670.48 | 50.45 | 51.49 | 0.71 | 144.78 | 1.99 | 196.27 | 2.70 | |||||
| 太原城市群 | 1 687.70 | 48.34 | 1 761.38 | 50.45 | 24.59 | 0.70 | -98.27 | -2.81 | -73.68 | -2.11 | |||||
| 关中平原城市群 | 4 593.35 | 59.91 | 3 867.87 | 50.45 | -10.19 | -0.13 | 735.68 | 9.59 | 725.48 | 9.46 | |||||
| 中原城市群 | 8 020.64 | 50.11 | 8 073.92 | 50.45 | -115.92 | -0.72 | 62.64 | 0.39 | -53.28 | -0.33 | |||||
| 山东半岛城市群 | 6 491.58 | 42.14 | 7 771.79 | 50.45 | 45.04 | 0.29 | -1 325.25 | -8.60 | -1 280.21 | -8.31 | |||||
| 2014—2018 | 兰西城市群 | 722.57 | 18.71 | 874.85 | 22.66 | 68.92 | 1.78 | -221.20 | -5.73 | -152.28 | -3.94 | ||||
| 宁夏沿黄城市群 | 579.70 | 27.16 | 483.53 | 22.66 | -32.74 | -1.53 | 128.91 | 6.04 | 96.17 | 4.51 | |||||
| 呼包鄂榆城市群 | 429.73 | 3.76 | 2 588.54 | 22.66 | 113.96 | 1.00 | -2 272.78 | -19.89 | -2 158.81 | -18.90 | |||||
| 太原城市群 | 1 826.47 | 35.61 | 1 162.01 | 22.66 | 85.86 | 1.67 | 578.60 | 11.28 | 664.46 | 12.96 | |||||
| 关中平原城市群 | 3 357.41 | 25.57 | 2 974.83 | 22.66 | -107.46 | -0.82 | 490.04 | 3.73 | 382.58 | 2.91 | |||||
| 中原城市群 | 7 005.41 | 27.73 | 5 723.72 | 22.66 | -421.04 | -1.67 | 1 702.73 | 6.74 | 1 281.70 | 5.07 | |||||
| 山东半岛城市群 | 5 149.67 | 22.17 | 5 263.47 | 22.66 | 292.50 | 1.26 | -406.30 | -1.75 | -113.80 | -0.49 | |||||
表6 七大沿黄城市群三次产业的偏离—份额分析Tab.6 Details of shift-share analysis of the three industries in the seven major agglomerations along the Yellow River |
| 研究时段 | 城市群 | 七大城市群分量(亿元) | 结构偏离分量(亿元) | 竞争力偏离分量(亿元) | ||||||||
|---|---|---|---|---|---|---|---|---|---|---|---|---|
| 第一产业 | 第二产业 | 第三产业 | 第一产业 | 第二产业 | 第三产业 | 第一产业 | 第二产业 | 第三产业 | ||||
| 2009—2013 | 兰西城市群 | 103.12 | 502.44 | 498.77 | -24.74 | -12.73 | 42.17 | 23.75 | 225.84 | 75.18 | ||
| 宁夏沿黄城市群 | 52.19 | 327.63 | 249.86 | -12.52 | -8.30 | 21.12 | 8.63 | 141.43 | 5.60 | |||
| 呼包鄂榆城市群 | 133.24 | 1962.17 | 1 575.06 | -31.97 | -49.70 | 133.16 | 38.39 | 122.90 | -16.51 | |||
| 太原城市群 | 86.31 | 876.59 | 798.47 | -20.71 | -22.20 | 67.50 | 2.08 | 146.50 | -246.84 | |||
| 关中平原城市群 | 411.67 | 1 853.18 | 1 603.02 | -98.77 | -46.94 | 135.52 | 183.86 | 841.54 | -289.72 | |||
| 中原城市群 | 882.96 | 4 659.99 | 2 530.97 | -211.85 | -118.03 | 213.97 | -211.13 | 99.13 | 174.63 | |||
| 山东半岛城市群 | 444.87 | 4 256.32 | 3 070.60 | -106.74 | -107.81 | 259.59 | -45.58 | -1 577.33 | 297.67 | |||
| 2014—2018 | 兰西城市群 | 70.21 | 378.26 | 426.38 | -67.36 | -208.78 | 345.06 | -2.16 | -244.28 | 25.24 | ||
| 宁夏沿黄城市群 | 33.10 | 268.52 | 181.92 | -31.75 | -148.21 | 147.22 | 28.24 | 43.15 | 57.52 | |||
| 呼包鄂榆城市群 | 90.42 | 1 337.72 | 1 160.40 | -86.75 | -738.36 | 939.08 | 68.37 | -934.95 | -1 406.20 | |||
| 太原城市群 | 56.39 | 554.49 | 551.13 | -54.10 | -306.06 | 446.01 | -9.29 | 440.14 | 147.75 | |||
| 关中平原城市群 | 300.00 | 1 457.73 | 1 217.10 | -287.82 | -804.60 | 984.97 | 18.36 | 41.53 | 430.16 | |||
| 中原城市群 | 506.52 | 3 054.01 | 2 163.19 | -485.96 | -1 685.68 | 1 750.61 | -111.86 | 585.94 | 1 228.64 | |||
| 山东半岛城市群 | 262.73 | 2 572.97 | 2 427.77 | -252.07 | -1 420.17 | 1 964.73 | 8.34 | 68.46 | -483.10 | |||
| [1] |
习近平. 在黄河流域生态保护和高质量发展座谈会上的讲话[J]. 求是, 2019(20):4-11.
|
| [2] |
习近平. 在中央财经委员会第六次会议上的讲话[EB/OL]. www.gov.cn/xinwen/2020-01/03/content_5466363.htm, 2020-01-03.
|
| [3] |
张学波, 于伟, 张亚利, 等. 京津冀地区经济增长的时空分异与影响因素[J]. 地理学报, 2018, 73(10):1985-2 000.
|
| [4] |
戴其文, 魏也华, 宁越敏. 欠发达省域经济差异的时空演变分析[J]. 经济地理, 2015, 35(2):14-21,29.
|
| [5] |
覃成林, 崔聪慧. 粤港澳大湾区协调发展水平评估及其提升策略[J]. 改革, 2019(2):56-63.
|
| [6] |
茹乐峰, 张改素, 丁志伟, 等. 我国西部地区市域经济的时空差异研究[J]. 地域研究与开发, 2014, 33(2):54-59,134.
|
| [7] |
纪小美, 付业勤, 陶卓民, 等. 福建省县域经济差异的时空动态与变迁机制[J]. 经济地理, 2016, 36(2):36-44.
|
| [8] |
丁志伟, 黄逦茗, 谢慧钰, 等. 中原城市群镇域经济空间格局及其影响因素[J]. 经济地理, 2019, 39(11):60-68.
|
| [9] |
丁志国, 张洋, 高启然. 基于区域经济差异的影响农村经济发展的农村金融因素识别[J]. 中国农村经济, 2014(3):4-13,26.
|
| [10] |
王冰, 程婷. 中国中部六大城市群经济增长的差异性和收敛性[J]. 城市问题, 2015(3):11-17,104.
|
| [11] |
王青, 金春. 中国城市群经济发展水平不平衡的定量测度[J]. 数量经济技术经济研究, 2018, 35(11):77-94.
|
| [12] |
晁静, 赵新正, 李同昇, 等. 长江经济带三大城市群经济差异演变及影响因素——基于多源灯光数据的比较研究[J]. 经济地理, 2019, 39(5):92-100.
|
| [13] |
王喜, 秦耀辰, 鲁丰先, 等. 黄河中下游地区主要省份低碳经济发展水平的时空差异研究[J]. 地理科学进展, 2013, 32(4):505-513.
|
| [14] |
王开泳, 张鹏岩, 丁旭生. 黄河流域旅游经济的时空分异与R/S分析[J]. 地理科学, 2014, 34(3):295-301.
|
| [15] |
周晓艳, 郝慧迪, 叶信岳, 等. 黄河流域区域经济差异的时空动态分析[J]. 人文地理, 2016, 31(5):119-125.
|
| [16] |
刘海龙, 张研, 李丽琴. 晋陕豫黄河金三角地区经济发展差异及时空演变机制分析[J]. 安徽师范大学学报:自然科学版, 2018, 41(2):170-176.
|
| [17] |
刘晨光, 乔家君. 黄河流域农村经济差异及空间演化[J]. 地理科学进展, 2016, 35(11):1329-1 339.
|
| [18] |
|
| [19] |
盖美, 张丽平, 田成诗. 环渤海经济区经济增长的区域差异及空间格局演变[J]. 经济地理, 2013, 33(4):22-28.
|
| [20] |
张改素, 王发曾, 康珈瑜, 等. 长江经济带县域城乡收入差距的空间格局及其影响因素[J]. 经济地理, 2017, 37(4):42-51.
|
| [21] |
陈利, 朱喜钢, 李小虎. 基于产业结构视角的云南省县域经济差异研究[J]. 地理科学, 2016, 36(3):384-392.
|
| [22] |
安景文, 李松林, 梁志霞, 等. 产业结构视角下京津冀都市圈经济差异测度[J]. 城市问题, 2018(9):48-54.
|
| [23] |
李敏纳, 蔡舒, 覃成林. 黄河流域经济空间分异态势分析[J]. 经济地理, 2011, 31(3):379-419.
|
| [24] |
周晓艳, 郝慧迪, 叶信岳, 等. 黄河流域区域经济差异的时空动态分析[J]. 人文地理, 2016, 31(5):119-125.
|
| [25] |
|
| [26] |
黄顺魁, 王裕瑾, 张可云. 中国制造业八大区域转移分析——基于偏离—份额分析[J]. 经济地理, 2013, 33(12):90-96.
|
| [27] |
张可云, 周庆. 基于动态偏离份额分析方法的湖南省产业结构及竞争力水平分析[J]. 湖湘论坛, 2012, 25(1):55-60.
|
| [28] |
张林, 赵乾安. 基于SSSM的中国区域创新主体结构演进[J]. 经济地理, 2019, 39(4):136-145.
|
| [29] |
|
| [30] |
|
/
| 〈 |
|
〉 |