
Evolutionary Trend and Coordinated Development Between Water Resources Carrying Capacity and Urbanization Quality in China
Received date: 2020-01-12
Revised date: 2020-10-19
Online published: 2025-04-01
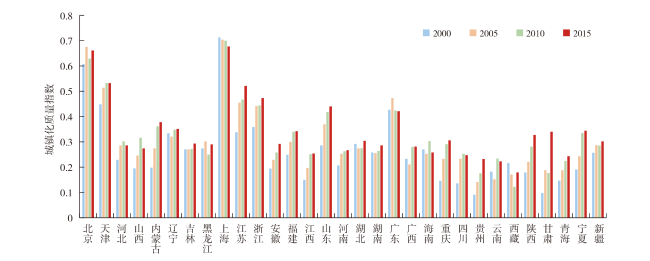
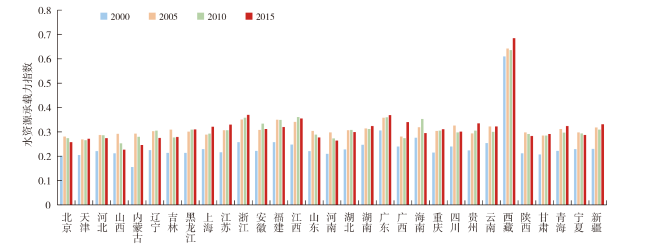
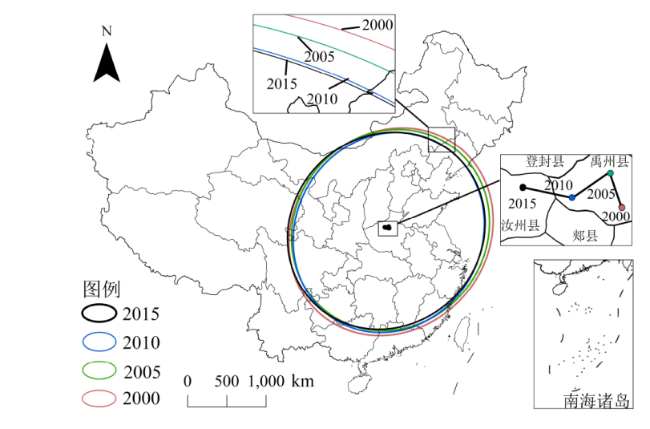
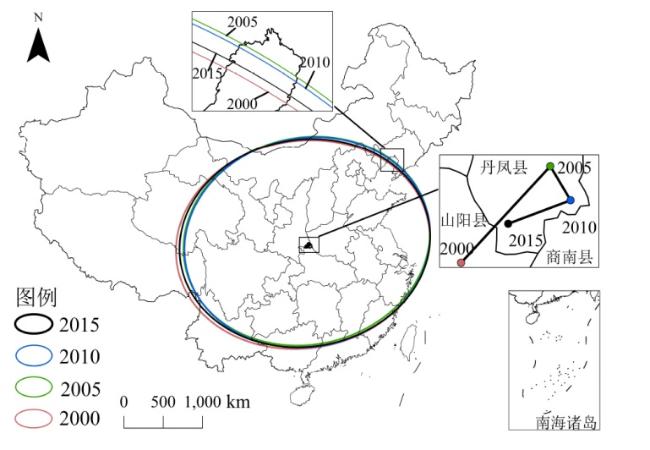
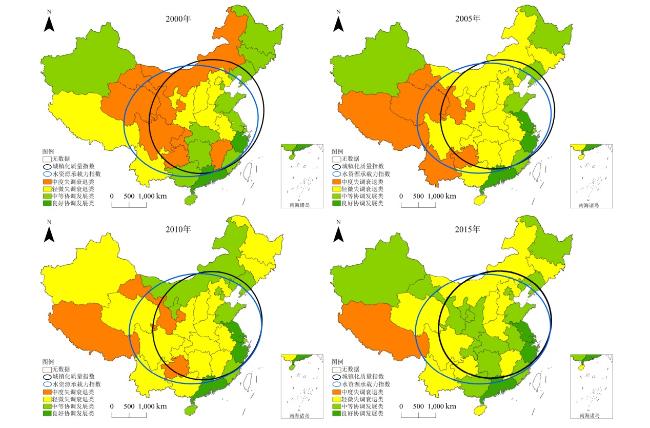
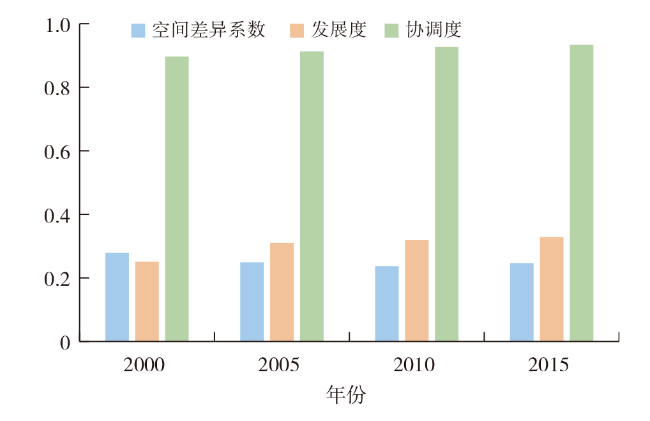
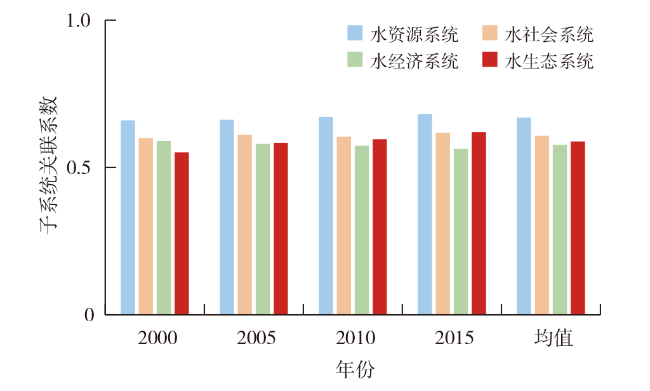
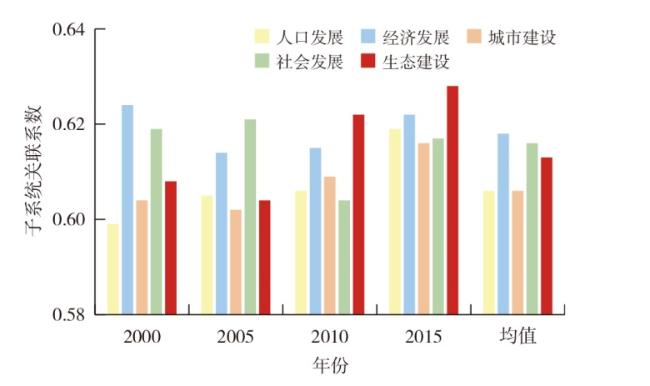
This paper calculates urbanization quality index and water resources carrying capacity index in China from 2000 to 2015 at the provincial level. Based on the standard deviational ellipse,coordinated development index,spatial difference coefficient and gray correlation coefficient,it analyzes their spatio-temporal evolution trend,overall coordinated development state and interaction mechanism. The results show: 1) During the study period, the averages of urbanization quality index and water resources carrying capacity index in each province are 0.11~0.71,0.23~0.69 respectively,which are both in a state of fluctuation. 2) The gravity center of the urbanization quality index distributes in Henan and shifts to the southwest. The gravity center of the water resources carrying capacity index is in Shaanxi,its shift direction is,in order,the northeast,the southeast and the southwest. 3) The coordinated development index is generally a benign development trend; the overall spatial distribution is in a state of concentration first and then spread. 4) The main constraints of water resources carrying capacity system are ranked as per capita water supply, per capita water resources,comprehensive water supply capacity at the end of the year,runoff modulus. The main stress factors of urbanization system are ranked as urban Engel coefficient,number of libraries,harmless treatment rate of domestic garbage,comprehensive utilization rate of industrial solid waste.
ZHENG Defeng , XU Wenjin , JIANG Junchao , LYU Leting . Evolutionary Trend and Coordinated Development Between Water Resources Carrying Capacity and Urbanization Quality in China[J]. Economic geography, 2021 , 41(2) : 72 -81 . DOI: 10.15957/j.cnki.jjdl.2021.02.008
表1 水资源承载力与城镇化质量指标体系Tab.1 Index system of water resources carrying capacity and urbanization quality |
| 目标层 | 准则层 | 指标层 |
|---|---|---|
| 城镇化质量 | 人口发展 | A11每万人拥有大专以上文化程度人数(+);A12城镇人口比重(+);A13非农业人口就业比重(+) |
| 经济发展 | A21人均地方生产总值(+);A22城镇居民人均可支配收入(+);A23城镇恩格尔系数(-) | |
| 城市建设 | A31人均道路面积(+);A32燃气普及率(+);A33建成区面积占行政区面积比例(+) | |
| 社会发展 | A41千人拥有医生数(+);A42教育固定资产占比(+);A43公共图书馆数量(+) | |
| 生态建设 | A51人均公园绿地面积(+);A52工业固体废物综合利用率(+);A53生活垃圾无害化处理率(+) | |
| 水资源承载力 | 水资源系统 | B11年径流深(+);B12人均水资源占有量(+);B13供水总量(+) |
| 水社会系统 | B21年末供水综合生产能力(+);B22人口密度(-);B23人均生活用水(+) | |
| 水经济系统 | B31工业万元产值用水量(-);B32农田灌溉亩均用水量(-);B33用水弹性系数(-) | |
| 水生态环境系统 | B41人均生态用水(+);B42人均生活COD排放量(-);B43化肥施用强度(-) |
注:表中的“+”表示对应的指标为正向指标,“-”表示对应的指标为负向指标。 |
表2 协调发展度分级标准Tab.2 The grade classification of coordinated development degree |
| 阈值 | 协调度等级 | 发展度等级 | 协调发展度等级 | 内涵 |
|---|---|---|---|---|
| 0.000~0.300 | 严重失调类 | 严重衰退类 | 严重失调衰退类 | 系统协调发展存在严重差异 |
| 0.301~0.400 | 中度失调类 | 中度衰退类 | 中度失调衰退类 | 系统协调发展存在一定差异 |
| 0.401~0.500 | 轻微失调类 | 轻微衰退类 | 轻微失调衰退类 | 系统协调发展出现轻微差异 |
| 0.501~0.550 | 中等协调类 | 中等发展类 | 中等协调发展类 | 系统协调发展基本无差异 |
| 0.551~0.700 | 良好协调类 | 发展良好类 | 良好协调发展类 | 系统协调发展状态良好 |
| 0.701~1.000 | 优质协调类 | 发展优质类 | 优质协调发展类 | 系统协调发展状态极佳 |
表3 中国水资源承载力与城镇化质量的标准差椭圆参数Tab.3 Standard deviation elliptic parameters of water resources carrying capacity and urbanization quality in China |
| 指数 | 年份 | 重心坐标 | 周长(km) | 长轴(km) | 短轴(km) | 方位角(°) | 形状指数 | |
|---|---|---|---|---|---|---|---|---|
| 经度(°) | 纬度(°) | |||||||
| 城镇化质量 | 2000 | 113°25'51"E | 34°5'54"N | 7 010.32 | 1 175.54 | 1 054.30 | 46.94 | 0.89 |
| 2005 | 113°23'12"E | 34°15'56"N | 6 796.90 | 1 123.71 | 1 039.03 | 47.84 | 0.92 | |
| 2010 | 113°9'4"E | 34°3'15"N | 6 661.60 | 1 105.85 | 1 013.65 | 37.64 | 0.92 | |
| 2015 | 112°52'27"E | 34°14'23"N | 6 719.50 | 1 112.64 | 1 025.40 | 54.31 | 0.92 | |
| 水资源承载力 | 2000 | 110°4'46" E | 33°20'13"N | 7 550.83 | 1 325.20 | 1 071.63 | 78.06 | 0.81 |
| 2005 | 110°31'26"E | 33°40'9"N | 7 428.10 | 1 290.30 | 1 068.00 | 74.97 | 0.83 | |
| 2010 | 110°35'56"E | 33°32'30"N | 7 440.50 | 1 286.20 | 1 077.60 | 75.24 | 0.84 | |
| 2015 | 110°18'46"E | 33°28'16"N | 7 490.90 | 1 308.70 | 1 069.60 | 78.34 | 0.82 | |
表4 中国水资源承载力与城镇化质量标准差椭圆移动参数Tab.4 The moving parameters of standard deviation ellipse of water resources carrying capacity and urbanization quality in China |
| 指数 | 年份 | 方向 | 距离(km) | 速率(km/a) | 东西向移动距离 | 南北向移动距离 |
|---|---|---|---|---|---|---|
| 城镇化质量 | 2000—2005 | 西北 | 19.05 | 3.81 | 4.92 | 18.62 |
| 2005—2010 | 西南 | 32.00 | 6.40 | 26.22 | 23.53 | |
| 2010—2015 | 西北 | 32.83 | 6.57 | 30.83 | 20.66 | |
| 水资源承载力 | 2000—2005 | 东北 | 55.41 | 11.08 | 49.48 | 36.98 |
| 2005—2010 | 东南 | 15.81 | 3.16 | 8.35 | 14.19 | |
| 2010—2015 | 西南 | 27.69 | 5.54 | 31.85 | 7.85 |
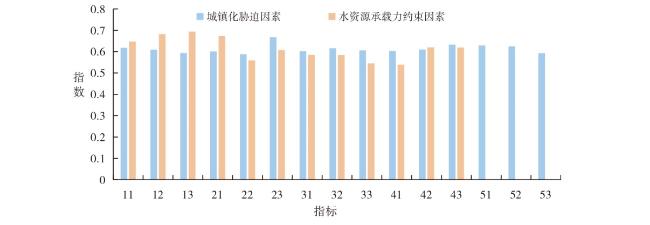
图7 水资源承载力对城镇化质量的约束作用Fig.7 The restraint effect of water resources carrying capacity on urbanization quality |
图8 城镇化质量对水资源承载力的胁迫作用Fig.8 The stress effect of urbanization quality on water resources carrying capacity |
| [1] |
方创琳. 中国新型城镇化高质量发展的规律性与重点方向[J]. 地理研究, 2019, 38(1):13-22.
|
| [2] |
|
| [3] |
施雅风, 曲耀光. 乌鲁木齐河流域水资源承载力及其合理利用[M]. 北京: 科学出版社, 1992.
|
| [4] |
|
| [5] |
|
| [6] |
|
| [7] |
|
| [8] |
|
| [9] |
赵军凯, 李九发, 戴志军, 等. 基于熵模型的城市水资源承载力研究——以开封市为例[J]. 自然资源学报, 2009, 4(11):86-93.
|
| [10] |
|
| [11] |
熊鹰, 苏孟婷, 张方明, 等. 长株潭城市群城镇化进程与水资源利用响应关系研究[J]. 人文地理, 2018, 33(6):75-82.
|
| [12] |
|
| [13] |
马海良, 施陈玲, 王蕾. 城镇化进程中的江苏水资源承载力研究——基于组合赋权和升半Γ型分布函数[J]. 长江流域资源与环境, 2016, 25(11):1697-1703.
|
| [14] |
白千千, 王录仓, 杨小梅. 水资源承载力下的城市化发展模式——以黑河流域张掖市为例[J]. 干旱区资源与环境, 2009, 23(4):77-80.
|
| [15] |
鲍超, 方创琳. 干旱区水资源对城市化约束强度的时空变化分析[J]. 地理学报, 2008, 63(11):22-32.
|
| [16] |
曹祺文, 鲍超, 顾朝林, 等. 基于水资源约束的中国城镇化SD模型与模拟[J]. 地理研究, 2019, 38(1):167-180.
|
| [17] |
冯浩源, 石培基, 周文霞, 等. 水资源管理“三条红线”约束下的城镇化水平阈值分析——以张掖市为例[J]. 自然资源学报, 2018, 33(2):287-301.
|
| [18] |
鲍超. 中国城镇化与经济增长及用水变化的时空耦合关系[J]. 地理学报, 2014, 69(12):1799-1809.
|
| [19] |
郭莎莎, 陈明星, 刘慧. 城镇化与资源环境的耦合过程与解耦分析——以北京为例[J]. 地理研究, 2018, 37(8):1599-1608.
|
| [20] |
朱一中, 夏军, 谈戈. 关于水资源承载力理论与方法的研究[J]. 地理科学进展, 2002, 21(2):180-188.
|
| [21] |
曲耀光, 樊胜岳. 黑河流域水资源承载力分析计算与对策[J]. 中国沙漠, 2000, 20(1):2-9.
|
| [22] |
焦雯珺, 闵庆文, 李文华, 等. 基于ESEF的水生态承载力:理论、模型与应用[J]. 应用生态学报, 2015, 26(4):1041-1048.
|
| [23] |
刘树锋, 陈俊合. 基于神经网络理论的水资源承载力研究[J]. 资源科学, 2007, 29(1):99-105.
|
| [24] |
薛俊菲, 陈雯, 张蕾. 中国市域综合城市化水平测度与空间格局研究[J]. 经济地理, 2010, 30(12):71-77.
|
| [25] |
王西琴, 刘昌明, 杨志峰. 生态及环境需水量研究进展与前瞻[J]. 水科学进展, 2002, 13(4):507-514.
|
| [26] |
贺三维, 王伟武, 曾晨, 等. 中国区域发展时空格局变化分析及其预测[J]. 地理科学, 2016, 36(11):1622-1628.
|
| [27] |
赵璐. 中国经济格局时空演化趋势[J]. 城市发展研究, 2013, 20(7):14-18.
|
| [28] |
赵璐, 赵作权. 基于特征椭圆的中国经济空间分异研究[J]. 地理科学, 2014, 34(8):979-986.
|
| [29] |
赵丹阳, 佟连军, 仇方道, 等. 松花江流域城市用地扩张的生态环境效应[J]. 地理研究, 2017, 36(1):74-84.
|
| [30] |
黄木易, 程志光. 区域城市化与社会经济耦合协调发展度的时空特征分析——以安徽省为例[J]. 经济地理, 2012, 32(2):77-81.
|
| [31] |
刘耀彬, 李仁东, 宋学锋. 中国区域城市化与生态环境耦合的关联分析[J]. 地理学报, 2005, 60(2):237-247.
|
| [32] |
张胜武, 石培基, 王祖静. 干旱区内陆河流域城镇化与水资源环境系统耦合分析——以石羊河流域为例[J]. 经济地理, 2012, 32(8):142-148.
|
| [33] |
赵媛, 杨足膺, 郝丽莎, 等. 中国石油资源流动源—汇系统空间格局特征[J]. 地理学报, 2012, 67(4):455-466.
|
| [34] |
关兴良, 魏后凯, 鲁莎莎, 等. 中国城镇化进程中的空间集聚、机理及其科学问题[J]. 地理研究, 2016, 35(2):227-241.
|
/
| 〈 |
|
〉 |