
Evolution of Geographical Patterns of Export Trade and the Expansion of Trade Network at the Provincial Level
Received date: 2020-02-20
Revised date: 2020-11-09
Online published: 2025-04-01
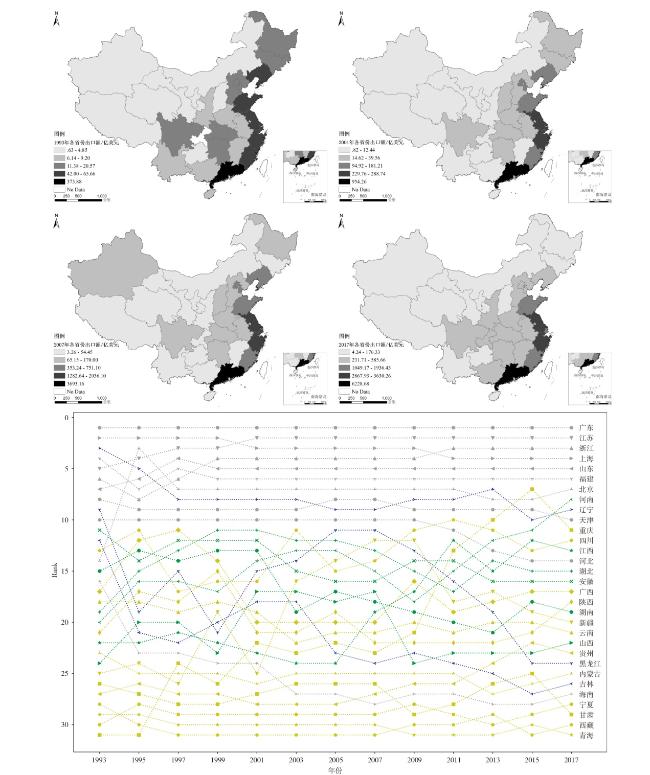
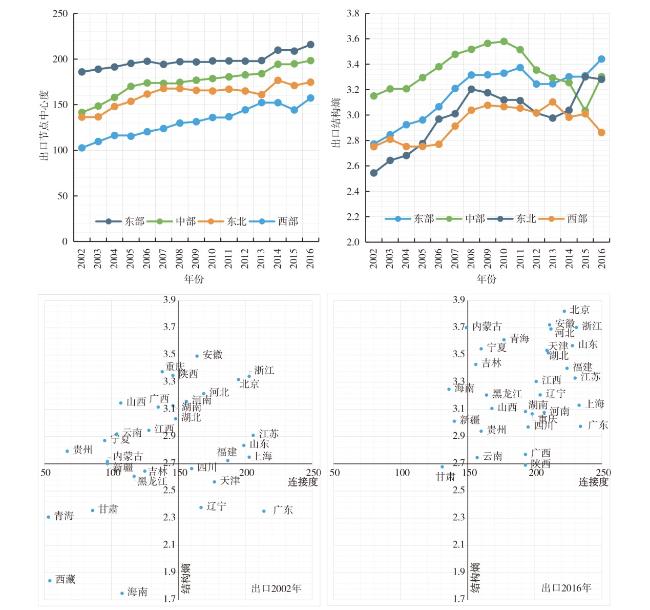
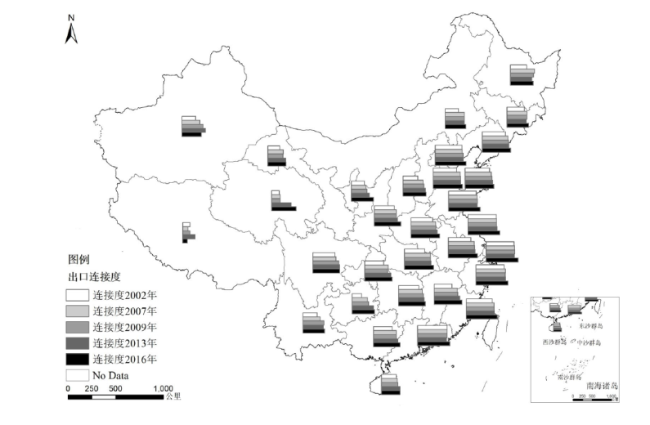
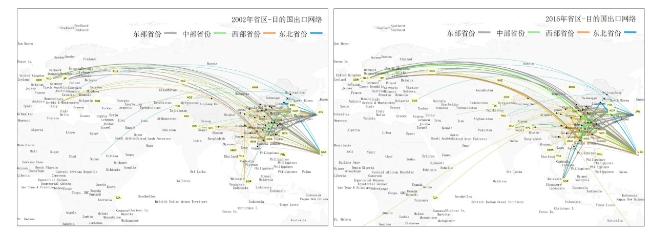
Since the reform and opening-up,the gradual opening-up of China's foreign trade and the rapid growth of trade scale have led to the evolution of the geographic pattern and network of trade. This article uses the China customs trade database (2000-2016) and various distance data between countries to explore the geographical pattern of the province's export trade and the evolution of the trade network. It describes the characteristics of diversification and equalization by calculating the export degree and entropy of each province. Cluster analysis is used to reveal the similarity of export destination structure across provinces. From the perspective of multi-proximity between countries and spillover effects between provinces,this paper explores the influential factors for the formation of the geographic pattern of provincial exports and the driving force for the expansion of provincial export networks. The results show that: 1) It shows an overall upward trend on the diversification and equalization of provincial exports. 2) The geographic pattern of the source and destination nodes in the province-country trade network has changed significantly. The number of major destination nodes has increased and more than half are located along the Belt and Road. 3) Provinces with similar export destination structures show agglomeration characteristics in geographic space. Inter-provincial spillover effects,geographical distance and cultural distance between countries have significant effects on the formation of the geographic pattern of provincial export trade. 4) Geographical and institutional distances significantly impede the expansion of provincial export networks. This paper provides empirical support for the existing descriptive research on trade patterns,expands the spatial scale of trade spillover effects and verifies the impact of multi-dimensional proximity between countries on the expansion of trade networks.
QI Fang , HE Canfei , ZHANG Wei . Evolution of Geographical Patterns of Export Trade and the Expansion of Trade Network at the Provincial Level[J]. Economic geography, 2021 , 41(2) : 35 -46 . DOI: 10.15957/j.cnki.jjdl.2021.02.004
表1 各目的地在省份出口网络中的地位(各目的地作为国内省份主要出口伙伴的次数)Tab.1 The status of each destination in the provincial export network |
| 序号 | 目的地 代码 | 目的地 | 2002年 连接数 | 目的地 代码 | 目的地 | 2016年 连接数 |
|---|---|---|---|---|---|---|
| 1 | JPN | 日本 | 30 | USA | 美国 | 30 |
| 2 | USA | 美国 | 28 | JPN | 日本 | 23 |
| 3 | HKG | 中国香港 | 27 | HKG | 中国香港 | 23 |
| 4 | KOR | 韩国 | 22 | KOR | 韩国 | 16 |
| 5 | GER | 德国 | 8 | IND | 印度 | 10 |
| 6 | TWN | 中国台湾 | 6 | VNM | 越南 | 7 |
| 7 | NLD | 荷兰 | 5 | SGP | 新加坡 | 6 |
| 8 | SGP | 新加坡 | 5 | GER | 德国 | 6 |
| 9 | IND | 印度 | 5 | NLD | 荷兰 | 6 |
| 10 | ITA | 意大利 | 5 | RUS | 俄罗斯 | 6 |
| 11 | MYS | 马来西亚 | 2 | TWN | 中国台湾 | 3 |
| 12 | RUS | 俄罗斯 | 2 | PAK | 巴基斯坦 | 2 |
| 13 | VNM | 越南 | 2 | PHL | 菲律宾 | 2 |
| 14 | KAZ | 哈萨克斯坦 | 1 | THA | 泰国 | 2 |
| 15 | MMR | 缅甸 | 1 | IRN | 伊朗 | 1 |
| 16 | SDN | 苏丹 | 1 | AUS | 澳大利亚 | 1 |
| 17 | IRQ | 伊拉克 | 1 | TUR | 土耳其 | 1 |
| 18 | AZE | 阿塞拜疆 | 1 | MNG | 蒙古 | 1 |
| 19 | GBR | 英国 | 1 | PRK | 朝鲜 | 1 |
| 20 | HUN | 匈牙利 | 1 | KAZ | 哈萨克斯坦 | 1 |
| 21 | NPL | 尼泊尔 | 1 | KGZ | 吉尔吉斯 | 1 |
| 22 | TJK | 塔吉克斯坦 | 1 | |||
| 23 | NPL | 尼泊尔 | 1 | |||
| 24 | CHL | 智利 | 1 | |||
| 25 | TZA | 坦桑尼亚 | 1 | |||
| 26 | MMR | 缅甸 | 1 | |||
| 27 | GBR | 英国 | 1 |
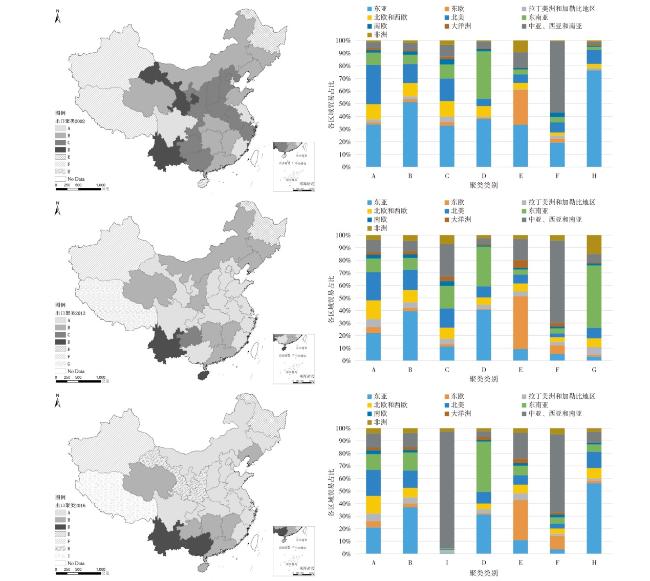
表2 2002、2013、2016年出口目的地结构聚类结果Tab.2 Clustering results of export destination structure of each province (2002, 2013, 2016) |
| 类别 | 主要出口结构特征 | 2002 | 2013 | 2016 |
|---|---|---|---|---|
| A | 北美、北欧、西欧占比在8种类型中最高,各区域较均衡 | 福建、江苏、上海、四川、天津 | 安徽、北京、重庆、福建、甘肃、广西、河北、河南、湖北、江苏、宁夏、山东、上海、山西、四川、天津、浙江 | 安徽、北京、重庆、福建、河北、河南、湖北、江苏、吉林、内蒙古、宁夏、山东、上海、山西、四川、天津、浙江 |
| B | 东亚占比高,其他区域较平均 | 广东、湖北、湖南、江西、吉林、辽宁、内蒙古、青海、山东 | 广东、湖南、江西、吉林、辽宁、内蒙古、青海、陕西 | 广东、贵州、海南、湖南、江西、辽宁、青海 |
| C | 各大区域占比十分均衡,没有突出区域 | 安徽、北京、重庆、广西、贵州、河北、河南、宁夏、陕西、山西、浙江 | 贵州 | - |
| D | 东亚、东南亚占比之和超过70% | 甘肃、云南 | 海南、云南 | 广西、云南 |
| E | 东欧占比在8种类型中最高 | 黑龙江 | 黑龙江 | 黑龙江 |
| F | 中亚、西亚、南亚占比过半 | 新疆、西藏 | 新疆 | 新疆 |
| G | 东南亚占比均值为50%,其他区域均衡 | - | 西藏 | - |
| H | 东亚占比极高,超过75%,其他区域均衡 | 海南 | - | 甘肃、陕西 |
| I | 中亚、西亚、南亚占比超过90%,其他区域占比极少 | - | - | 西藏 |
表3 变量定义与计算Tab.3 Variable definition and calculation |
| 分类 | 符号 | 变量名称 | 赋值与计算 |
|---|---|---|---|
| 被解释变量 | proppct | 出口结构 | t年c国占p省份出口额比例 |
| Entry_tradepct | 贸易联系拓展 | 对于省份p到国家c的出口,若t年有贸易记录而t-1年无贸易,则Entry_tradepct=1,否则为0 | |
| 解释变量 | dist_geowc | 地理距离 | c国与中国地理距离,来源于CEPII数据库,根据主要人口聚集地距离及其所占总人口比例加权计算 |
| dist_culc | 文化距离 | c国与中国文化距离,根据Hofstede数据计算 | |
| dist_instct | 制度距离 | c国与中国制度距离,来源于The Heritage Foundation提供的每年更新一次的各地区经济自由度指标(Index of Economic Freedom),计算方法如式(4)所示 | |
| ProxRegionpct | 接壤省份出口特征 | t-1年c国在p省接壤省份出口结构中占比的平均值 | |
| 控制变量 | lnGDPregionpt | 省份GDP | 使用国家统计局数据(单位:亿元人民币) |
| lnGDPregion_perpt | 省份人均GDP | 使用国家统计局数据(单位:元人民币) | |
| lnGDPcountryct | 国家GDP | 使用世界银行数据(单位:美元,现价) |
表4 省份出口贸易地理格局回归结果Tab.4 Regression results of geographical patterns of export trade |
| 变量 | (1)全样本 | (2)东部省份 | (3)中部省份 | (4)西部省份 | (5)东北省份 |
|---|---|---|---|---|---|
| prop | prop | prop | prop | prop | |
| ProxRegion | 0.459*** | 0.288*** | 0.765*** | 0.447*** | 0.553*** |
| (0.00685) | (0.00846) | (0.0123) | (0.0124) | (0.0230) | |
| dist_geow | -5.21e-07*** | -5.81e-07*** | -1.86e-07 | -5.17e-07*** | -8.70e-07** |
| (9.41e-08) | (1.70e-07) | (1.19e-07) | (1.42e-07) | (4.39e-07) | |
| dist_cul | -0.000416* | -0.000539 | -0.000150 | -0.000512 | -0.000123 |
| (0.000229) | (0.000417) | (0.000291) | (0.000346) | (0.00108) | |
| dist_inst | 0.000119 | 0.000501*** | -0.000418*** | 0.000120 | -0.000144 |
| (8.91e-05) | (0.000112) | (0.000147) | (0.000173) | (0.000260) | |
| lnGDPregion | 4.05e-05 | -0.00133** | -0.00128 | 0.000488 | -0.000565 |
| (0.000364) | (0.000590) | (0.00130) | (0.000511) | (0.00769) | |
| lnGDPcountry | 0.00292*** | 0.00431*** | 0.00120*** | 0.00245*** | 0.00440*** |
| (0.000151) | (0.000226) | (0.000220) | (0.000253) | (0.000551) | |
| lnGDPregion_per | -0.00178*** | -0.00157** | 0.000627 | -0.00180*** | -0.00248 |
| (0.000398) | (0.000675) | (0.00135) | (0.000563) | (0.00782) | |
| Constant | -0.0460*** | -0.0676*** | -0.0195*** | -0.0385*** | -0.0685*** |
| (0.00331) | (0.00499) | (0.00487) | (0.00562) | (0.0148) | |
| Observations | 46 469 | 14 990 | 8 994 | 17 988 | 4 497 |
| Number of indexid | 2 945 | 950 | 570 | 1 140 | 285 |
注:*** p<0.01,** p<0.05,* p<0.1。 |
表5 省份出口贸易网络拓展回归结果Tab.5 Regression results of provinces' export destination expansion |
| 变量 | (1) | (2) | (3) | (4) |
|---|---|---|---|---|
| Entry_trade | 2001—2006 | 2007—2012 | 2013—2016 | |
| dist_geow | -1.83e-05**(7.70e-06) | 3.77e-06(9.50e-06) | -1.72e-05(1.84e-05) | -6.33e-05**(2.48e-05) |
| dist_cul | -0.0116(0.0149) | 0.00824(0.0184) | -0.0261(0.0358) | -0.0352(0.0450) |
| dist_inst | -0.0282*(0.0150) | 0.0204(0.0186) | -0.0163(0.0325) | -0.291***(0.0610) |
| lnGDPregion | 0.000934(0.0213) | 0.109***(0.0283) | -0.262***(0.0461) | -0.173***(0.0615) |
| lnGDPcountry | 0.00836(0.0146) | 0.000374(0.0199) | -0.201***(0.0458) | 0.142***(0.0379) |
| lnGDPregion_per | -0.579***(0.0381) | -0.433***(0.0690) | -0.238*(0.134) | 0.115(0.226) |
| Constant | 4.026***(0.410) | 1.853**(0.779) | 7.529***(1.684) | -4.162*(2.457) |
| Observations | 9 604 | 3 633 | 3 594 | 2 377 |
注:***p<0.01,**p<0.05,*p<0.1。 |
| [1] |
|
| [2] |
傅自应. 中国对外贸易三十年[M]. 北京: 中国财经出版社, 2008.
|
| [3] |
张群. 中国货物贸易结构演进研究[D]. 长春: 东北师范大学, 2015.
|
| [4] |
邹嘉龄, 刘卫东. 2001—2013年中国与“一带一路”沿线国家贸易网络分析[J]. 地理科学, 2016, 36(11):1629-1636.
|
| [5] |
|
| [6] |
|
| [7] |
蒋小荣, 杨永春, 汪胜兰. 1985—2015年全球贸易网络格局的时空演化及对中国地缘战略的启示[J]. 地理研究, 2018(3):495-511.
|
| [8] |
公丕萍, 宋周莺, 刘卫东. 中国与“一带一路”沿线国家贸易的商品格局[J]. 地理科学进展, 2015(5):571-580.
|
| [9] |
|
| [10] |
|
| [11] |
|
| [12] |
潘镇. 制度质量、制度距离与双边贸易[J]. 中国工业经济, 2006(7):45-52.
|
| [13] |
|
| [14] |
|
| [15] |
田晖, 蒋辰春. 国家文化距离对中国对外贸易的影响——基于31个国家和地区贸易数据的引力模型分析[J]. 国际贸易问题, 2012(3):45-52.
|
| [16] |
许家云, 周绍杰, 胡鞍钢. 制度距离、相邻效应与双边贸易——基于“一带一路”国家空间面板模型的实证分析[J]. 财经研究, 2017, 43(1):75-85.
|
| [17] |
|
| [18] |
贺灿飞, 金璐璐, 刘颖. 多维邻近性对中国出口产品空间演化的影响[J]. 地理研究, 2017, 36(9):1613-1626.
|
| [19] |
贺灿飞, 胡绪千, 罗芊. 全球—地方出口溢出效应对新企业进入出口市场的影响[J]. 地理科学进展, 2019, 38(5):731-744.
|
| [20] |
赵勇, 白永秀. 知识溢出:一个文献综述[J]. 经济研究, 2009(1):145-157.
|
| [21] |
|
| [22] |
|
| [23] |
|
| [24] |
|
| [25] |
|
| [26] |
|
| [27] |
|
| [28] |
|
| [29] |
|
| [30] |
|
| [31] |
刘晓凤, 葛岳静, 赵亚博. 国家距离与中国企业在“一带一路”投资区位选择[J]. 经济地理, 2017, 37(11):99-108.
|
| [32] |
魏浩, 何晓琳, 赵春明. 制度水平、制度差距与发展中国家的对外贸易发展——来自全球31个发展中国家的国际经验[J]. 南开经济研究, 2010(5):18-34.
|
| [33] |
|
/
| 〈 |
|
〉 |