
Logistics Network Structure of Express Delivery Companies and Their Self-Organization Effect Under the Background of E-commerce:Taking ZTO Express as an Example
Received date: 2020-05-07
Revised date: 2020-11-25
Online published: 2025-04-01
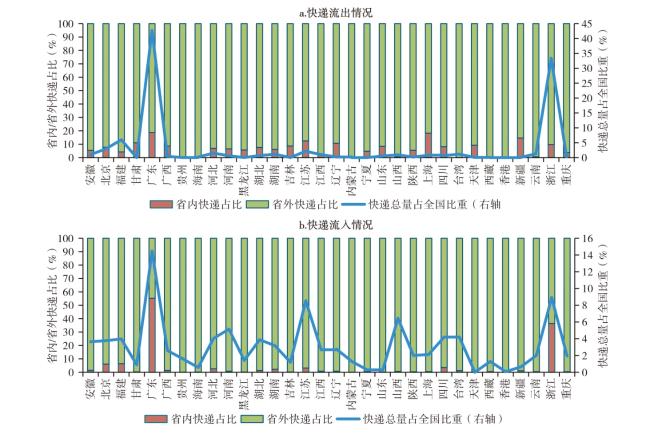
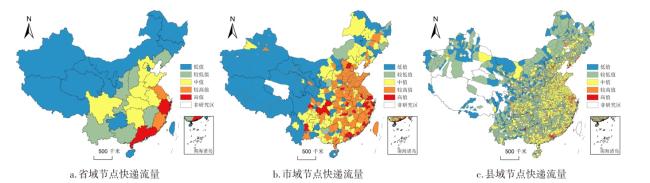
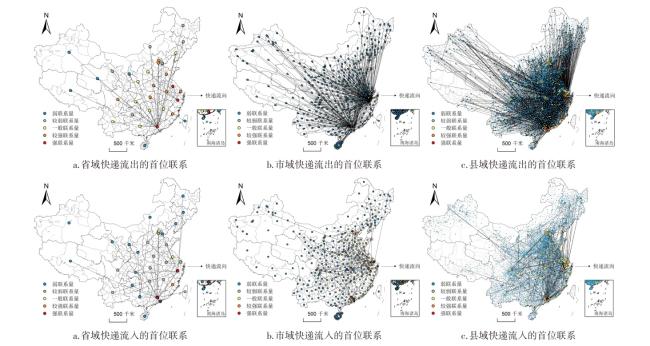
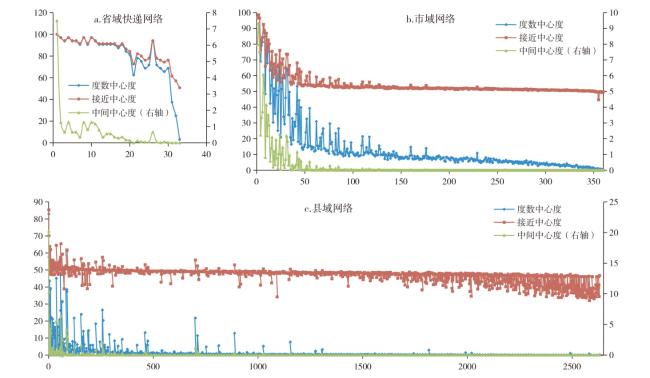
In order to study the macro pattern and micro mechanism of logistics network of express delivery enterprise under the background of e-commerce. This paper analyzes the spatial pattern,network structure and network self-organization effect of express logistics network based on the data of ZTO Express circulation during the period of "Double Eleven",and draws the following conclusions: 1) The distribution pattern of express flow changes and expriences three stages in order as follows: the block-distribution pattern at the provincial level,the aggregation-distribution with multi-core and polar spillover at the municipal level,the spatial pattern of one-core and multi-polar at the prefectural level. The network structure heterogeneity under different scales is obvious,and has scale effect. 2) E-commerce express has effectively weakened the geographical constraints in the regional connection pattern,and strengthened the material transportation connection between coastal regions and underdeveloped regions. Moreover,the express logistics network pattern reflects the spatial characteristics of the supply-side agglomeration of e-commerce industry and the dispersion distribution of the demand-side. 3) The tightness degree of network connection exhibits the gradient descent from the provincial level to the prefectural level. The smaller the scale of the express logistics network,the lower the frequency of strong-interaction Motif structure and the stronger the dominant position of divergent Motif structure. 4) Various network self-organization effects,such as reciprocity,expansion,transmission,intermediary and closure,have promoted the complexity of the express logistics network structure.
ZHOU Jianping , LIU Chengjun , XU Weixiang , LI Lu , ZHOU Mengyao , HOU Hehong . Logistics Network Structure of Express Delivery Companies and Their Self-Organization Effect Under the Background of E-commerce:Taking ZTO Express as an Example[J]. Economic geography, 2021 , 41(2) : 103 -112 . DOI: 10.15957/j.cnki.jjdl.2021.02.011
表1 快递物流网络模体分析Tab.1 Analysis of express logistics network model |
| 类型 | 编码 | 模体结构 | 频率(%) | 平均频率(%) | 标准差 | Z值 | p值 |
|---|---|---|---|---|---|---|---|
| 省域网络 | 140 |  | 0.13 | 0.06 | 0.0003 | 2.0697 | 0.0341 |
| 14 |  | 11.59 | 11.23 | 0.0010 | 1.1686 | 0.0918 | |
| 166 |  | 5.82 | 5.69 | 0.0011 | 1.1290 | 0.0892 | |
| 市域网络 | 6 |  | 58.30 | 58.13 | 0.0003 | 5.2643 | 0.0000 |
| 46 |  | 6.43 | 6.22 | 0.0004 | 4.6418 | 0.0000 | |
| 238 |  | 0.93 | 0.85 | 0.0002 | 3.7215 | 0.0000 | |
| 12 |  | 4.07 | 3.95 | 0.0004 | 2.9343 | 0.0110 | |
| 166 |  | 0.31 | 0.26 | 0.0001 | 2.7373 | 0.0110 | |
| 县域网络 | 6 |  | 81.37 | 81.20 | 0.0003 | 5.1175 | 0.0000 |
| 46 |  | 1.28 | 1.13 | 0.0003 | 4.5285 | 0.0000 | |
| 238 |  | 0.05 | 0.03 | 0.0001 | 3.7736 | 0.0000 | |
| 12 |  | 4.09 | 3.97 | 0.0003 | 3.7460 | 0.0000 | |
| 164 |  | 0.25 | 0.23 | 0.0001 | 3.5032 | 0.0000 | |
| 166 |  | 0.06 | 0.06 | 0.0001 | 2.3260 | 0.0325 |
表2 ERGM 模型主要统计量及其含义解释Tab.2 The main statistics of ERGM model and its interpretation |
| 结构示意图 | 结构变量 | 变量含义 | 机制 | 解释 |
|---|---|---|---|---|
 | edges | 边数 | 基础效应 | 网络节点形成关系的基本倾向 |
 | mutual | 互惠性 | 互惠性 | 网络节点是否倾向于形成交互关系 |
 | ostar(2) | 出2星 | 扩张性 | 网络节点是否倾向联结两个节点 |
 | twopath | 2路 | 传递性 | 网络节点间的出度和入度是否存在相关性 |
 | gwdsp | 交互k-2路 | 中介性 | 网络节点间是否倾向形成中介2-路径 |
 | gwesp | 交互k三角 | 闭合性 | 网络节点间是否倾向形成闭合三角形 |
表3 ERGM模型参数估计结果Tab.3 Parameter estimation results of ERGM model |
| 变量 | 省域网络 | 市域网络 | 县域网络 | ||||
|---|---|---|---|---|---|---|---|
| 模型Ⅰ | 模型Ⅰ | 模型Ⅱ | 模型Ⅰ | 模型Ⅱ | |||
| edges | -5.925*** | -3.949*** | -3.915* | -5.932*** | -7.589*** | ||
| mutual | 3.116*** | 1.356*** | 1.339*** | 2.479*** | 2.501*** | ||
| ostar(2) | 0.006*** | 0.018*** | 0.004*** | ||||
| twopath | 0.0002*** | 0.002*** | 0.001*** | ||||
| gwdsp | 1.044 | 3.327*** | |||||
| gwesp | 1.610*** | 0.867** | |||||
| AIC | 459 640 | 56 952 | 69 976 | 460 362 | 478 820 | ||
| BIC | 459 695 | 56 991 | 70 025 | 460 417 | 478 889 | ||
注:*、**、***分别代表10%、5%、1%的显著性水平。 |
| [1] |
邱泽奇, 张樹沁, 刘世定, 等. 从数字鸿沟到红利差异——互联网资本的视角[J]. 中国社会科学, 2016(10):93-115,203-204.
|
| [2] |
安同良, 杨晨. 互联网重塑中国经济地理格局:微观机制与宏观效应[J]. 经济研究, 2020, 55(2):4-19.
|
| [3] |
刘程军, 周建平, 蒋建华, 等. 电子商务背景下县域物流的空间联系及其网络结构研究——以浙江省为例[J]. 地理科学, 2019, 39(11):1719-1728.
|
| [4] |
|
| [5] |
|
| [6] |
|
| [7] |
|
| [8] |
|
| [9] |
李磊, 陆林, 穆成林, 等. 高铁网络化时代典型旅游城市旅游流空间结构演化——以黄山市为例[J]. 经济地理, 2019, 39(5):207-216,225.
|
| [10] |
秦静, 李郎平, 唐鸣镝, 等. 基于地理标记照片的北京市入境旅游流空间特征[J]. 地理学报, 2018, 73(8):1556-1570.
|
| [11] |
汪德根, 陈田, 陆林, 等. 区域旅游流空间结构的高铁效应及机理——以中国京沪高铁为例[J]. 地理学报, 2015, 70(2):214-233.
|
| [12] |
董超, 修春亮, 魏冶. 基于通信流的吉林省流空间网络格局[J]. 地理学报, 2014, 69(4):510-519.
|
| [13] |
王宁宁, 陈锐, 赵宇. 基于信息流的互联网信息空间网络分析[J]. 地理研究, 2016, 35(1):137-147.
|
| [14] |
姚文萃, 周婕, 陈虹桔, 等. 基于互联网公共信息流的区域网络空间结构研究[J]. 经济地理, 2017, 37(10):10-16.
|
| [15] |
盛科荣, 张红霞, 赵超越. 中国城市网络关联格局的影响因素分析——基于电子信息企业网络的视角[J]. 地理研究, 2019, 38(5):1030-1044.
|
| [16] |
王成, 王茂军. 山东省城市关联网络演化特征——基于“中心地”和“流空间”理论的对比[J]. 地理研究, 2017, 36(11):2197-2212.
|
| [17] |
李鲁奇, 孔翔. “双十一”期间中国快递流通的时空结构与效率——基于时间地理学视角[J]. 地理研究, 2019, 38(8):1891-1904.
|
| [18] |
宓泽锋, 曾刚. 不同尺度下长江经济带物流联系格局、特征及影响因素研究[J]. 地理科学, 2018, 38(7):1079-1088.
|
| [19] |
席广亮, 甄峰, 沈丽珍, 等. 南京市居民流动性评价及流空间特征研究[J]. 地理科学, 2013, 33(9):1051-1057.
|
| [20] |
任梦瑶, 肖作鹏, 王缉宪. 中国城际专线物流网络空间格局[J]. 地理学报, 2020, 75(4):820-832.
|
| [21] |
宗会明, 周素红, 闫小培. 全球化下地方综合服务型物流企业的空间网络组织——以腾邦物流为案例[J]. 地理研究, 2015, 34(5):944-952.
|
| [22] |
梁双波, 曹有挥, 吴威. 长江三角洲地区物流供应链时空演化及其影响因素——基于国际货代企业数据的分析[J]. 地理研究, 2017, 36(11):2156-2170.
|
| [23] |
刘程军, 周建平, 蒋建华, 等. 区域创新与区域金融耦合协调的格局及其驱动力——基于长江经济带的实证[J]. 经济地理, 2019, 39(10):94-103.
|
| [24] |
|
| [25] |
|
| [26] |
徐维祥, 张筱娟, 刘程军. 长三角制造业企业空间分布特征及其影响机制研究:尺度效应与动态演进[J]. 地理研究, 2019, 38(5):1236-1252.
|
| [27] |
彭芳梅. 粤港澳大湾区及周边城市经济空间联系与空间结构——基于改进引力模型与社会网络分析的实证分析[J]. 经济地理, 2017, 37(12):57-64.
|
| [28] |
秦奇, 吴良, 李飞, 等. 基于社会网络分析的东南亚地缘关系研究[J]. 地理学报, 2018, 73(10):2014-2030.
|
| [29] |
郑文升, 姜玉培, 卓蓉蓉, 等. 安徽省县际经济联系网络结构演变及影响因素[J]. 地理科学, 2016, 36(2):265-273.
|
| [30] |
刘华军, 杜广杰. 中国雾霾污染的空间关联研究[J]. 统计研究, 2018, 35(4):3-15.
|
/
| 〈 |
|
〉 |
