
Trends and Layout of Economic Integration Between North and South China
Received date: 2020-09-16
Revised date: 2021-01-08
Online published: 2025-04-01
The regional economic divide and integration is a new direction for China to implement its coordinated regional development strategy in the new period. The purpose of this paper is to discuss a spatial economic integration between North and South China. Based on the data of domestic consumer market and GDP(2000-2017)at the prefectural level,it analyzes the spatial evolution and integration of economy at the regional and national level by the means of spatial standard deviational ellipses and visualization methods, it also uses secondary(inner) ellipses (a smaller standard deviational ellipse within a larger one)to identify denser economic agglomerations in China and then compares the levels of spatial economic agglomeration of different regions. It is found that the economy in the two regions shows the characteristics of spatial integration and the reduction of distance between their gravity centers. The economy of cities locating in the North China Plain and the middle and lower Yangtze River Plain grows faster than the ones outside of the two plains because of their closeness to each other and to the national market. At the same time,a higher degree of spatial economic agglomeration is observed along the belt-shaped areas of Beijing-Hangzhou and Zhengzhou-Wuhan which may become key axises for the North-South coordinated and integrated development in China.
BAI Bing , ZHAO Zuoquan , ZHANG Pei . Trends and Layout of Economic Integration Between North and South China[J]. Economic geography, 2021 , 41(2) : 1 -10 . DOI: 10.15957/j.cnki.jjdl.2021.02.001
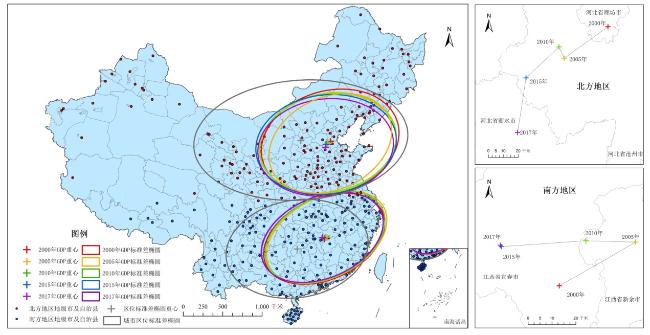
图1 2000—2017年中国南北区域消费市场椭圆及其重心Fig.1 Standard deviational ellipses and gravity centers of the consumer market in North and South China,2000-2017 |
表1 2000—2017年中国南北区域消费市场椭圆参数Tab.1 Standard deviational ellipse parameters of the consumer market in North and South China,2000-2017 |
| 地区 | 年份 | 重心经度 | 重心纬度 | 长半轴(km) | 短半轴(km) | 椭圆面积(万km2) | 旋转角(度) | 密集度(万元/km2) | 形状指数 |
|---|---|---|---|---|---|---|---|---|---|
| 北方地区 | 2000 | 116.71 | 38.57 | 845.75 | 602.03 | 159.95 | 64.68 | 105.03 | 0.71 |
| 2005 | 116.61 | 38.40 | 813.70 | 585.99 | 149.79 | 65.11 | 207.10 | 0.72 | |
| 2010 | 116.66 | 38.37 | 802.63 | 578.35 | 145.82 | 62.47 | 495.99 | 0.72 | |
| 2015 | 116.56 | 38.28 | 813.36 | 587.18 | 150.03 | 63.92 | 916.09 | 0.72 | |
| 2017 | 116.58 | 38.15 | 799.49 | 571.71 | 143.59 | 59.80 | 1 132.05 | 0.72 | |
| 南方地区 | 2000 | 114.56 | 27.91 | 799.20 | 512.82 | 128.75 | 64.51 | 157.78 | 0.64 |
| 2005 | 114.61 | 27.94 | 797.68 | 513.85 | 128.76 | 64.67 | 283.07 | 0.64 | |
| 2010 | 114.44 | 27.92 | 798.26 | 517.84 | 129.86 | 65.46 | 653.14 | 0.65 | |
| 2015 | 114.22 | 28.00 | 804.22 | 515.78 | 130.30 | 68.07 | 1 248.20 | 0.64 | |
| 2017 | 114.15 | 28.01 | 804.92 | 515.87 | 130.44 | 68.50 | 1 525.86 | 0.64 |
表2 2000—2017年中国南北区域GDP分布的标准差椭圆参数Tab.2 Standard deviational ellipse parameters of GDP in North and South China,2000-2017 |
| 地区 | 年份 | 重心经度 | 重心纬度 | 长半轴(km) | 短半轴(km) | 椭圆面积(万km2) | 旋转角(度) | 密集度(万元/km2) | 形状指数 |
|---|---|---|---|---|---|---|---|---|---|
| 北方地区 | 2000 | 116.59 | 38.57 | 889.58 | 648.82 | 181.31 | 73.70 | 251.66 | 0.73 |
| 2005 | 116.22 | 38.41 | 871.69 | 625.26 | 171.22 | 79.03 | 554.39 | 0.72 | |
| 2010 | 116.19 | 38.48 | 877.55 | 626.40 | 172.68 | 78.26 | 1 238.04 | 0.71 | |
| 2015 | 115.91 | 38.32 | 894.27 | 629.78 | 176.92 | 82.64 | 1 913.85 | 0.70 | |
| 2017 | 115.79 | 38.00 | 863.26 | 614.76 | 166.72 | 82.41 | 2 242.81 | 0.71 | |
| 南方地区 | 2000 | 114.38 | 27.76 | 811.49 | 515.84 | 131.50 | 65.37 | 407.62 | 0.64 |
| 2005 | 114.72 | 27.90 | 817.38 | 508.54 | 130.58 | 62.68 | 819.83 | 0.62 | |
| 2010 | 114.51 | 27.92 | 810.35 | 509.09 | 129.59 | 63.53 | 1 802.32 | 0.63 | |
| 2015 | 114.15 | 27.93 | 811.61 | 513.35 | 130.88 | 66.13 | 3 106.89 | 0.63 | |
| 2017 | 114.15 | 27.93 | 813.98 | 514.63 | 131.59 | 66.50 | 3 716.09 | 0.63 |
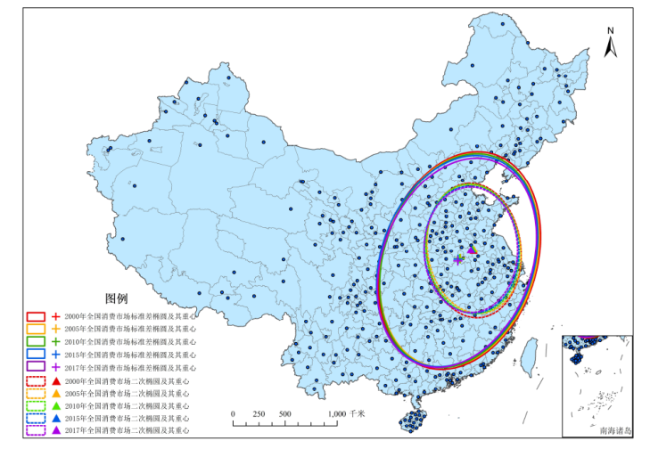
表3 2000—2017全国GDP椭圆及其二次椭圆的参数Tab.3 Parameters of GDP ellipses and their quadratic ellipses in 2000-2017 |
| 类型 | 年份 | 重心经度(°E) | 重心纬度(°N) | 长半轴(km) | 短半轴(km) | 椭圆面积(万km2) | 旋转角(度) | 密集度(万元/km2) | 形状指数 |
|---|---|---|---|---|---|---|---|---|---|
| 一次椭圆 | 2000 | 115.39 | 32.90 | 1 092.12 | 784.41 | 269.11 | 18.29 | 368.73 | 0.72 |
| 2005 | 115.43 | 33.00 | 1 056.05 | 788.55 | 261.60 | 16.01 | 772.06 | 0.75 | |
| 2010 | 115.32 | 33.13 | 1 061.68 | 788.25 | 262.89 | 16.62 | 1 701.66 | 0.74 | |
| 2015 | 114.95 | 32.80 | 1 045.48 | 802.22 | 263.47 | 17.81 | 2 828.53 | 0.77 | |
| 2017 | 114.86 | 32.44 | 1 017.28 | 785.87 | 251.14 | 18.74 | 3 436.00 | 0.77 | |
| 二次椭圆 | 2000 | 116.68 | 33.38 | 650.48 | 512.70 | 104.77 | 2.26 | 621.45 | 0.79 |
| 2005 | 117.13 | 33.64 | 629.08 | 459.28 | 90.76 | 167.62 | 1 440.65 | 0.73 | |
| 2010 | 116.98 | 33.63 | 631.35 | 465.89 | 92.40 | 170.71 | 3 104.91 | 0.74 | |
| 2015 | 116.42 | 33.26 | 633.91 | 526.61 | 104.87 | 7.85 | 4 707.64 | 0.83 | |
| 2017 | 116.40 | 33.14 | 626.77 | 531.10 | 104.57 | 7.88 | 5 579.61 | 0.85 |
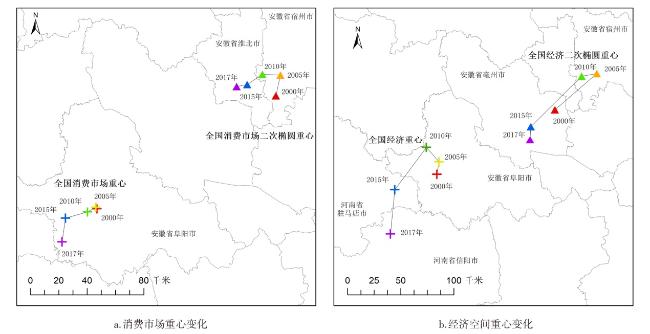
表4 2000—2017年全国和多区域经济椭圆面积与密集度变化Tab.4 Change of economic ellipse area and density in the national and multi-regional levels,2000-2017 |
| 区域 | 经济指标 | 椭圆面积(2000) | 椭圆面积(2017) | 面积增长(%) | 密集度(2000) | 密集度排序 | 密集度(2017) | 密集度排序 |
|---|---|---|---|---|---|---|---|---|
| 全国 | 市场 | 250.64 | 234.77 | -6.3 | 148.07 | 7 | 1 540.18 | 6 |
| GDP | 269.11 | 251.14 | -6.7 | 368.73 | 7 | 3 436.00 | 7 | |
| 北方 | 市场 | 159.95 | 143.59 | -10.2 | 105.03 | 8 | 1 132.05 | 8 |
| GDP | 181.32 | 166.72 | -8.1 | 251.66 | 8 | 2 242.81 | 8 | |
| 南方 | 市场 | 128.74 | 130.44 | 1.3 | 157.78 | 6 | 1 525.86 | 7 |
| GDP | 131.50 | 131.59 | 0.1 | 407.62 | 6 | 3 716.09 | 6 | |
| 二次椭圆 | 市场 | 92.44 | 85.12 | -7.9 | 252.95 | 3 | 2 599.93 | 3 |
| GDP | 104.77 | 104.57 | -0.2 | 621.45 | 3 | 5 579.62 | 3 | |
| 京杭轴带 | 市场 | 35.95 | 35.80 | -0.4 | 419.38 | 1 | 4 056.29 | 1 |
| GDP | 36.67 | 34.00 | -7.3 | 1 089.41 | 1 | 10 344.25 | 1 | |
| 豫鄂 | 市场 | 14.78 | 15.27 | 3.3 | 243.48 | 4 | 2 397.21 | 4 |
| GDP | 14.76 | 15.28 | 3.5 | 597.73 | 4 | 5 364.31 | 4 | |
| 鄂湘赣 | 市场 | 18.93 | 18.81 | -0.6 | 203.24 | 5 | 2 102.24 | 5 |
| GDP | 19.80 | 18.92 | -4.4 | 487.95 | 5 | 4 898.88 | 5 | |
| 川渝 | 市场 | 8.64 | 8.55 | -1.0 | 257.64 | 2 | 2 985.87 | 2 |
| GDP | 9.19 | 8.91 | -3.0 | 628.48 | 2 | 6 513.80 | 2 |
| [1] |
习近平. 推动形成优势互补高质量发展的区域经济布局[J]. 求是, 2019(24):4-9.
|
| [2] |
李向平, 王广林. 中国地区经济增长格局中的“南北”问题[J]. 工业技术经济, 1992(4):5-7.
|
| [3] |
吴殿廷. 试论中国经济增长的南北差异[J]. 地理研究, 2001, 20(2):238-246.
|
| [4] |
申兵, 党丽娟. 区域经济分化的特征、趋势与对策[J]. 宏观经济管理, 2016(10):33-36.
|
| [5] |
郭妍, 张立光. 我国区域经济的南北分化及其成因[J]. 山东社会科学, 2018(11):154-159.
|
| [6] |
盛来运, 郑鑫, 周平, 等. 我国经济发展南北差距扩大的原因分析[J]. 管理世界, 2018, 34(9):16-24.
|
| [7] |
杨多贵, 刘开迪, 周志田. 我国南北地区经济发展差距及演变分析[J]. 中国科学院院刊, 2018, 33(10):1083-1092.
|
| [8] |
蔡之兵. 南北分化视角下的北方区域经济失速问题探因[J]. 江淮论坛, 2019(5):70-77.
|
| [9] |
李善同, 何建武, 唐泽地. 从价值链分工看中国经济发展南北差距的扩大[J]. 中国经济报告, 2019(2):16-21.
|
| [10] |
张红梅, 李善同, 许召元. 改革开放以来我国区域差距的演变[J]. 改革, 2019(4):78-87.
|
| [11] |
周晓波, 陈璋, 王继源. 中国南北方经济分化的现状、原因与对策——一个需要重视的新趋势[J]. 河北经贸大学学报, 2019, 40(3):1-9,39.
|
| [12] |
杜宇, 吴传清. 中国南北经济差距扩大:现象、成因与对策[J]. 安徽大学学报:哲学社会科学版, 2020, 44(1):148-156.
|
| [13] |
杨明洪, 黄平. 南北差距中的结构效应及空间差异性测度[J]. 经济问题探索, 2020(5):1-13.
|
| [14] |
张长星. 南北分化趋势下河南优化空间发展布局的对策研究[J]. 区域经济评论, 2020(4):60-71.
|
| [15] |
邹炎, 杨开忠. 南北经济协调不容忽视[J]. 中国科技信息, 1997(9):13.
|
| [16] |
赵建安. 中国南北区域经济发展的互补性研究[J]. 地理研究, 1998, 17(4):375-382.
|
| [17] |
李二玲, 覃成林. 中国南北区域经济差异研究[J]. 地理学与国土研究, 2002(4):76-78.
|
| [18] |
欧向军, 沈正平, 王荣成. 中国区域经济增长与差异格局演变探析[J]. 地理科学, 2006(6):641-648.
|
| [19] |
郭爱君, 范巧. 南北经济协调视角下国家级新区的北——南协同发展研究[J]. 贵州社会科学, 2019(2):117-127.
|
| [20] |
唐世芳, 赵作权. 中国制造业空间聚集与国内外市场的影响研究[J]. 工业技术经济, 2014, 33(5):40-47.
|
| [21] |
赵璐, 赵作权. 中国制造业的大规模空间聚集与变化——基于两次经济普查数据的实证研究[J]. 数量经济技术经济研究, 2014, 31(10):110-121,138.
|
| [22] |
赵璐, 赵作权, 王伟. 中国东部沿海地区经济空间格局变化[J]. 经济地理, 2014, 34(2):14-18,27.
|
| [23] |
赵璐, 赵作权. 基于特征椭圆的中国经济空间分异研究[J]. 地理科学, 2014, 34(8):979-986.
|
| [24] |
赵璐, 赵作权. 中国全国与沿海地区经济空间一体化趋势[J]. 开发研究, 2014(3):1-4,10-11,5.
|
| [25] |
赵作权. 空间格局统计与空间经济分析[M]. 北京: 科学出版社, 2014.
|
| [26] |
赵作权, 唐世芳, 赵璐. 2030年中国消费市场空间预测分析[J]. 城市与环境研究, 2015(2):36-48.
|
| [27] |
赵璐, 赵作权. 中国经济空间转型与新时代全国经济东西向布局[J]. 城市发展研究, 2018, 25(7):18-24,33,2.
|
| [28] |
吴三忙, 李善同. 国内市场一体化与制造业地理集聚演变研究[J]. 山西财经大学学报, 2011, 33(8):60-68.
|
| [29] |
刘志彪. 利用和培育国内市场问题的研究[J]. 学术研究, 2019(10):76-84.
|
| [30] |
|
| [31] |
|
| [32] |
|
| [33] |
|
| [34] |
|
| [35] |
赵作权. 地理空间分布整体统计研究进展[J]. 地理科学进展, 2009, 28(1):1-8.
|
| [36] |
赵作权. 中国经济核心—边缘格局与空间优化发展[J]. 管理世界, 2012(10):46-54,187.
|
| [37] |
张京祥, 刘雨平. 沿京杭大运河地区的空间发展——以京杭大运河扬州段为例[J]. 经济地理, 2008, 28(1):1-5.
|
| [38] |
孙久文, 易淑昶. 大运河文化带城市综合承载力评价与时空分异[J]. 经济地理, 2020, 40(7):12-21.
|
| [39] |
安江林. 我国西部地区南北大通道——“一带”与“一路”融合发展的桥梁[J]. 开发研究, 2019(6):43-50.
|
/
| 〈 |
|
〉 |

