
Supply-demand Characteristics of Medical Resources and Its Optimizing Countermeasures in Wuhan Under the Background of Graded Diagnosis and Treatment
Received date: 2020-06-08
Revised date: 2020-11-04
Online published: 2025-03-31
The hierarchical diagnosis and treatment system is to promote the rational use of medical facilities to relieve the tension of medical resources,and optimizing the spatial allocation of medical institutions at all levels is an important guarantee to promote the implementation of the hierarchical diagnosis and treatment system. Taking Wuhan as research area and based on the supply-demand of medical facilities,this paper analyzes the spatial distribution characteristics of residents' medical demand and medical facility supply at different level,and points out the supply-demand contradiction of medical facilities in Wuhan city. It shows big differences on the spatial distribution of medical facilities,and the supply intensity of medical facilities presents the uneven phenomenon which is higher in central urban than the suburban,The supply-demand contradiction of medical resources in general hospitals (especially third-class hospitals) is prominent,and community-level medical facilities are in short supply and low utilization rate. Therefore,it is suggested to improve the precise allocation of community medical facilities and resources,strengthen the balanced coverage of general hospitals,and build a medical facility linkage network suitable for the hierarchical diagnosis and treatment system,so as to promote the in-depth implementation of the hierarchical diagnosis and treatment system.
GUO Liang , PENG Yuqing , HE Hui , YUAN Man . Supply-demand Characteristics of Medical Resources and Its Optimizing Countermeasures in Wuhan Under the Background of Graded Diagnosis and Treatment[J]. Economic geography, 2021 , 41(7) : 73 -81 . DOI: 10.15957/j.cnki.jjdl.2021.07.008
表1 不同医疗机构的服务范围划分Tab.1 Division of service scope of medical institutions |
| 近距离出行(km) | 远距离出行(km) | |
|---|---|---|
| 三甲医院 | 2~5 | 5~10 |
| 其他综合医院 | 1~2 | 2~5 |
| 社区卫生服务 | 0~1 | 1~2 |
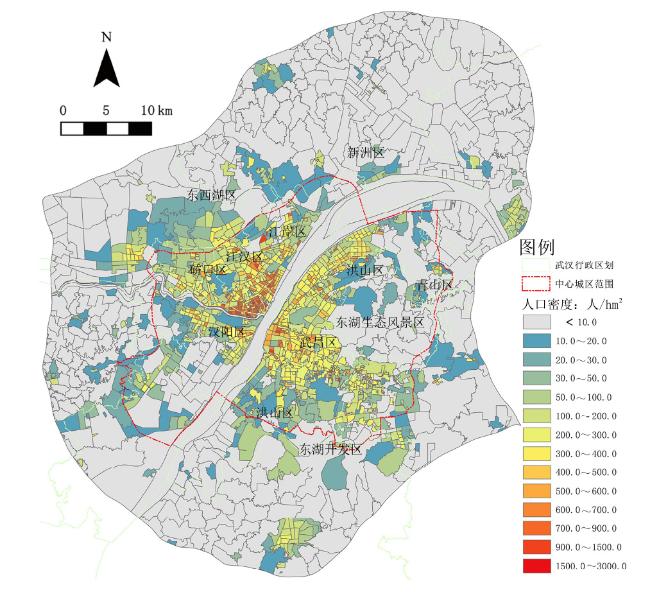
表2 武汉市人口密度空间分布统计Tab.2 Spatial distribution statistics of population density in Wuhan |
| 总人口密度(人/hm2) | 区域面积(hm2) | 占比(%) |
|---|---|---|
| 1 000~3 000 | 112.86 | 0.24 |
| 500~1 000 | 2 198.24 | 4.68 |
| 100~500 | 19 811.95 | 42.21 |
| <100 | 24 815.00 | 52.87 |
| 合计 | 46 938.05 | 100.00 |
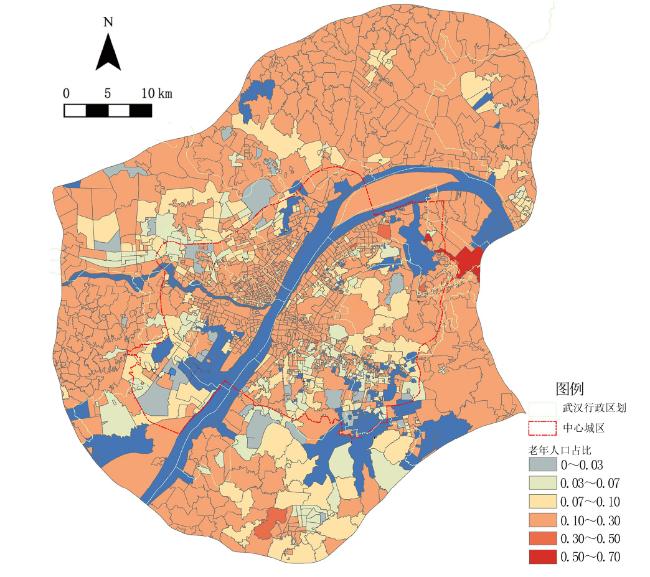
表3 社区老年人口分布统计Tab.3 Demographic distribution of the elderly |
| 老年人数量 占比(%) | 所在社区 | ||||
|---|---|---|---|---|---|
| 数量(个) | 占比(%) | 面积(km2) | 占比(%) | ||
| >50 | 3 | 0.17 | 10.41 | 0.46 | |
| 30~50 | 9 | 0.52 | 7.43 | 0.33 | |
| 10~30 | 1 187 | 69.13 | 1 439.28 | 63.42 | |
| 7~10 | 202 | 11.76 | 314.42 | 13.86 | |
| <7 | 316 | 18.40 | 497.80 | 21.94 | |
表5 2017年武汉市不同地区每千常住人口卫生资源状况Tab.5 Health resources per thousand permanent residents in different regions of Wuhan in 2007 |
| 指标 | 卫生机构数(个) | 实有床位(张) | 卫生技术 人员(人) | 执业(助理) 医师(人) |
|---|---|---|---|---|
| 中心城区 | 0.48 | 10.25 | 12.00 | 4.13 |
| 远城区 | 0.26 | 5.27 | 5.00 | 1.96 |
| 武汉市整体水平 | 0.4 | 8.41 | 9.41 | 3.33 |
表6 社区单元的人均床位数统计Tab.6 Statistics on the number of beds per thousand people in community unit |
| 千人床位数 (张) | 社区 单元数 | 总面积(km2) 及占比(%) | 总人口(人) 及占比(%) |
|---|---|---|---|
| <1.0 | 599 | 1 158.88(51.07) | 1 175 972(13.50) |
| 1.0~4.0 | 23 | 46.50(2.05) | 267 421(3.07) |
| 4.0~7.0 | 26 | 59.89(2.64) | 204 702(2.35) |
| 7.0~8.4 | 9 | 19.75(0.87) | 132 977(1.53) |
| 8.4~50 | 188 | 315.03(13.88) | 1 919 252(22.04) |
| 50~100 | 343 | 287.60(12.67) | 2 652 818(30.46) |
| >100 | 529 | 381.73(16.82) | 2 355 941(27.05) |
| 总计 | 1 717 | 2 269.38(100.00) | 8 709 083(100.00) |
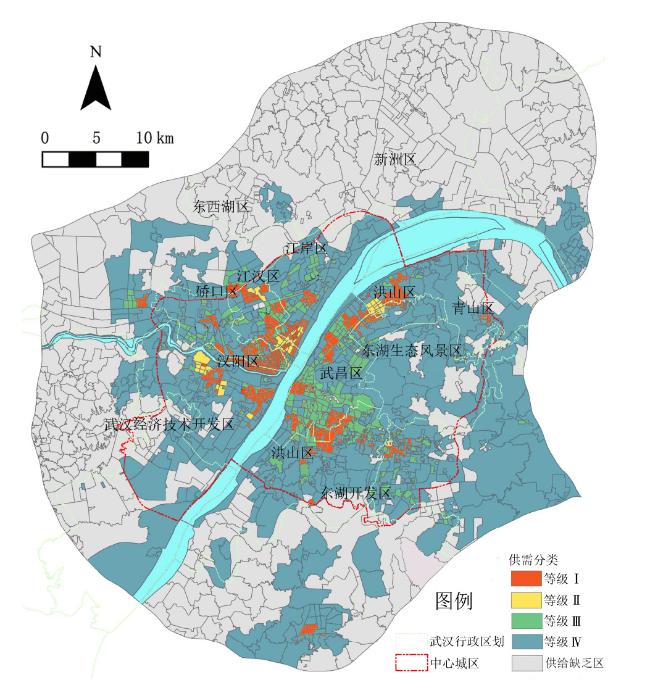
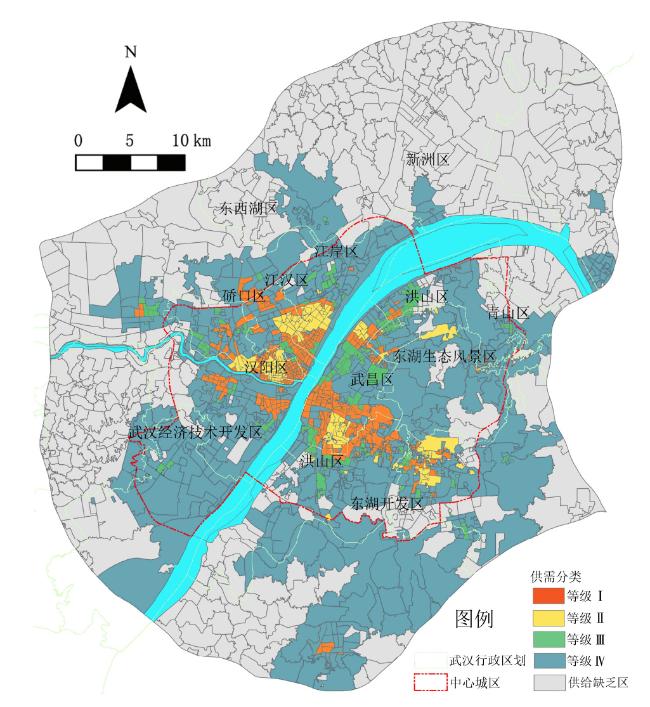
图8 社区医疗设施供需等级分区示意Fig.8 Supply-demand classification of community medical facilities |
表7 社区医疗卫生机构供需等级分区统计Tab.7 Supply-demand level of community health institutions |
| 供给等级 | 人均 床位 (张) | 社区 数量 (个) | 区域总面积(km2)及占比(%) | 区域总人口(人) 及占比(%) |
|---|---|---|---|---|
| 等级Ⅰ | 0.183 | 514 | 941.00(41.46) | 2 469 607(28.36) |
| 等级Ⅱ | 0.025 | 43 | 9.21(0.41) | 242 675(2.79) |
| 等级Ⅲ | 0.010 | 290 | 55.83(2.46) | 2 222 300(25.52) |
| 等级Ⅳ | 0.004 | 253 | 66.34(2.92) | 2 281 792(26.20) |
| 供给缺乏区 | 0 | 617 | 1 197.00(52.75) | 1 492 709(17.14) |
| 总计 | 0.114 | 1 717 | 2 269.38(100.00) | 8 709 083(100.00) |
表8 社区级医疗设施空间分布统计Tab.8 Spatial distribution statistics of community-level medical facilities |
| 医疗机构数量 (个) | 千人床位数 (张) | 服务范围面积占比 (%) | |
|---|---|---|---|
| 研究范围 | 465 | 1.14 | 27.1 |
| 中心城区 | 323 | 1.03 | 30.0 |
| 远城区 | 142 | 1.57 | 26.0 |
表9 综合医院供需等级分区统计Tab.9 Supply-demand level of general hospitals |
| 供给等级 | 人均床 位(张) | 社区数量(个) | 区域总面积(km2) 及占比(%) | 区域总人口(人) 及占比(%) |
|---|---|---|---|---|
| 等级Ⅰ | 1.852 | 484 | 955.72(42.11) | 2 315 145(26.58) |
| 等级Ⅱ | 0.306 | 112 | 37.68(1.66) | 884 510(10.16) |
| 等级Ⅲ | 0.126 | 322 | 69.04(3.04) | 2 587 842(29.71) |
| 等级Ⅳ | 0.060 | 154 | 35.24(1.55) | 1 197 079(13.75) |
| 供给缺乏区 | 0 | 645 | 1 171.71(51.63) | 1 724 507(19.80) |
表10 社区分类及医疗需求Tab.10 Classification of community and characteristics of medical service demand |
| 社区类型 | 年龄占比 | 医疗服务需求特点 |
|---|---|---|
| 类型Ⅰ | 60岁人口比例≥30% | 建立专业的老年人医疗服务体系,满足老年人日常及突发疾病的治疗需求 |
| 类型Ⅱ | 30%>60岁人口比例≥10% | 以老年人的日常检查、护理需求为重点,医疗服务注重便捷 |
| 类型Ⅲ | 10%>60岁人口比例≥7% | 以日常诊疗为主,同时突出老年人医疗服务 |
| 类型Ⅳ | 60岁人口比例<7% | 日常疾病治疗为主 |
表11 新增综合医院配置建议Tab.11 Suggestions on the allocation of new general hospitals |
| 供给缺乏区 | 需配置市级综合医院 | 需配置片区级综合医院 | |||||||
|---|---|---|---|---|---|---|---|---|---|
| 社区数量(个) | 总人口(万人) | 医院数量(家) | 床位规模(张) | 建议位置 | 医院数量(家) | 床位规模(张) | 建议位置 | ||
| 645 | 172.45 | 1~2 | 500~1 000 | 新洲、东西湖区 | 10~15 | 200~500 | 东西湖、黄陂、新洲、蔡甸 | ||
表12 片区级综合医院与社区级医院的联合建议Tab.12 Recommendation ratio between district general hospital and community hospital |
| 区位 | 社区 | 综合医院 | 综合医院—社区医院 联合体构成比 | 社区医院服务 社区比 | ||
|---|---|---|---|---|---|---|
| 平均面积(hm2) | 平均人口(人) | 服务半径(km) | 服务人口(万人) | |||
| 城区 | 65.79 | 6 300 | 2 | 10~20 | 1∶2~1∶8 | 1∶2~1∶6 |
| 乡镇 | 352.38 | 2 200 | 4 | 10~20 | ||
| [1] |
王虎峰, 元瑾. 对建立分级诊疗相关问题的探讨[J]. 中国医疗管理科学, 2015, 5(1):11-15.
|
| [2] |
吕键. 论深化医改进程中分级诊疗体系的完善[J]. 中国医院管理, 2014(6):1-3.
|
| [3] |
杨兴怡, 方子, 方鹏骞, 等. 我国分级诊疗制度评价体系研究[J]. 中国医院管理, 2017, 37(5):1-4.
|
| [4] |
徐杰. 乡镇卫生院运行机制述评[J]. 卫生经济研究, 2018(7):3-5.
|
| [5] |
梁岩. 抓住战“疫”契机加速推行分级诊疗[N]. 常州日报,2020-03-02(A04).
|
| [6] |
|
| [7] |
|
| [8] |
湛东升, 张文忠, 党云晓, 等. 北京市公共服务设施空间集聚特征分析[J]. 经济地理, 2018, 38(12):76-82.
|
| [9] |
刘倩, 李诚固, 申庆喜, 等. 长春市医疗设施空间格局与演变特征[J]. 经济地理, 2017, 37(7):139-145.
|
| [10] |
唐健雄, 马梦瑶, 陈宁, 等. 长株潭城市群养老设施空间分异特征及影响因素[J]. 经济地理, 2019, 39(1):113-121.
|
| [11] |
黄经南, 陈敏, 李玉岭, 等. 基于最优路径分析和两步移动搜索法的武汉市医疗卫生设施服务水平评价与优化[J]. 现代城市研究, 2019(8):25-34.
|
| [12] |
刘璇. 基于可达性的医疗服务均等性评价与优化布局[D]. 武汉: 武汉大学, 2017.
|
| [13] |
刘静, 朱青. 城市公共服务设施布局的均衡性探究——以北京市城六区医疗设施为例[J]. 城市发展研究, 2016, 23(5):6-11.
|
| [14] |
严杰. 城市公共服务设施空间可达性评价方法研究[D]. 南京: 东南大学, 2016.
|
| [15] |
杨钦宇, 徐建刚. 基于引力可达性的公共服务设施公平性评价模型构建[J]. 规划师, 2015, 31(7):96-101.
|
| [16] |
季舒铭, 王维, 张佩, 等. 分级诊疗背景下医院人力资源配置的合理性研究[J]. 中国循证医学杂志, 2020, 20(9):1004-1011.
|
| [17] |
周晔玲, 蓝相洁, 司明舒, 等. 基于分级诊疗的广西卫生人力资源配置分析[J]. 中国卫生经济, 2018, 37(7):51-53.
|
| [18] |
宋之杰, 郭燕平, 吉增良, 等. 分级诊疗下二三级医院服务资源整合的演化博弈分析[J]. 中国卫生政策研究, 2018, 11(2):44-51.
|
| [19] |
向潇浩, 苗瑞, 江志斌. 我国分级诊疗制度的三方序贯博弈模型研究[J]. 中国卫生事业管理, 2020, 37(9):641-643.
|
| [20] |
聂艺菲, 冯长春. 基于分级诊疗的就医可达性研究——以潍坊市中心城区为例[J]. 北京大学学报:自然科学版, 2020, 56(2):307-314.
|
| [21] |
钟少颖, 杨鑫, 陈锐. 层级性公共服务设施空间可达性研究——以北京市综合性医疗设施为例[J]. 地理研究, 2016, 35(4):731-744.
|
| [22] |
黄毅, 佟晓光. 中国人口老龄化现状分析[J]. 中国老年学杂志, 2012, 32(21):4853-4855.
|
| [23] |
高军波, 韩勇, 王义民, 等. 基于个体行为的城市居民就医空间及规划思考——以广州中心城区为例[J]. 城市规划, 2017, 41(10):46-52.
|
| [24] |
申悦, 史祎雯, 王虹翔, 等. 医疗设施可达性对患者就医空间的影响研究——基于上海市医院患者调查的实证[J]. 城市发展研究, 2019, 26(12):46-52,61.
|
| [25] |
钟晴, 李俊林, 李毅琳, 等. 武汉市居民基本医疗素养现状及影响因素分析[J]. 中国公共卫生, 2019, 35(5):558-562.
|
/
| 〈 |
|
〉 |