
The Variation in Regional Gap of China's Basic Pension and Its Influencing Factors
Received date: 2021-05-23
Revised date: 2021-10-26
Online published: 2025-03-31
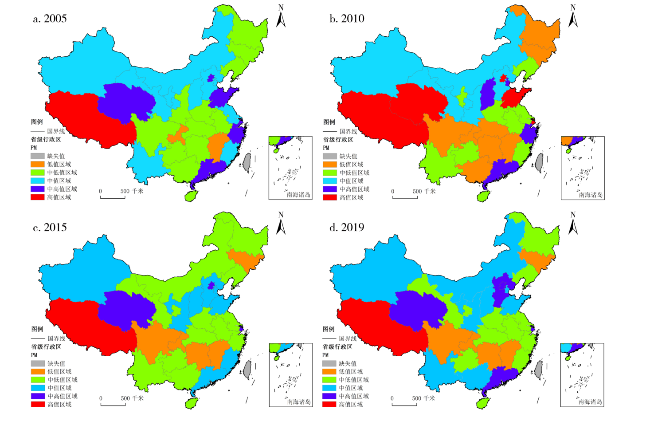
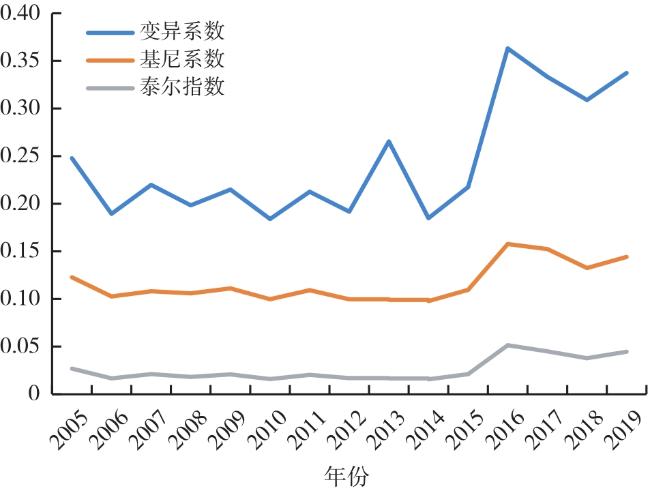
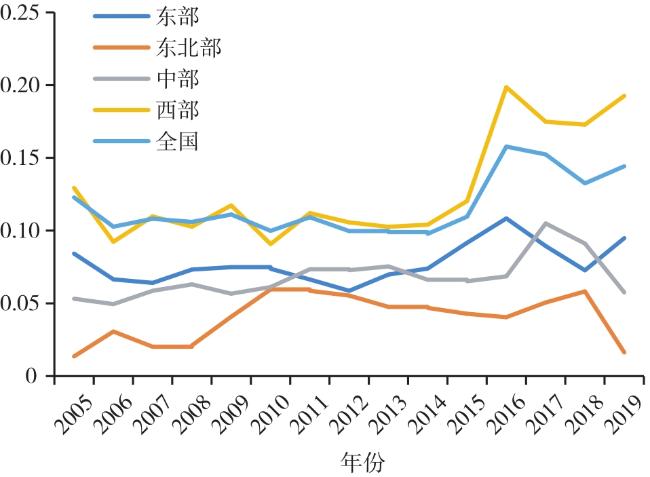
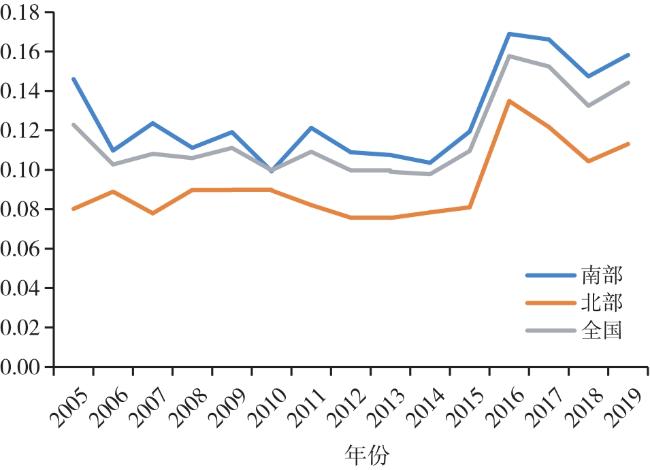
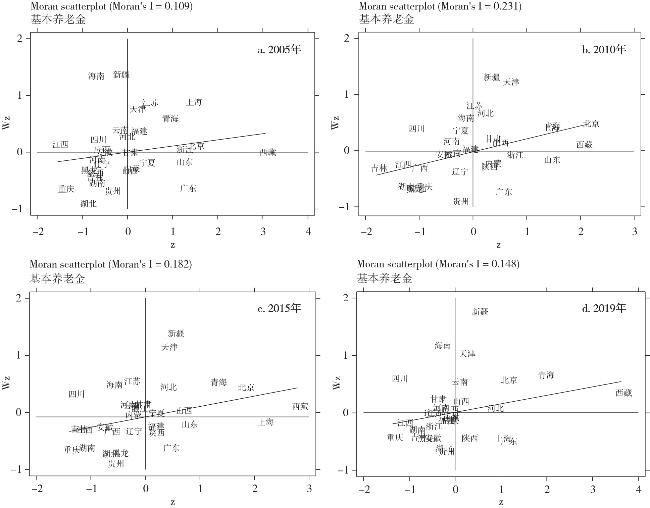
China's basic pension system is still in the stage of provincial pooling,and the basic pension gap resulted by region segmentation has attracted increasing attention of society. Based on China's provincial panel data from 2005 to 2019,this paper systematically and quantitatively analyzed the variation characteristics in regional gap of China's basic pension,and constructed a spatial Durbin model to explore the influencing factors. The results show that: 1) The absolute gap of China's basic pension has been constantly expanding,but the relative gap has showed the increasing trend since 2016. 2) The basic pension gap is higher in the western and eastern regions than those in the central and northeastern regions. In the southern and northern regions, the average basic pension gap between the southern and northern regions is relatively small,but the relative basic pension gap in the southern region is significantly higher than that in the northern region. 3) Regions with high-value and medium-high-value mainly include Tibet and Qinghai,as well as some developed provinces in the eastern coast. Regions with low-value mainly locate in the northeast,south-central and southwestern regions. 4) The decomposition results of Theil index show that inner-group has much more contribution than the inter-group,and the gap of the inner-group basic pension is the main reason for the gap of the national basic pension. 5) Spatial factor,lagging factor,economic factor,institutional factor and demographic factor all have a significant impact on the gap of basic pension in China. Basic pension between each province has the obvious characteristics,such as spatial positive correlation effect,ratchet effect,and pegging wage growth behavior. Besides,the higher the system support rate and the elderly support rate, the lower the basic pension.
ZHANG Songbiao , LIU Changgeng . The Variation in Regional Gap of China's Basic Pension and Its Influencing Factors[J]. Economic geography, 2021 , 41(12) : 43 -54 . DOI: 10.15957/j.cnki.jjdl.2021.12.005
表1 2005—2019年全国及各区域平均基本养老金(单位:元/月)Tab.1 National and regional average basic pensions from 2005 to 2019(unit: yuan/month) |
| 年份 | 全国 | 东部 | 中部 | 西部 | 东北部 | 南部 | 北部 |
|---|---|---|---|---|---|---|---|
| 2005 | 779.43 | 890.14 | 648.97 | 786.50 | 642.99 | 790.46 | 764.15 |
| 2006 | 889.66 | 1 004.85 | 754.81 | 904.40 | 716.40 | 888.58 | 891.14 |
| 2007 | 1 022.83 | 1 144.52 | 874.75 | 1 044.33 | 827.37 | 1 028.52 | 1 014.96 |
| 2008 | 1 181.40 | 1 321.33 | 1 009.10 | 1 205.42 | 963.51 | 1 157.35 | 1 214.70 |
| 2009 | 1 314.13 | 1 460.76 | 1 126.76 | 1 347.99 | 1 064.65 | 1 292.05 | 1 344.69 |
| 2010 | 1 424.26 | 1 596.87 | 1 243.89 | 1 435.00 | 1 166.66 | 1 387.62 | 1 474.99 |
| 2011 | 1 606.31 | 1 807.31 | 1 377.30 | 1 621.68 | 1 332.88 | 1 576.50 | 1 647.59 |
| 2012 | 1 794.24 | 1 990.90 | 1 570.36 | 1 811.85 | 1 516.01 | 1 748.39 | 1 857.72 |
| 2013 | 1 971.74 | 2 160.87 | 1 734.14 | 1 999.05 | 1 707.23 | 1 916.79 | 2 047.82 |
| 2014 | 2 170.41 | 2 378.62 | 1 937.25 | 2 187.05 | 1 876.17 | 2 107.08 | 2 258.11 |
| 2015 | 2 433.07 | 2 671.02 | 2 149.69 | 2 460.11 | 2 098.51 | 2 367.15 | 2 524.34 |
| 2016 | 2 810.48 | 2 962.94 | 2 265.89 | 3 107.86 | 2 201.94 | 2 767.92 | 2 869.41 |
| 2017 | 3 181.96 | 3 178.34 | 2 725.25 | 3 641.97 | 2 267.44 | 3 249.59 | 3 088.32 |
| 2018 | 3 415.22 | 3 526.89 | 3 234.51 | 3 627.84 | 2 551.16 | 3 468.66 | 3 341.23 |
| 2019 | 3 623.91 | 3 786.06 | 3 062.92 | 3 948.24 | 2 908.12 | 3 557.73 | 3 715.56 |
表2 2005—2019年全国及各区域平均基本养老金的极差(单位:元/月)Tab.2 The range of the national and regional average basic pension from 2005 to 2019 (unit: yuan/month) |
| 年份 | 全国 | 东部 | 中部 | 西部 | 东北部 | 南部 | 北部 |
|---|---|---|---|---|---|---|---|
| 2005 | 942.57 | 404.28 | 218.63 | 926.90 | 38.99 | 942.57 | 425.67 |
| 2006 | 723.17 | 433.26 | 216.70 | 613.32 | 98.68 | 723.17 | 517.97 |
| 2007 | 1 146.25 | 424.49 | 327.89 | 1 026.46 | 75.09 | 1 146.25 | 532.61 |
| 2008 | 1 016.78 | 644.32 | 385.31 | 887.79 | 91.35 | 1 016.78 | 715.06 |
| 2009 | 1 288.68 | 726.20 | 355.29 | 1 231.43 | 195.66 | 1288.67 | 841.53 |
| 2010 | 1 037.28 | 696.66 | 418.81 | 853.69 | 313.00 | 904.26 | 1 037.28 |
| 2011 | 1 606.24 | 772.69 | 575.07 | 1 490.71 | 351.31 | 1 606.24 | 1 161.62 |
| 2012 | 1 599.61 | 792.07 | 623.74 | 1 515.76 | 377.19 | 1 599.61 | 1 190.79 |
| 2013 | 1 769.64 | 1 031.70 | 787.86 | 1 649.82 | 365.41 | 1 769.64 | 1 279.54 |
| 2014 | 1 725.56 | 1 137.47 | 750.95 | 1 725.56 | 396.41 | 1 725.56 | 1 414.54 |
| 2015 | 2 306.37 | 1 527.24 | 815.48 | 2 306.37 | 404.25 | 2 306.37 | 1 535.40 |
| 2016 | 5 412.51 | 2 248.45 | 917.03 | 5 412.51 | 400.85 | 5 412.51 | 2 510.76 |
| 2017 | 5 748.06 | 1 704.96 | 1 686.71 | 5 379.87 | 516.31 | 5 647.22 | 2 180.22 |
| 2018 | 6 023.12 | 1 348.56 | 1 699.14 | 5 877.21 | 667.69 | 5 877.21 | 2 116.09 |
| 2019 | 6 505.95 | 1 624.79 | 967.37 | 6 505.95 | 211.38 | 6 505.95 | 2 967.81 |
表3 空间杜宾模型回归结果Tab.3 Regression results of spatial Dubin model |
| 系数 | 一阶邻接空间权重 | 地理距离空间权重 | 经济距离空间权重 | |||||
|---|---|---|---|---|---|---|---|---|
| Fe | Re | Fe | Re | Fe | Re | |||
| 0.2492***(4.20) | 0.2339***(4.34) | 0.2168*(1.79) | 0.2265**(2.46) | 0.2186***(3.71) | 0.2493***(4.62) | |||
| lnPi,t-1 | 0.2259**(2.17) | 0.3587***(3.02) | 0.2339***(2.56) | 0.3516***(3.52) | 0.2716***(3.00) | 0.3995***(4.07) | ||
| lnAWi,t-1 | 0.3954***(5.69) | 0.4071***(5.44) | 0.4022***(4.68) | 0.4197***(6.11) | 0.3826***(3.86) | 0.3673***(4.76) | ||
| CPIi,t-1 | -0.2335(-0.42) | -0.2322(-0.42) | -0.3385(-0.71) | -0.2222(-0.47) | -0.1270(-0.31) | -0.8001(-0.20) | ||
| lnFINi,t-1 | 0.0174(0.34) | 0.0155(0.34) | 0.0243(0.55) | 0.0271(0.66) | 0.0016(0.04) | 0.0104(0.27) | ||
| SMRi,t | -0.4535***(-4.03) | -0.3447***(-3.00) | -0.3681***(-4.26) | -0.2596***(-2.84) | -0.3612***(-4.37) | -0.2159**(-2.33) | ||
| ADPi,t-1 | -1.9259(-1.07) | -1.4217(-1.16) | -1.0051(-0.51) | -1.2253(-0.85) | -0.0362(-0.02) | -0.0739(-0.05) | ||
| URi,t | -0.1939(-0.78) | -0.1837(-0.72) | -0.0887(-0.33) | -0.3635(-1.53) | -0.5901(-1.54) | -0.6206(-1.56) | ||
| OPDRi,t | -1.1179**(-1.98) | -1.2104***(-2.80) | -1.3597**(-2.51) | -1.3796***(-3.20) | -0.6542(-1.43) | -0.9129**(-2.48) | ||
| cons | - | 0.2644(1.46) | - | -0.1721(-0.37) | - | 0.1906(0.68) | ||
| W·lnPi,t-1 | 0.1669*(1.90) | 0.1436**(2.23) | 0.2286**(2.42) | 0.5585**(2.06) | 0.0927***(2.62) | 0.0427**(2.34) | ||
| W·lnAWi,t-1 | 0.0858***(2.72) | 0.1845*(1.87) | 0.4115***(4.80) | 0.5145*(1.84) | 0.1337**(2.16) | 0.0114**(2.09) | ||
| W·CPIi,t-1 | -0.1206(-0.20) | -0.0180(-0.03) | -0.2900(-0.64) | -0.1531(-0.28) | -0.2269(-0.49) | -0.1352(-0.31) | ||
| W·FINi,t-1 | 0.0587(0.97) | 0.0443(0.85) | 0.0234(0.56) | 0.0084(0.10) | 0.0235(0.36) | 0.0031(0.05) | ||
| W·SMRi,t | 0.3062(1.58) | 0.2991(1.65) | 0.2877(0.56) | 0.1581(0.36) | 0.3429(1.08) | 0.1624(0.66) | ||
| W·ADPi,t-1 | 0.7788(0.20) | 1.1928(0.60) | 0.5704(1.09) | 0.6185(1.71) | 0.5439(1.19) | 0.6585(1.32) | ||
| W·URi,t | -0.2905(-0.46) | -0.1178(-0.38) | -1.5037(-1.15) | -0.4204(-0.66) | -0.8704(-1.19) | -0.5549(-1.45) | ||
| W·OPDRi,t | 1.7616***(3.22) | 1.4105***(2.97) | 1.7309**(2.08) | 1.5196**(1.97) | 1.3089**(2.01) | 0.7331*(1.83) | ||
| Log-likelihood | 549.8165 | 498.2226 | 555.2506 | 500.6790 | 548.0629 | 495.9159 | ||
| 豪斯曼检验 | -12.8 | -9.06 | -11.07 | |||||
注:表中***、**、*分别表示在1%、5%和10%的显著性水平上显著。圆括号内的数值为Z值。下同。 |
表4 分时段回归分析Tab.4 Time-divided regression analysis |
| 系数 | 一阶邻接空间权重 | 地理距离空间权重 | 经济距离空间权重 | |||||
|---|---|---|---|---|---|---|---|---|
| 2005—2012 | 2013—2019 | 2005—2012 | 2013—2019 | 2005—2012 | 2013—2019 | |||
| 0.1285*(1.84) | 0.0695***(2.60) | 0.5008***(5.75) | 0.1406*(1.85) | 0.3403***(3.45) | 0.1611*(1.79) | |||
| lnPi,t-1 | 0.7222***(9.09) | 0.0336**(2.25) | 0.7668***(9.61) | 0.0560**(2.45) | 0.7471***(8.13) | 0.1237*(1.98) | ||
| lnAWi,t-1 | 0.1426**(2.12) | 0.9410***(5.79) | 0.1137*(1.81) | 0.9717***(6.20) | 0.1251*(1.79) | 0.8360***(4.49) | ||
| CPIi,t-1 | -0.4394(-1.28) | -1.0482(-0.42) | -0.2117(-0.51) | -0.4773(-0.20) | -0.2819(-0.77) | -0.7307(-0.32) | ||
| lnFINi,t-1 | -0.0448(-0.79) | -0.0727(-1.49) | -0.0508(-0.60) | -0.0593(-1.13) | -0.0653(1.24) | -0.0448(-0.80) | ||
| SMRi,t | -0.2119***(-3.80) | -0.3818**(-2.19) | -0.1375***(-2.60) | -0.2489*(-1.82) | -0.0981**(-2.02) | -0.1441**(-2.32) | ||
| ADPi,t-1 | -1.2132(-1.42) | -1.4895(-1.50) | -1.1415(-1.41) | -1.5638(-0.72) | -1.3722(-0.80) | -0.4289(-0.21) | ||
| URi,t | -0.2196(-0.58) | -0.4595(-1.37) | -0.2593(-0.91) | -0.6609(-1.39) | -0.3068(-0.80) | -0.8162(-1.35) | ||
| OPDRi,t | -0.4130*(-1.75) | -1.8101***(-2.79) | -0.4857**(-2.11) | -1.8668***(-3.23) | -0.6333***(-2.73) | -1.9134***(-3.08) | ||
| cons | 1.5543***(5.05) | -1.8258***(-2.62) | 2.6985***(3.51) | -2.6818(-1.25) | 1.9338***(3.51) | -3.1211**(-2.18) | ||
| Log-likelihood | 391.1636 | 187.4732 | 397.5876 | 187.2575 | 395.5238 | 186.3665 | ||
注:为简洁起见,影响因素的空间滞后效应回归结果未列出。 |
| [1] |
朱玲. 中国社会保障体系的公平性与可持续性研究[J]. 中国人口科学, 2010(5):2-12.
|
| [2] |
郑秉文, 孙永勇. 对中国城镇职工基本养老保险现状的反思——半数省份收不抵支的本质、成因与对策[J]. 上海大学学报:社会科学版, 2012, 29(3):1-16.
|
| [3] |
中国社会科学院经济研究所社会保障课题组. 多轨制社会养老保障体系的转型路径[J]. 经济研究, 2013(12):4-16.
|
| [4] |
|
| [5] |
王亚柯, 李鹏. 基于财产视角下的养老保险再分配研究[J]. 华中师范大学学报:人文社会科学版, 2020, 59(2):60-69.
|
| [6] |
李实, 吴凡, 徐晓静. 中国城镇居民养老金收入差距的变化[J]. 劳动经济研究, 2020, 8(5):3-21.
|
| [7] |
龙玉其. 从形式公平走向实质公平——我国养老保险制度改革的反思与前瞻[J]. 长白学刊, 2019(2):117-124.
|
| [8] |
蔡璨. 养老保险多轨制对不同群体的收入分配效应及公平性比较[J]. 商业经济研究, 2016(6):115-117.
|
| [9] |
|
| [10] |
阳义南, 肖建华, 黄秀女. 我国养老金不平等对家庭代际经济交换的影响[J]. 社会保障研究, 2019(4):32-41.
|
| [11] |
于新亮, 张文瑞, 郭文光, 等. 养老保险制度统一与劳动要素市场化配置——基于公私部门养老金并轨改革的实证研究[J]. 中国工业经济, 2021(1):36-55.
|
| [12] |
郝君富, 李心愉. 基于性别公平视角的养老金制度设计改革[J]. 中国人民大学学报, 2017, 31(3):118-127.
|
| [13] |
李琼, 周宇, 张蓝澜, 等. 中国城镇职工基本养老保险基金区域差异及影响机理[J]. 地理学报, 2018, 73(12):2409-2422.
|
| [14] |
韩喜平, 陈茉. 党的十八大以来中国完善养老保险制度的实践探索[J]. 理论学刊, 2019(1):89-95.
|
| [15] |
张苏, 李泊宁. 人口老龄化与养老金可持续性研究进展[J]. 经济学动态, 2021(2):126-142.
|
| [16] |
贾晗睿, 詹鹏, 李实. 收入再分配与老年人收入差距[J]. 中国人口科学, 2021(1):91-103.
|
| [17] |
李实, 赵人伟, 高霞. 中国离退休人员收入分配中的横向与纵向失衡分析[J]. 金融研究, 2013(2):1-18.
|
| [18] |
杨天宇. 中国居民转移性收入不平等成因的实证分析[J]. 中南财经政法大学学报, 2018(1):42-50.
|
| [19] |
|
| [20] |
侯慧丽, 程杰. 老龄化社会中养老金代际代内收入差距与养老金再分配[J]. 人口与发展, 2015, 21(1):12-21.
|
| [21] |
王晓军, 赵彤. 中国社会养老保险的省区差距分析[J]. 人口研究, 2006(2):44-50.
|
| [22] |
苏宗敏, 王涛. 我国养老金代际再分配的空间效应研究[J]. 区域金融研究, 2017(2):17-21.
|
| [23] |
苏宗敏. 中国各地区基本养老金增长的趋同化趋势研究[J]. 上海经济研究, 2016(7):104-111.
|
| [24] |
苏宗敏, 王中昭. 我国基本养老金增长的空间格局与空间效应[J]. 经济经纬, 2017, 34(3):19-24.
|
| [25] |
陈元刚, 李雪, 李万斌. 基本养老保险实现全国统筹的理论支撑与实践操作[J]. 重庆社会科学, 2012(7):19-25.
|
| [26] |
何文炯, 杨一心. 基本养老保险全国统筹学理基础辨析[J]. 中国社会保障, 2015(7):30-32.
|
| [27] |
夏珺, 李春根. 基本养老保险全国统筹:理论依据、实施难点与政策要点[J]. 地方财政研究, 2016(11):18-25.
|
| [28] |
彭浩然, 王琳琳. 中央调剂金比例对养老保险基金地区差距的影响[J]. 保险研究, 2019(7):106-115.
|
| [29] |
郑秉文, 牟兵. 养老金调待机制存在的问题与建议——基于2008年养老金上调的案例分析[J]. 宏观经济研究, 2009(1):10-13.
|
| [30] |
郑功成. 从地区分割到全国统筹——中国职工基本养老保险制度深化改革的必由之路[J]. 中国人民大学学报, 2015, 29(3):2-11.
|
| [31] |
贾晗睿, 詹鹏, 李实. “多轨制”养老金体系的收入差距——基于中国家庭收入调查数据的发现[J]. 财政研究, 2021(3):101-114.
|
| [32] |
苏宗敏. 中国基本养老金的空间集聚与溢出效应研究[J]. 技术经济与管理研究, 2015(12):132-136.
|
| [33] |
王震. 人口流动与养老金地区差距:基于回归的不平等分解[J]. 劳动经济研究, 2017, 5(1):61-82.
|
| [34] |
蔡小慎, 张瑞丽. 我国基本养老保险水平地区差异的影响因素之实证分析[J]. 大连理工大学学报:社会科学版, 2009, 30(1):93-97.
|
| [35] |
薛新东. 我国养老保险支出水平的影响因素研究——基于2005—2009年省级面板数据的实证分析[J]. 财政研究, 2012(6):7-10.
|
| [36] |
左香乡, 许新星. 我国区域社会保障差异评估与影响因素研究[J]. 湘潭大学学报:哲学社会科学版, 2014, 38(5):79-82.
|
| [37] |
刘洪伟, 刘一蓓. 基础养老金全国统筹的主要障碍与对策研究[J]. 中州学刊, 2020(2):76-83.
|
| [38] |
陈强. 高级计量经济学及Stata应用[M]. 北京: 高等教育出版社, 2014.
|
/
| 〈 |
|
〉 |