
Impact Effect of Rapid Transport System on Urban Tourism Productivity in the Yangtze River Economic Belt
Received date: 2021-12-27
Revised date: 2021-07-29
Online published: 2025-03-31
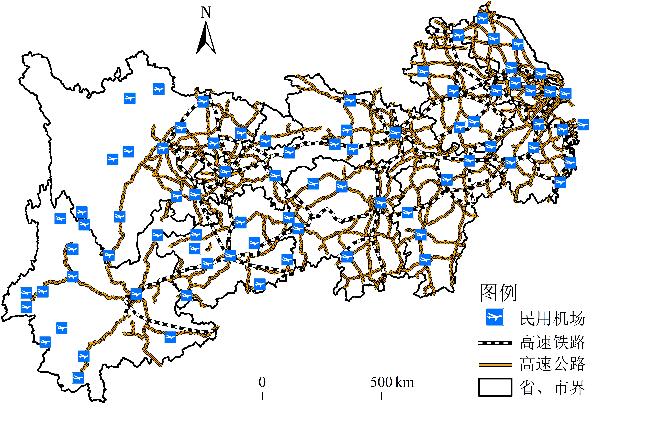
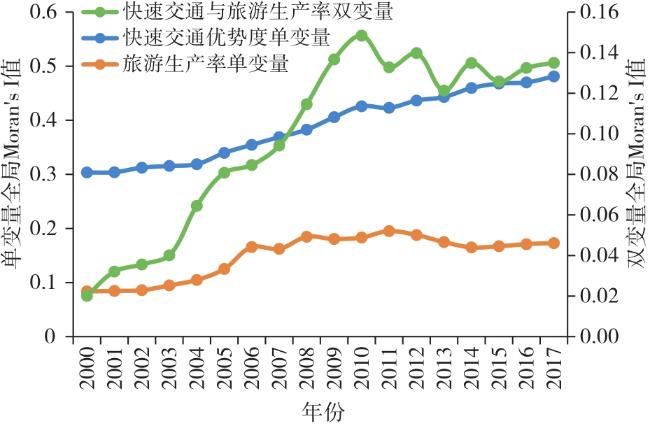
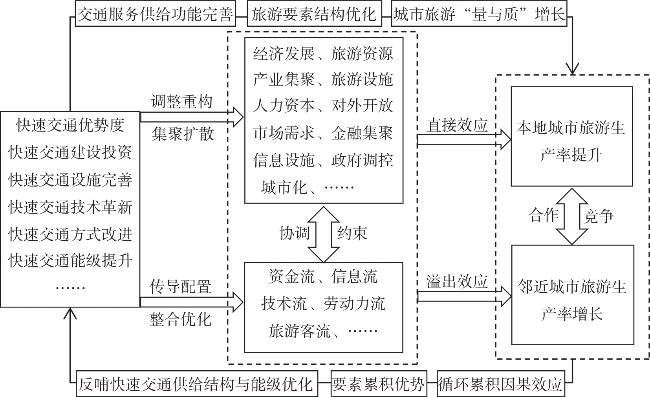
The Yangtze River Economic Belt is an important geographic unit and supporting platform for China's economic and social development,and is a gathering place for many key development factors of tourism. High-density tourism resources and tourism demand are in urgent need of efficient and rapid transportation facilities. Taking the Yangtze River Economic Belt as a research object and based on bivariate LISA model and spatial panel Tobit model,this study explores the spatial correlation characteristics of rapid transportation and tourism productivity in the Yangtze River Economic Belt from 2000 to 2017,and analyzes the spatial spillover effect of traffic superiority on tourism productivity and its mechanism. The results show that: 1) The bivariate agglomeration degree of rapid traffic superiority and tourism productivity in the Yangtze River Economic Belt(YREB) shows an overall strengthening trend,it presents the characteristic of spatially dependent. 2) The rapid transportation has significant spatial spillover effects on tourism productivity in the Yangtze River Economic Belt. The tourism productivity of city and surrounding cities' tourism productivity will increase by 0.2193% and 0.1182% respectively when the superiority degree of rapid traffic increases by 1%. The influence effect of rapid transportation shows the descending characteristics from the downstream of Yangtze River to the upstream". 3) Rapid transit system accelerates the flow and exchange of tourism elements among cities(regions) in the ways of agglomeration and diffusion,adjustment and reconstruction,conduction and configuration,integration and optimization. Urban tourism productivity promotes the structural optimization of rapid transit system and the improvement of service level through "feedback effect". This paper provides evidence on the relationship between rapid traffic and tourism productivity.
GUO Xiangyang , MU Xueqing , MING Qingzhong , LU Baoyi . Impact Effect of Rapid Transport System on Urban Tourism Productivity in the Yangtze River Economic Belt[J]. Economic geography, 2021 , 41(12) : 213 -222 . DOI: 10.15957/j.cnki.jjdl.2021.12.023
表1 快速交通优势度评价指标Tab.1 Evaluation index of rapid traffic superiority |
| 目标层 | 准则层 | 指标层 | 测算方法 |
|---|---|---|---|
| 快速交通优势度 | 高速公路 | 路网密度 | i城市高速公路通车里程与i城市国土面积之比(km/km2) |
| 路网优势度 | i城市高速公路密度与长江经济带平均水平的比值(%) | ||
| 衔接与服务功能 | i城市高速公路进出口数量与i城市国土面积之比(个/km2) | ||
| 中转集散功能 | 日均长途汽车客运站运输人次(万人/天) | ||
| 干线影响力 | 按照i城市行政中心与最近高速公路收费站距离D分段计分。若D≤30 km,计2分;30 km<D≤60 km,计1分;60 km<D,计0.5分 | ||
| 高速铁路 | 路网密度 | i城市高速铁路通车里程与i城市国土面积之比(km/km2) | |
| 站点密度 | i城市高铁站点数量与i城市国土面积之比(个/km2) | ||
| 站点等级 | 根据《全国铁路车站等级核定办法》对铁路站点等级的划分标准整理出i城市二等级及以上等级站点比重(%) | ||
| 通行规模 | 日停靠高铁车次数量。依据中国铁路12306官网、极品时刻表、路路通时刻表、盛名时刻表及各年份《全国铁路旅客列车时刻表》查询整理(辆/日) | ||
| 枢纽影响力 | 按照i城市行政中心与最近高铁站的距离D分段计分。若D≤30 km,计2分;30 km<D≤60 km,计1分;60 km<D,计0.5分 | ||
| 航空运输 | 机场等级 | 依据航空民航标准-MH5001-2000《民用机场飞行区技术标准》划分的飞行区等级分别赋值。即4F、4E、4D、4C、3C级机场分别赋10、8、6、4、2分 | |
| 通行规模 | 日均飞机起降架次。根据《民航机场生产统计公报》整理(架次/日) | ||
| 通行效率 | 日均旅客吞吐量。依据《民航机场生产统计公报》整理(万人次/日) | ||
| 枢纽影响力 | 按照i城市行政中心与最近民用机场的距离D分段计分。若D≤30 km,计2分;30 km<D≤60 km,计1分;60 km<D,计0.5分 |
表2 城市旅游生产率影响因素指标选取Tab.2 Influencing factor indicators of urban tourism productivity |
| 变量 | 指标名称 | 指标测算 |
|---|---|---|
| 被解释变量 | 城市旅游生产率(ln TP) | 城市旅游生产率 |
| 核心变量 | 快速交通优势度(ln traffic) | 采用主成分分析法对构建的高速公路、高速铁路和民航的评价指标进行验证、统一降维、加权求和得到快速优势度评价值 |
| 控制变量 | 经济发展水平(ln gdp) | 选取人均GDP(元/人)表征,采用GDP平减指数以2000年为基期折算得到 |
| 旅游资源禀赋(ln res) | 选取各城市4A级以上旅游景区数量(赋权1)、国家风景名胜区(赋权2)和世界自然文化遗产地(赋权4)进行加权求和表征 | |
| 旅游产业集聚(ln agg) | 借鉴郭悦等[30]对旅游产业集聚的测度方法,即采用区位熵指数来衡量旅游业的空间集中程度。lnaggit=(incomeit /gdpit)÷(incomet /gdpt),其中,aggit是第i城市t时期的区位熵指数,表示第i城市t时期旅游收入与全市GDP之商与长江经济带旅游收入与全区GDP之商的比值 | |
| 信息化水平(ln infor) | 选用移动电话交换机容量(台)[31]进行表征 | |
| 对外开放度(ln open) | 采用实际利用外商直接投资额(亿美元)占GDP(亿元)比重[32]进行表征 |
表3 长江经济带及其三大区域空间面板计量模型的检验结果Tab.3 The test results of spatial panel econometric models of the Yangtze River Economic Belt and three regions |
| 检验方法 | 长江经济带 | 长江上游地区 | 长江中游地区 | 长江下游地区 | |||||||
|---|---|---|---|---|---|---|---|---|---|---|---|
| 统计值 | 概率 | 统计值 | 概率 | 统计值 | 概率 | 统计值 | 概率 | ||||
| LM-spatial lag | 21.1243 | 0.0000 | 26.3145 | 0.0000 | 19.3015 | 0.0001 | 30.2015 | 0.0000 | |||
| Robust LM-spatial lag | 13.1682 | 0.0002 | 15.3216 | 0.0010 | 18.3012 | 0.0007 | 22.1634 | 0.0012 | |||
| LM-spatial error | 79.2540 | 0.0000 | 63.2149 | 0.0000 | 45.6102 | 0.0053 | 56.3028 | 0.0000 | |||
| Robust LM-spatial error | 78.2978 | 0.0000 | 71.4567 | 0.0007 | 56.2310 | 0.0000 | 80.5102 | 0.0000 | |||
| Hausman | 1 863.1563 | 0.0000 | 1 002.3106 | 0.0000 | 885.6124 | 0.0000 | 998.1021 | 0.0005 | |||
| Wald-spatial lag | 39.3380 | 0.0000 | 30.1026 | 0.0052 | 25.6130 | 0.0006 | 42.1306 | 0.0044 | |||
| LR-spatial lag | 688.5503 | 0.0000 | 502.1364 | 0.0000 | 440.2198 | 0.0004 | 449.8231 | 0.0009 | |||
| Wald-spatial error | 34.1469 | 0.0000 | 21.3164 | 0.0001 | 16.3012 | 0.0000 | 19.3024 | 0.0002 | |||
| LR-spatial error | 879.7391 | 0.0000 | 452.3167 | 0.0000 | 398.4651 | 0.0000 | 336.9516 | 0.0000 | |||
| Log-L | 374.1941 | 126.3564 | 153.2694 | 174.0364 | |||||||
| Adj.R2 | 0.9112 | 0.8216 | 0.7963 | 0.8862 | |||||||
表4 快速交通及各控制变量对城市旅游生产率影响的直接效应、溢出效应与总效应Tab.4 Direct effects,spillover effects and total effects of rapid traffic and control variables on urban tourism productivity |
| 变量 | 长江经济带 | 长江上游地区 | 长江中游地区 | 长江下游地区 | |
|---|---|---|---|---|---|
| 直接效应 | lntraffic | 0.2193***(3.4677) | 0.0362*(1.7238) | 0.1632***(2.9845) | 0.3062***(5.2641) |
| lngdp | 0.1866***(10.2993) | 0.1035**(2.1035) | 0.1934***(3.1278) | 0.2108***(5.2194) | |
| lnres | 0.3556***(13.5244) | 0.3848***(5.2468) | 0.3429***(5.1249) | 0.3724***(5.1864) | |
| lnagg | 0.7632***(34.0789) | -0.2649(1.3824) | 0.5349(1.6213) | 0.7036***(3.6248) | |
| lninfor | 0.3887***(18.4854) | -0.1021***(-3.2016) | 0.3268***(5.3261) | 0.4236***(8.6459) | |
| lnopen | 0.0351***(4.4440) | 0.0196(0.6639) | 0.0294**(2.3697) | 0.0438***(3.2649) | |
| 溢出效应 | lntraffic | 0.1182***(3.2963) | 0.0438*(1.7102) | 0.1326***(3.4567) | 0.1564***(4.0216) |
| lngdp | 0.0886**(2.3053) | 0.0331(1.3210) | 0.0941***(3.4579) | 0.1348***(4.2018) | |
| lnres | -0.1764**(2.4490) | -0.1938***(3.0132) | -0.1023***(2.9845) | -0.1532***(2.9964) | |
| lnagg | -0.0407*(-1.9074) | -0.0214**(-2.0134) | -0.0531***(3.6429) | -0.0839***(4.3067) | |
| lninfor | 0.1308***(3.4803) | -0.0416(1.7238) | 0.1136(1.3658) | 0.1659***(3.2698) | |
| lnopen | 0.0101***(2.6647) | 0.0036(0.0368) | 0.0169***(2.6034) | 0.0236***(2.7958) | |
| 总效应 | lntraffic | 0.3375***(3.6325) | 0.0800**(2.0132) | 0.2958***(3.2198) | 0.4626***(6.3781) |
| lngdp | 0.2752***(6.9407) | 0.1366*(1.7216) | 0.2875***(4.2648) | 0.3456***(6.3218) | |
| lnres | 0.1792***(4.8146) | 0.1910***(3.2640) | 0.2406***(4.9326) | 0.2192***(4.6234) | |
| lnagg | 0.7225***(14.7421) | -0.2863**(3.0214) | 0.4818***(9.3026) | 0.6197***(12.3046) | |
| lninfor | 0.5195***(6.4936) | -0.1437(0.6653) | 0.4404***(5.3826) | 0.5895***(8.9246) | |
| lnopen | 0.0452*(1.6926) | 0.0232(1.3062) | 0.0463**(2.3695) | 0.0674***(2.9765) | |
| ρ | 0.1949***(6.5278) | 0.0246*(1.7032) | 0.1034***(3.3086) | 0.2468***(8.3046) | |
注:***、**和*分别表示在1%、5%和10%水平上显著;括号内为t统计量。 |
| [1] |
保继刚, 楚义芳. 旅游地理学[M]. 北京: 高等教育出版社, 2014.
|
| [2] |
|
| [3] |
郭向阳, 穆学青, 明庆忠, 等. 旅游地交通服务功能与旅游强度协调时空分异特征——以云南省为例[J]. 自然资源学报, 2020, 35(6):1425-1444.
|
| [4] |
|
| [5] |
|
| [6] |
张允翔, 周年兴, 申鹏鹏, 等. 1996—2016年间江苏省旅游空间结构演化与影响机制研究[J]. 长江流域资源与环境, 2018, 27(1):107-115.
|
| [7] |
|
| [8] |
|
| [9] |
郭向阳, 明庆忠, 吴建丽, 等. 云南省区域旅游空间结构演变研究[J]. 山地学报, 2017, 35(1):78-84.
|
| [10] |
|
| [11] |
|
| [12] |
郭向阳, 穆学青, 明庆忠, 等. 典型山区旅游地旅游效率与交通协调格局及演进模式[J]. 经济地理, 2020, 40(8):212-221.
|
| [13] |
|
| [14] |
魏丽, 卜伟, 王梓利. 高速铁路开通促进旅游产业效率提升了吗?——基于中国省级层面的实证分析[J]. 经济管理, 2018, 39(7):72-90.
|
| [15] |
张学良. 中国交通基础设施促进了区域经济增长吗?——兼论交通基础设施的空间溢出效应[J]. 中国社会科学, 2012(3):60-78.
|
| [16] |
张茜, 赵鑫. 交通基础设施及其跨区域溢出效应对旅游业的影响——基于星级酒店、旅行社、景区的数据[J]. 经济管理, 2018(4):118-133.
|
| [17] |
徐建华. 计量地理学[M]. 北京: 高等教育出版社, 2006.
|
| [18] |
韩言虎, 杨艳, 郑成华. 丝绸之路经济带城市国际化水平测度模型与实证研究[J]. 管理世界, 2018, 34(8):180-181.
|
| [19] |
穆学青, 郭向阳, 明庆忠. 边境地区旅游强度时空演化特征分析[J]. 经济地理, 2019, 39(1):233-240.
|
| [20] |
李平星, 陈雯, 孙伟. 经济发达地区乡村地域多功能空间分异及影响因素——以江苏省为例[J]. 地理学报, 2014, 69(6):797-807.
|
| [21] |
|
| [22] |
|
| [23] |
|
| [24] |
杨勇. 集聚密度、 多样性和旅游企业劳动生产率——兼对产业聚集理论观点的拓展研究[J]. 财贸经济, 2015, 35(2):148-160.
|
| [25] |
胡玉坤. 交通基础设施对旅游业劳动生产率的影响研究——基于空间溢出效应的视角[D]. 大连: 东北财经大学, 2016.
|
| [26] |
郭向阳, 穆学青, 明庆忠, 等. 旅游地快速交通优势度与旅游流强度的空间耦合分析[J]. 地理研究, 2019, 38(5):1119-1135.
|
| [27] |
|
| [28] |
金凤君, 王成金, 李秀伟. 中国区域交通优势的甄别方法及应用分析[J]. 地理学报, 2008, 63(8):787-798.
|
| [29] |
崔学刚, 方创琳, 张蔷. 山东半岛城市群高速交通优势度与土地利用效率的空间关系[J]. 地理学报, 2018, 73(6):1149-1161.
|
| [30] |
郭悦, 钟廷勇, 安烨. 产业集聚对旅游业全要素生产率的影响——基于中国旅游业省级面板数据的实证研究[J]. 旅游学刊, 2015, 30(5):14-22.
|
| [31] |
王龙杰, 曹国军, 毕斗斗. 信息化对旅游产业发展的空间溢出效应[J]. 地理学报, 2019, 74(2):366-378.
|
| [32] |
|
| [33] |
冯烽, 崔琳昊. 高铁开通与站点城市旅游业发展:“引擎”还是“过道”?[J]. 经济管理, 2020, 41(2):175-191.
|
| [34] |
|
| [35] |
保继刚. 为什么西部景区门票价格居高不降?——门票地域性差异问题[J]. 旅游学刊, 2019, 34(7):12-16.
|
/
| 〈 |
|
〉 |