
Spatiotemporal Evolution and Spatial Difference of Tourism-Ecology-Urbanization Coupling Coordination in Beijing-Tianjin-Hebei Urban Agglomeration
Received date: 2021-03-15
Revised date: 2021-10-19
Online published: 2025-03-31
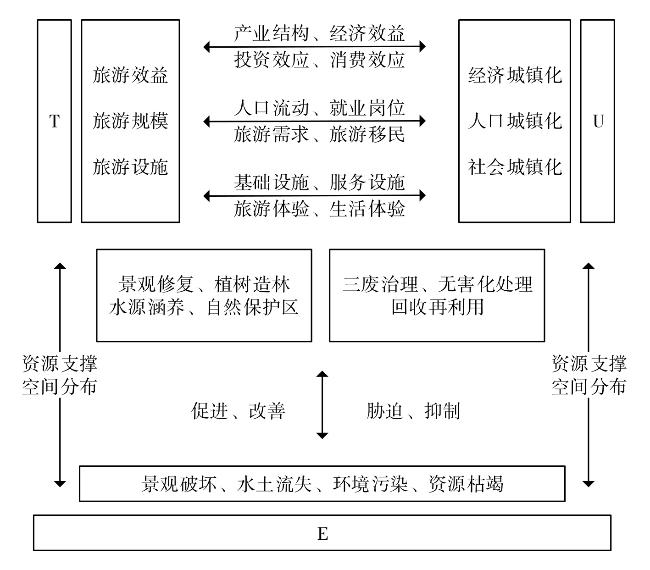
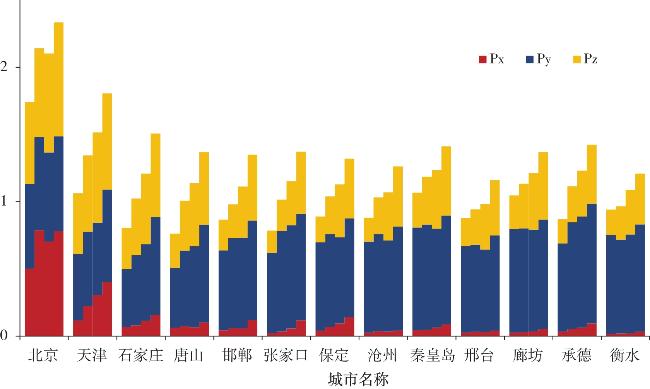
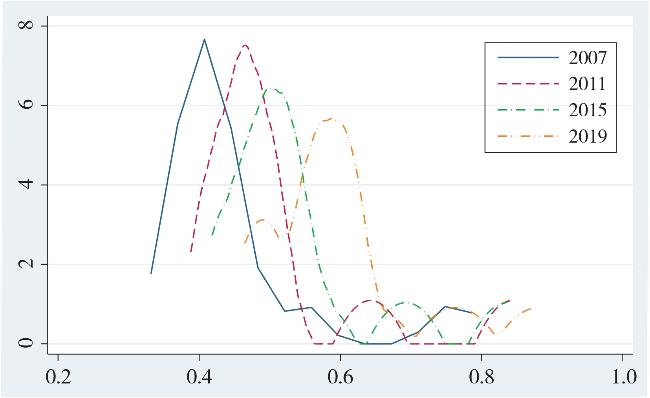
Taking the Beijing-Tianjin-Hebei urban agglomeration as the research area and based on the coupling mechanism of tourism-ecology-urbanization(TEU),this article constructs its evaluation index system,calculates the development indexes of tourism,ecology and urbanization and their coupling coordination degree,using exploratory spatial data analysis,kernel density estimation, Theil index and decomposition in Beijing-Tianjin-Hebei from 2007 to 2019,and analyzes its evolution characteristics. The results show that: 1) Development indexes of tourism,ecology and urbanization are different,but all maintain the growth trend. On the whole, the urbanization index is relatively high and enters the improvement stage of quality and efficiency,the tourism index is relatively low and enters the stage of transformation and upgrading, while the ecological index shows the characteristics of the stage and time lag. 2) Coupling coordination of TEU system shifts from high coupling-low coordination to high coupling-high coordination,and the coordination degree develops steadily from mild maladjustment to good coordination. High-value agglomeration areas distribute in Beijing, Tianjin, Baoding and Shijiazhuang, and there is a certain spillover effect. 3) The kernel density curve shows that the coordination degree is significantly improved, and the spatial distribution tends to be balanced, but there is still a "dominant city". Theil index shows that the spatial difference is small but has an expanding trend,reducing the regional difference between the south,central and northern is a key point to improve the coordination level of Beijing-Tianjin-Hebei.
WENG Gangmin , TANG Yibo , PAN Yue , MAO Yaqi . Spatiotemporal Evolution and Spatial Difference of Tourism-Ecology-Urbanization Coupling Coordination in Beijing-Tianjin-Hebei Urban Agglomeration[J]. Economic geography, 2021 , 41(12) : 196 -204 . DOI: 10.15957/j.cnki.jjdl.2021.12.021
表1 京津冀旅游—生态—城镇化耦合协调评价指标体系Tab.1 Evaluation index system of coupling coordination of TEU in Beijing-Tianjin-Hebei urban agglomeration |
| 目标层 | 一级指标 | 二级指标 | 单位 | 指标 属性 |
|---|---|---|---|---|
| 旅游 | 旅游效益 | 旅游外汇收入 | 万美元 | + |
| 国内旅游收入 | 亿元 | + | ||
| 旅游规模 | 入境旅游人数 | 万人次 | + | |
| 国内旅游人数 | 万人次 | + | ||
| 旅游从业人数 | 万人 | + | ||
| 旅游基础 | 星级饭店数 | 个 | + | |
| 公园个数 | 个 | + | ||
| 公路客运量 | 万人 | + | ||
| 生态 | 压力 | 人口密度 | 人/km2 | - |
| 工业SO2排放量 | t | - | ||
| 工业废水排放量 | 万t | - | ||
| 生活垃圾清运量 | 万t | - | ||
| 状态 | 空气质量好于二级天数 | 天 | + | |
| 人均公园绿地面积 | m2 | + | ||
| 人工造林面积 | hm2 | + | ||
| 响应 | 建成区绿化覆盖率 | % | + | |
| 污水处理率 | % | + | ||
| 生活垃圾无害化处理率 | % | + | ||
| 城镇化 | 经济城镇化 | 人均GDP | 元 | + |
| 城镇居民人均可支配收入 | 元 | + | ||
| 二三产业占GDP比重 | % | + | ||
| 全社会固定资产投资 | 亿元 | + | ||
| 人口城镇化 | 城镇化率 | % | + | |
| 二三产业从业人员比重 | % | + | ||
| 普通高等院校在校生数 | 人 | + | ||
| 社会城镇化 | 人均道路面积 | m2 | + | |
| 每万人拥有公共厕所数 | 座 | + | ||
| 每万人拥有医疗机构床位数 | 张 | + |
表2 耦合协调度度量标准及类型Tab.2 Metrics and types of coupling coordination degree |
| 序号 | 耦合协调度 | 协调等级 | 协调类型 |
|---|---|---|---|
| 1 | 0.0~0.1 | 极度失调 | 失调 |
| 2 | 0.1~0.2 | 严重失调 | |
| 3 | 0.2~0.3 | 中度失调 | |
| 4 | 0.3~0.4 | 轻度失调 | |
| 5 | 0.4~0.5 | 濒临失调 | 过渡 |
| 6 | 0.5~0.6 | 勉强协调 | |
| 7 | 0.6~0.7 | 初级协调 | 协调 |
| 8 | 0.7~0.8 | 中级协调 | |
| 9 | 0.8~0.9 | 良好协调 | |
| 10 | 0.9~1.0 | 优质协调 |
表3 京津冀旅游—生态—城镇化综合发展指数Tab.3 Comprehensive development index of TEU in Beijing-Tianjin-Hebei urban agglomeration |
| 年份 | Px | Py | Pz | P |
|---|---|---|---|---|
| 2007 | 0.0754 | 0.2607 | 0.0934 | 0.1432 |
| 2008 | 0.0945 | 0.3965 | 0.1453 | 0.2121 |
| 2009 | 0.3289 | 0.4276 | 0.2503 | 0.3356 |
| 2010 | 0.4171 | 0.5121 | 0.3665 | 0.4319 |
| 2011 | 0.4959 | 0.4775 | 0.4139 | 0.4624 |
| 2012 | 0.5820 | 0.4727 | 0.4938 | 0.5162 |
| 2013 | 0.4804 | 0.3757 | 0.5819 | 0.4793 |
| 2014 | 0.4154 | 0.4610 | 0.6134 | 0.4966 |
| 2015 | 0.4368 | 0.5209 | 0.6886 | 0.5487 |
| 2016 | 0.5094 | 0.6070 | 0.7160 | 0.6108 |
| 2017 | 0.5770 | 0.7271 | 0.7676 | 0.6906 |
| 2018 | 0.6225 | 0.7340 | 0.8576 | 0.7380 |
| 2019 | 0.6498 | 0.7458 | 0.9377 | 0.7777 |
表4 京津冀旅游—生态—城镇化耦合协调度Tab.4 Coupling coordination degree of TEU in Beijing-Tianjin-Hebei urban agglomeration |
| 年份 | C | D | 年份 | C | D | |
|---|---|---|---|---|---|---|
| 2007 | 0.8553 | 0.3500 | 2014 | 0.9862 | 0.6998 | |
| 2008 | 0.8294 | 0.4195 | 2015 | 0.9824 | 0.7342 | |
| 2009 | 0.9765 | 0.5725 | 2016 | 0.9904 | 0.7778 | |
| 2010 | 0.9905 | 0.6541 | 2017 | 0.9926 | 0.8279 | |
| 2011 | 0.9970 | 0.6790 | 2018 | 0.9915 | 0.8554 | |
| 2012 | 0.9959 | 0.7170 | 2019 | 0.9885 | 0.8768 | |
| 2013 | 0.9843 | 0.6869 |
表5 Moran散点图各象限包含的城市Tab.5 Cities contained in each quadrant of Moran scatter chart |
| 2007 | 2011 | 2015 | 2019 | |
|---|---|---|---|---|
| HH | 天津 | 天津 | 天津、保定 | 天津、保定 |
| LH | 保定、沧州、唐山、张家口 | 保定、沧州、唐山、张家口、承德 | 沧州、唐山、张家口、承德 | 沧州、唐山、张家口、承德 |
| LL | 衡水、廊坊、邢台、邯郸、承德 | 衡水、廊坊、邢台、邯郸、秦皇岛 | 衡水、廊坊、邢台、邯郸、秦皇岛 | 衡水、廊坊、邢台、邯郸、秦皇岛 |
| HL | 北京、石家庄、秦皇岛 | 北京、石家庄 | 北京、石家庄 | 北京、石家庄 |
表6 D的泰尔指数及贡献率Tab.6 Theil index and contribution rate of D |
| 年份 | 京津冀 | 组内 | 组内 | 组间 | ||
|---|---|---|---|---|---|---|
| 南 | 中 | 北 | ||||
| 2007 | 0.3080 | 0.1016(9.32) | 0.2015(33.29) | 0.0013(0.09) | 0.1315(42.69) | 0.1765(57.31) |
| 2008 | 0.3049 | 0.1120(10.28) | 0.2009(33.58) | 0.0008(0.05) | 0.1339(43.90) | 0.1711(56.10) |
| 2009 | 0.3039 | 0.1080(9.80) | 0.1951(33.20) | 0.0030(0.21) | 0.1313(43.21) | 0.1726(56.79) |
| 2010 | 0.3121 | 0.1013(9.00) | 0.1981(32.58) | 0.0045(0.30) | 0.1307(41.88) | 0.1814(58.12) |
| 2011 | 0.3114 | 0.1039(9.13) | 0.1946(32.14) | 0.0027(0.18) | 0.1291(41.45) | 0.1823(58.55) |
| 2012 | 0.3238 | 0.1036(8.98) | 0.1951(30.56) | 0.0033(0.21) | 0.1287(39.76) | 0.1951(60.24) |
| 2013 | 0.3489 | 0.1099(8.69) | 0.2120(30.78) | 0.0040(0.25) | 0.1386(39.72) | 0.2103(60.28) |
| 2014 | 0.3630 | 0.1069(8.10) | 0.2196(30.61) | 0.0038(0.23) | 0.1413(38.93) | 0.2217(61.07) |
| 2015 | 0.3754 | 0.0984(7.23) | 0.2336(31.41) | 0.0019(0.11) | 0.1454(38.75) | 0.2299(61.25) |
| 2016 | 0.3732 | 0.0887(6.65) | 0.2310(31.02) | 0.0012(0.07) | 0.1409(37.74) | 0.2323(62.26) |
| 2017 | 0.4005 | 0.0823(5.77) | 0.2521(31.11) | 0.0008(0.04) | 0.1479(36.93) | 0.2526(63.07) |
| 2018 | 0.4495 | 0.0937(5.86) | 0.3003(32.95) | 0.0010(0.05) | 0.1747(38.86) | 0.2748(61.14) |
| 2019 | 0.4141 | 0.0704(4.77) | 0.2906(34.75) | 0.0008(0.04) | 0.1638(39.56) | 0.2503(60.44) |
| [1] |
申伟宁, 李东松, 董葆茗. 京津冀经济发展与空气质量的耦合协调性研究[J]. 技术经济与管理研究, 2021(1):13-17.
|
| [2] |
单晨, 陈艺丹. 京津冀旅游产业—区域经济—社会事业协调发展差异研究[J]. 经济与管理, 2020, 34(3):1-11.
|
| [3] |
荣慧芳, 陶卓民, 刘琪, 等. 皖南地区旅游产业—城镇化—生态环境耦合协调的时空演变[J]. 水土保持研究, 2019, 26(4):280-285.
|
| [4] |
杨秀平, 贾云婷, 翁钢民, 等. 城市旅游环境系统韧性的系统动力学研究——以兰州市为例[J]. 旅游科学, 2020, 34(2):23-40.
|
| [5] |
|
| [6] |
崔凤军. 论旅游环境承载力——持续发展旅游的判据之一[J]. 经济地理, 1995, 15(1):105-109.
|
| [7] |
|
| [8] |
|
| [9] |
赵书虹, 白梦, 阮梦枝, 等. 云南省旅游资源与生态安全协调发展的时空演化特征及障碍因子分析[J]. 地理科学, 2021, 41(3):493-503.
|
| [10] |
宋建波, 武春友. 城市化与生态环境协调发展评价研究——以长江三角洲城市群为例[J]. 中国软科学, 2010(2):78-87.
|
| [11] |
崔木花. 中原城市群9市城镇化与生态环境耦合协调关系[J]. 经济地理, 2015, 35(7):72-78.
|
| [12] |
冯雨雪, 李广东. 青藏高原城镇化与生态环境交互影响关系分析[J]. 地理学报, 2020, 75(7):1386-1405.
|
| [13] |
王少剑, 崔子恬, 林靖杰, 等. 珠三角地区城镇化与生态韧性的耦合协调研究[J]. 地理学报, 2021, 76(4):973-991.
|
| [14] |
|
| [15] |
汪德根, 陈田, 王昊. 旅游业提升开发区城市化质量的路径及机理分析——以苏州工业园区为例[J]. 人文地理, 2011, 26(1):123-128.
|
| [16] |
王琴梅, 方妮. 乡村生态旅游促进新型城镇化的实证分析——以西安市长安区为例[J]. 旅游学刊, 2017, 32(1):77-88.
|
| [17] |
杨亚丽, 孙根年. 城市化推动我国国内旅游发展的时空动态分析[J]. 经济地理, 2013, 33(7):169-175.
|
| [18] |
|
| [19] |
王坤, 黄震方, 余凤龙, 等. 中国城镇化对旅游经济影响的空间效应——基于空间面板计量模型的研究[J]. 旅游学刊, 2016, 31(5):15-25.
|
| [20] |
|
| [21] |
|
| [22] |
高楠, 马耀峰, 李天顺, 等. 基于耦合模型的旅游产业与城市化协调发展研究——以西安市为例[J]. 旅游学刊, 2013, 28(1):62-68.
|
| [23] |
王兆峰, 余含. 张家界旅游产业发展与小城镇建设耦合发展研究[J]. 经济地理, 2012, 32(7):165-171.
|
| [24] |
杨友宝, 王荣成, 曹洪华. 东北老工业城市旅游业与城市化耦合演变关系研究[J]. 人文地理, 2016, 31(1):140-146.
|
| [25] |
赵磊, 潘婷婷, 方成, 等. 旅游业与新型城镇化——基于系统耦合协调视角[J]. 旅游学刊, 2020, 35(1):14-31.
|
| [26] |
钟家雨, 柳思维, 熊曦. 旅游业与城镇化协同发展的区域差异分析[J]. 经济地理, 2014, 34(2):187-192.
|
| [27] |
高楠, 王琳艳, 马耀峰, 等. 旅游业驱动下世界文化遗产依附地城镇化响应机制——以平遥古城为例[J]. 经济地理, 2017, 37(4):198-207.
|
| [28] |
赵书虹, 陈婷婷. 云南省旅游驱动型城市旅游产业与城镇化耦合协调驱动因素分析[J]. 旅游科学, 2020,3403):78-93.
|
| [29] |
胡振鹏, 黄晓杏, 傅春, 等. 环鄱阳湖地区旅游产业—城镇化—生态环境交互耦合的定量比较及演化分析[J]. 长江流域资源与环境, 2015, 24(12):2012-2020.
|
| [30] |
邓椿. 山西省旅游产业—城镇化—生态环境耦合协调发展分析[J]. 地域研究与开发, 2018, 37(3):85-89.
|
| [31] |
熊建新, 王文辉, 贺赛花, 等. 洞庭湖区旅游城镇化的时空分异及演化[J]. 经济地理, 2020, 40(5):210-219.
|
| [32] |
|
| [33] |
|
| [34] |
郝辑, 张少杰. 基于熵值法的我国省际生态数据评价研究[J]. 情报科学, 2021, 39(1):157-162.
|
| [35] |
翁钢民, 李凌雁. 中国旅游与文化产业融合发展的耦合协调度及空间相关分析[J]. 经济地理, 2016, 36(1):178-185.
|
| [36] |
翁钢民, 潘越, 杨秀平, 等. 协同视角下旅游产业与科技创新、现代金融发展格局的时空动态关系[J]. 经济地理, 2020, 40(1):214-225.
|
| [37] |
师博, 何璐, 张文明. 黄河流域城市经济高质量发展的动态演进及趋势预测[J]. 经济问题, 2021(1):1-8.
|
| [38] |
李江苏, 孙威, 余建辉. 黄河流域三生空间的演变与区域差异——基于资源型与非资源型城市的对比[J]. 资源科学, 2020, 42(12):2285-2299.
|
| [39] |
陈立梅, 刘冬辉. 江苏省农村信息消费差异的动态变化及空间分解——基于泰尔指数的实证分析[J]. 华东经济管理, 2016, 30(2):21-26.
|
/
| 〈 |
|
〉 |