
Structure and Driving Factors of Spatial Association Network of the New Quality Productive Forces in the Pearl River Delta Region
Received date: 2024-08-10
Revised date: 2024-12-03
Online published: 2025-01-21
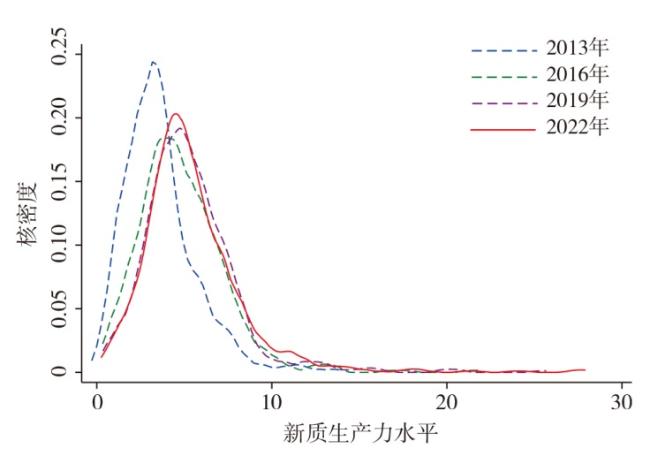
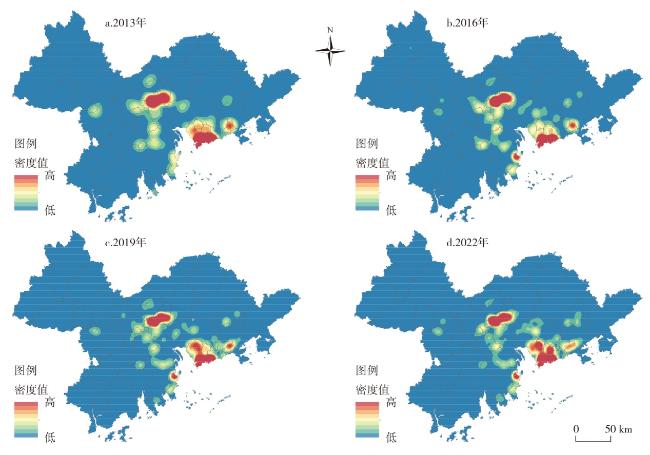
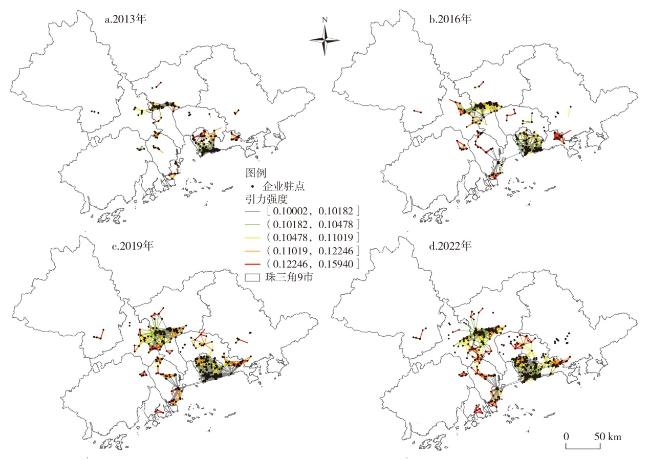
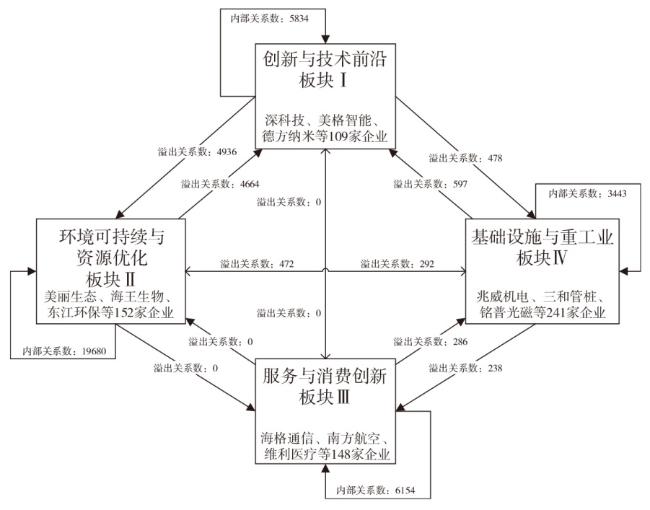
Delving into the spatial correlation network structure and driving factors of enterprises' new-quality productive forces is helpful to cultivate and strengthen new drivers of economic development. This paper takes A-share listed companies in the Pearl River Delta (PRD) region as samples, utilizes the entropy method to calculate the index of enterprises' new-quality productive forces, and conducts quantitative analysis on the spatial correlation network structure and driving mechanisms of enterprises' new-quality productive forces based on the social network analysis, the density-based spatial clustering of applications with noise (DBSCAN), and the QAP non-parametric estimation method. The results indicate that: 1) The new-quality productive forces of enterprises in the PRD region exhibits a dual-core spatial clustering and multi-tier grading characteristic. The first-tier high-density areas are distributed in Guangzhou and Shenzhen, the second-tier sub-high-density areas are concentrated in Zhuhai, the third-tier medium-density core areas are centered around the Guangzhou-Zhuhai line and the surrounding areas of Shenzhen, and the fourth-tier low-density core areas are mainly distributed in the inland hinterland of the PRD region. 2) The spatial correlation network structure of enterprises' new-quality productive forces demonstrates the spatial characteristics of small-world, network densification, long-tail distribution, and an "axis-hub" pattern. The network density and network efficiency exhibit an N-shaped trend (rising first, then falling, and finally rising again), with the overall network connectivity being relatively high. 3) The spatial correlation network structure of enterprises' new-quality productive forces has obvious regional characteristics, the number of network nodes has steadily increased and formed a "2+N" community structure through cooperation, namely two main communities centered on Guangzhou and Shenzhen, and N sub-communities centered on Zhuhai, Zhongshan, Dongguan, Huizhou, which are distributed in an n-shaped pattern around the Pearl River estuary. 4) Based on the nature of the spatial correlation network of new-quality productive forces, the sample enterprises can be divided into four plates. Plate I exhibits non-reflexive structural characteristics and the role of a "net spillover" plate. Plate II has reflexive structural characteristics and the role of a "primary beneficiary" plate. Plate III and plate IV both demonstrate reflexive structural characteristics and the role of "bidirectional spillover" plates. 5) Enterprise size, digital transformation, innovation capability, and ESG performance are key driving factors that facilitate the formation of the spatial correlation network of enterprises' new-quality productive forces.
WU Weiping , SU Leyan , YANG Yuxuan , WU Kexing . Structure and Driving Factors of Spatial Association Network of the New Quality Productive Forces in the Pearl River Delta Region[J]. Economic geography, 2024 , 44(12) : 141 -152 . DOI: 10.15957/j.cnki.jjdl.2024.12.015
表1 整体网络与个体网络特征的度量指标及公式Tab.1 Measurement index and formula of the characteristics of the whole network and the individual network |
| 指标 | 计算公式 | 说明 | |
|---|---|---|---|
| 整体网络特征 | 网络密度 | 空间网络中有N个节点,最大的可能关系数为个,实际关系数为M个 | |
| 网络效率 | R为多余线的条数,为最大可能的多余线条数 | ||
| 网络关联度 | V为网络中不可达的点对数目 | ||
| 个体网络特征 | 度数中心度 | 若城市i与j之间存在空间关联,则记,反之为0 | |
| 接近中心度 | 为两节点城市间最短路径距离 | ||
| 中介中心度 | 为城市j与k之间经过城市i的最短路径数,为城市j与k间最短路径数 | ||
表2 企业新质生产力空间关联的网络密度、网络效率和网络关联度Tab.2 Network density,network efficiency and network association degree of the spatial association network for enterprises' new quality productive forces |
| 年份 | 2013 | 2014 | 2015 | 2016 | 2017 | 2018 | 2019 | 2020 | 2021 | 2022 |
|---|---|---|---|---|---|---|---|---|---|---|
| 网络密度 | 0.4029 | 0.4823 | 0.3505 | 0.3338 | 0.3859 | 0.4086 | 0.3836 | 0.4171 | 0.4815 | 0.5368 |
| 网络效率 | 0.4828 | 0.7225 | 0.5150 | 0.5372 | 0.5864 | 0.6160 | 0.5791 | 0.6086 | 0.7065 | 0.7714 |
| 网络关联度 | 0.8739 | 0.9722 | 0.8767 | 0.8860 | 0.8975 | 0.9203 | 0.9183 | 0.9270 | 0.9606 | 0.9903 |
表3 珠三角地区企业新质生产力个体网络特征Tab.3 Individual network characteristics of new quality productive forces of enterprises in the Pearl River Delta region |
| 2013 | 2014 | 2015 | 2016 | 2017 | 2018 | 2019 | 2020 | 2021 | 2022 | ||
|---|---|---|---|---|---|---|---|---|---|---|---|
| 度数中心度 | 珠三角 | 0.57070 | 0.10840 | 0.11270 | 0.59090 | 0.14940 | 0.58820 | 0.98630 | 0.5943 | 0.6135 | 0.6520 |
| 广州 | 0.02100 | 1.00000 | 0.04650 | 1.00000 | 1.00000 | 1.00000 | 0.06890 | 1.00000 | 1.00000 | 1.00000 | |
| 佛山 | 0.02180 | 1.00000 | 1.00000 | 0.04690 | 1.00000 | 1.00000 | 0.51790 | 0.57770 | 1.00000 | 1.00000 | |
| 肇庆 | 0 | 1.00000 | 0.00980 | 0.02360 | 0.04080 | 0.01920 | 0.12820 | 0.01590 | 0.04470 | 1.00000 | |
| 深圳 | 0.03970 | 0.03010 | 0.05710 | 1.00000 | 1.00000 | 1.00000 | 1.00000 | 1.00000 | 1.00000 | 1.00000 | |
| 东莞 | 0.01410 | 1.00000 | 0.02330 | 1.00000 | 1.00000 | 0.66080 | 0.57420 | 0.61730 | 1.00000 | 1.00000 | |
| 惠州 | 0 | 1.00000 | 0.00970 | 0.02360 | 0.03820 | 0.04090 | 0.02330 | 0.04780 | 1.00000 | 1.00000 | |
| 珠海 | 0.08390 | 1.00000 | 0.10540 | 0.29100 | 0.31570 | 1.00000 | 0.48140 | 1.00000 | 0.40540 | 1.00000 | |
| 中山 | 0.13070 | 1.00000 | 1.00000 | 1.00000 | 1.00000 | 0.24120 | 1.00000 | 0.06720 | 1.00000 | 0.13790 | |
| 江门 | 0 | 1.00000 | 0.00980 | 0.02370 | 0.03570 | 0.15170 | 0.10920 | 0.11490 | 0.13060 | 1.00000 | |
| 中介中心度 | 珠三角 | 0.00440 | 0.00290 | 0.00950 | 0.13440 | 0.03990 | 0.02740 | 0.17040 | 0.61410 | 0.11370 | 0.55060 |
| 广州 | 0.00190 | 0.07590 | 0.00040 | 0.27380 | 0.05080 | 0.15550 | 0.00090 | 0.31760 | 0.07130 | 0.19090 | |
| 佛山 | 0 | 0.16370 | 0.50750 | 0.00002 | 0.05460 | 0.17110 | 0.00060 | 0.00060 | 0.07810 | 0.03280 | |
| 肇庆 | 0 | 0.08350 | 0.00001 | 0 | 0.00001 | 0.00001 | 0.00010 | 0.00001 | 1.07580 | 0.01130 | |
| 深圳 | 0.00670 | 0.10190 | 0.01140 | 0.33410 | 0.39740 | 0.20240 | 0.39950 | 0.30320 | 0.37240 | 0.30850 | |
| 东莞 | 0 | 0.08270 | 0.00001 | 0.09630 | 0.22050 | 0.00090 | 0.00030 | 0.00040 | 0.13110 | 0.03320 | |
| 惠州 | 0 | 0.00001 | 0.00001 | 0 | 0.00001 | 0.00001 | 0.00001 | 0 | 0.05300 | 0.03370 | |
| 珠海 | 0.00200 | 0.08160 | 0.00040 | 0.00040 | 0.00040 | 0.17170 | 0.00050 | 0.08710 | 0.00030 | 0.05590 | |
| 中山 | 0.00230 | 0.08290 | 0.25660 | 0.09700 | 0.10920 | 0.00050 | 0.34420 | 0.00006 | 0.02610 | 0.00001 | |
| 江门 | 0 | 0.08350 | 0.00001 | 0.00001 | 0.00001 | 0.00040 | 0.00007 | 0.00005 | 0.00001 | 0.01130 | |
| 接近中心度 | 珠三角 | 3.10620 | 5.68560 | 0.88850 | 0.49680 | 0.91000 | 3.25590 | 0.76700 | 0.28790 | 0.31470 | 1.56390 |
| 广州 | 0.00001 | 1.00000 | 0.51190 | 1.00000 | 1.00000 | 1.00000 | 0.51850 | 1.00000 | 1.00000 | 1.00000 | |
| 佛山 | 1.80920 | 1.00000 | 1.00000 | 0.51120 | 1.00000 | 1.00000 | 0.67370 | 0.69090 | 1.00000 | 1.00000 | |
| 肇庆 | 0 | 1.00000 | 0.50250 | 0.50590 | 0.51110 | 0.50650 | 0.53540 | 0.50400 | 0.51140 | 1.00000 | |
| 深圳 | 0.72410 | 1.00000 | 0.51470 | 1.00000 | 1.00000 | 1.00000 | 1.00000 | 1.00000 | 1.00000 | 1.00000 | |
| 东莞 | 0.53190 | 1.00000 | 0.50590 | 1.00000 | 1.00000 | 0.72860 | 0.70680 | 0.72540 | 1.00000 | 1.00000 | |
| 惠州 | 0 | 0.50760 | 0.50240 | 0.50590 | 0.50980 | 0.50990 | 0.50810 | 0.51280 | 1.00000 | 1.00000 | |
| 珠海 | 1.00000 | 1.00000 | 0.52500 | 0.58620 | 0.60420 | 1.00000 | 0.66620 | 1.00000 | 0.66830 | 1.00000 | |
| 中山 | 1.00000 | 1.00000 | 1.00000 | 1.00000 | 1.00000 | 0.56090 | 1.00000 | 0.51790 | 1.00000 | 0.53930 | |
| 江门 | 0 | 1.00000 | 1.00000 | 0.50600 | 0.50910 | 0.53430 | 0.52830 | 0.53160 | 0.53890 | 1.00000 | |
表4 各板块的内部关联与外部溢出关系Tab.4 Internal association and external spillover relationships of each plate |
| 板块 | 接受关系数(条) | 企业数 (个) | 接收板块外关系数 (条) | 溢出板块外关系数 (条) | 总体关联 结构特征 | 板块角色 特征 | |||
|---|---|---|---|---|---|---|---|---|---|
| 板块Ⅰ | 板块Ⅱ | 板块Ⅲ | 板块Ⅳ | ||||||
| 板块Ⅰ | 5834 | 4936 | 0 | 478 | 109 | 5261 | 5414 | 非自反性 | 净溢出 |
| 板块Ⅱ | 4664 | 19680 | 0 | 292 | 152 | 5408 | 4956 | 自反性 | 主受益 |
| 板块Ⅲ | 0 | 0 | 6154 | 286 | 148 | 238 | 286 | 自反性 | 双向溢出 |
| 板块Ⅳ | 597 | 472 | 238 | 3443 | 241 | 1056 | 1307 | 自反性 | 双向溢出 |
表5 空间关联板块的密度矩阵和像矩阵Tab.5 Density matrix and image matrix of spatial association plates |
| 板块 | 密度矩阵 | 像矩阵 | |||||||
|---|---|---|---|---|---|---|---|---|---|
| 板块Ⅰ | 板块Ⅱ | 板块Ⅲ | 板块Ⅳ | 板块Ⅰ | 板块Ⅱ | 板块Ⅲ | 板块Ⅳ | ||
| 板块Ⅰ | 0.4956 | 0.0727 | 0 | 0.0039 | 1 | 0 | 0 | 0 | |
| 板块Ⅱ | 0.0687 | 0.8574 | 0 | 0.0019 | 0 | 1 | 0 | 0 | |
| 板块Ⅲ | 0 | 0 | 0.2828 | 0.0019 | 0 | 0 | 1 | 0 | |
| 板块Ⅳ | 0.0049 | 0.0031 | 0.0016 | 0.0595 | 0 | 0 | 0 | 0 | |
表7 企业新质生产力空间关联网络影响因素的QAP回归结果Tab.7 QAP regression results of factors influencing the spatial association network of enterprises' new quality productive forces |
| 年份 | 2013 | 2016 | 2019 | 2022 |
|---|---|---|---|---|
| Scale | 0.0000 (1.0000) | 0.0018 (0.1930) | 0.0001* (0.0640) | 0.0004*** (0.0000) |
| Digitization | 0.0000 (1.0000) | 0.0016* (0.0801) | 0.0020* (0.0891) | 0.0031*** (0.0000) |
| Innovation | 0.0000 (1.0000) | 0.0016** (0.0162) | 0.0001 (0.4102) | 0.0001*** (0.0000) |
| ESG | 0.0000 (1.0000) | 0.0013 (0.1110) | 0.0001** (0.0420) | 0.0009 (0.1274) |
| Revenue | 1.0004 (0.5041) | 0.0028 (0.1102) | 0.0001 (0.1152) | 0.0008 (0.1691) |
| 观察值 | 85556 | 112560 | 228962 | 361802 |
| 随机置换次数 | 6000 | 6000 | 6000 | 6000 |
注:*、**、***分别表示10%、5%、1%显著水平;括号内数值表示显著性水平。 |
| [1] |
习近平. 牢牢把握东北的重要使命奋力谱写东北全面振兴新篇章[N]. 人民日报,2023-09-10(1).
|
| [2] |
习近平经济思想研究中心. 新质生产力的内涵特征和发展重点[N]. 人民日报,2024-03-01(9).
|
| [3] |
苏丹妮, 盛斌, 邵朝对, 等. 全球价值链、本地化产业集聚与企业生产率的互动效应[J]. 经济研究, 2020, 55(3): 100-115.
|
| [4] |
栗向阳, 王磊, 张宇欣. 长江经济带新质生产力发展的时空演化格局及其影响因素[J]. 长江流域资源与环境, 2024, 33(5):909-923.
|
| [5] |
韩文龙, 张瑞生, 赵峰. 新质生产力水平测算与中国经济增长新动能[J]. 数量经济技术经济研究, 2024, 41(6):5-25.
|
| [6] |
宋佳, 张金昌, 潘艺. ESG发展对企业新质生产力影响的研究——来自中国A股上市企业的经验证据[J]. 当代经济管理, 2024, 46(6):1-11.
|
| [7] |
刘志彪, 凌永辉, 孙瑞东. 新质生产力下产业发展方向与战略——以江苏为例[J]. 南京社会科学, 2023(11):59-66.
|
| [8] |
武文杰, 董正斌, 张文忠, 等. 中国城市空间关联网络结构的时空演变[J]. 地理学报, 2011, 66(4):435-445.
|
| [9] |
赵新正, 李秋平, 芮旸, 等. 基于财富500强中国企业网络的城市网络空间联系特征[J]. 地理学报, 2019, 74(4):694-709.
|
| [10] |
冯颖, 侯孟阳, 姚顺波. 中国粮食生产空间关联网络的结构特征及其形成机制[J]. 地理学报, 2020, 75(11):2380-2395.
|
| [11] |
张明斗, 李学思. 黄河流域市域大气污染治理效率的空间关联网络及其驱动因素[J]. 经济地理, 2023, 43(8):62-72.
|
| [12] |
|
| [13] |
吴康, 方创琳, 赵渺希. 中国城市网络的空间组织及其复杂性结构特征[J]. 地理研究, 2015, 34(4):711-728.
|
| [14] |
|
| [15] |
陈明星, 陆大道, 张华. 中国城市化水平的综合测度及其动力因子分析[J]. 地理学报, 2009, 64(4):387-398.
|
| [16] |
高帆. “新质生产力”的提出逻辑、多维内涵及时代意义[J]. 政治经济学评论, 2023, 14(6):127-145.
|
| [17] |
吴伟平, 王振军. 劳动力配置效率的城市层级特征及空间收敛演进[J]. 经济地理, 2023, 43(1):72-83.
|
| [18] |
李政, 廖晓东. 发展“新质生产力”的理论、历史和现实“三重”逻辑[J]. 政治经济学评论, 2023, 14(6):146-159.
|
| [19] |
洪银兴. 新质生产力及其培育和发展[J]. 经济学动态, 2024(1):3-11.
|
| [20] |
钟业喜, 冯兴华, 文玉钊. 长江经济带经济网络结构演变及其驱动机制研究[J]. 地理科学, 2016, 36(1): 10-19.
|
| [21] |
易靖韬, 蒙双, 蔡菲莹. 外部R&D、技术距离、市场距离与企业创新绩效[J]. 中国软科学, 2017(4):141-151.
|
| [22] |
李敬, 陈澍, 万广华, 等. 中国区域经济增长的空间关联及其解释——基于网络分析方法[J]. 经济研究, 2014, 49(11):4-16.
|
| [23] |
陈子归, 苏乐言, 吴客形, 等. 珠三角地区家具产业链空间聚类识别及空间熵分解[J]. 经济地理, 2024, 44(4):131-141.
|
| [24] |
|
| [25] |
|
| [26] |
李松霞, 吴福象. 我国新质生产力发展潜力及驱动因素[J]. 技术经济与管理研究, 2024(3):7-12.
|
/
| 〈 |
|
〉 |
