
Evolutionary Characteristics of Agglomeration of New High-tech Enterprises in China
Received date: 2023-09-13
Revised date: 2024-02-10
Online published: 2025-01-21
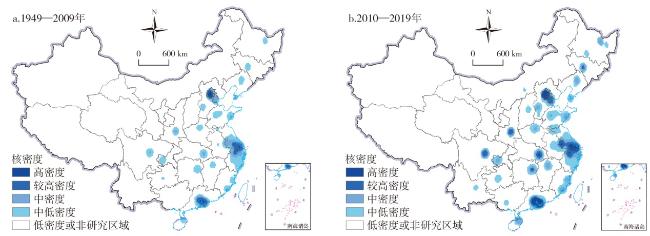
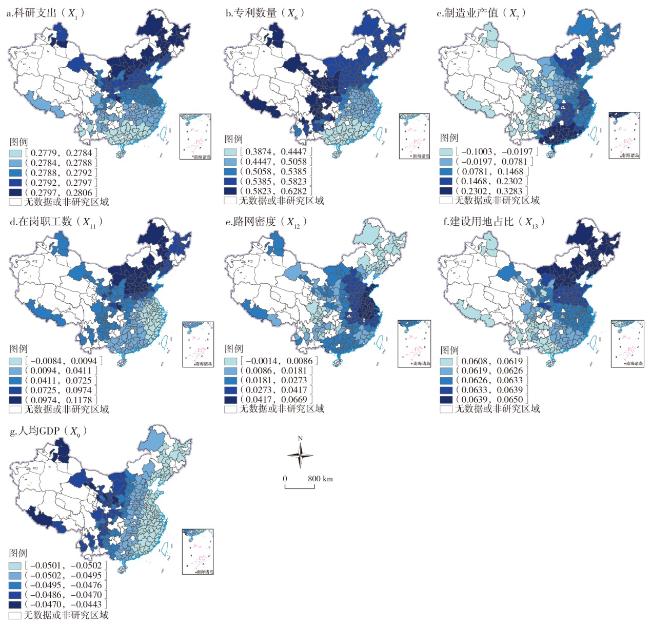
This paper selects 218300 new high-tech enterprises in China from 2010 to 2019 as samples, uses kernel density and other methods to describe their spatiotemporal evolution characteristics, and uses the MGWR model to explore the influencing factors of new high-tech agglomeration. The results show that: 1) From 2010 to 2019, the overall distribution of new high-tech enterprises in China showed the characteristics of "dense in the east of China and sparse in the west of China, more in the south of China and less in the north of China", and gradually spread to the central and western regions, and their agglomeration centers changed from "three cores" to "three poles and multiple cores". 2) The new high-tech enterprises mainly come from the four major industries, and the agglomeration characteristics of the industries are obviously different, and the regional imbalance generally shows a trend of first increasing and then decreasing, but there are stages of agglomeration between industries. 3) The number of authorized invention patents, scientific research expenditure in the general budget of local finance, the number of on-the-job employees, the output value of the manufacturing sector, the proportion of construction land, the density of the road network in the built-up area, and the per capita GDP jointly act on the agglomeration of high-tech enterprises, and the impact intensity decreases in turn. Among them, the spatial scale of innovative technology output and infrastructure construction, represented by the number of authorized invention patents and the density of the road network in built-up areas, is small and has strong spatial heterogeneity. Finally, some policy suggestions are put forward based on the research conclusions.
LIU Qin , CHEN Gang , WANG Guanghui , LIU Chenghao . Evolutionary Characteristics of Agglomeration of New High-tech Enterprises in China[J]. Economic geography, 2024 , 44(12) : 132 -140 . DOI: 10.15957/j.cnki.jjdl.2024.12.014
表1 变量选择Tab.1 Variable selection |
| 影响因子主类 | 影响因子亚类 | 影响因子 | 变量代码 | 计算方法 |
|---|---|---|---|---|
| 政策环境响应 | 创新环境 | 创新经费投入 | X1 | 地方财政一般预算内科学研究支出(万元) |
| 开发区政策 | X2 | 省级以上开发区数(个) | ||
| 公共服务 | 社会保障度 | X3 | 每万人床位数量(张/每万人) | |
| 环境保障度 | X4 | 建成区绿化覆盖率(%) | ||
| 行业内在属性 | 劳动力蓄水池 | 人才供给能力 | X5 | 普通高校在校大学生数(人) |
| 中间品投入 | 创新技术产出 | X6 | 发明专利授权数(件) | |
| 地方化经济 | 行业规模与性质 | X7 | 制造业部门产值(万元) | |
| 行业间特征 | 产业多样化 | 产业结构高级化 | X8 | 二三产值/GDP(%) |
| 市场规模 | 生产能力 | X9 | 人均GDP(元/人) | |
| 消费能力 | X10 | 在岗职工平均收入(元) | ||
| 城市化经济 | 城市规模与性质 | X11 | 在岗职工数量(万人) | |
| 城市禀赋特征 | 城市发展特征 | 基础设施建设 | X12 | 建成区路网密度(km/km2) |
| 区位发展优势 | X13 | 建设用地占比(%) | ||
| 自然区位条件 | 海拔高度 | X14 | 海拔高度(m) | |
| 地形坡度 | X15 | 地形坡度(°) |
表2 新增高新技术企业所属行业门类统计Tab.2 Statistics of industry categories of new high-tech enterprises |
| 序号 | 行业门类 | 新增企业数量 (个) | 占比 (%) |
|---|---|---|---|
| 1 | 科学研究和技术服务业(m) | 71074 | 32.66 |
| 2 | 制造业(c) | 63583 | 29.24 |
| 3 | 信息传输、软件和信息技术服务业(i) | 38103 | 17.51 |
| 4 | 批发和零售业(f) | 22181 | 10.33 |
| 5 | 租赁和商务服务业(l) | 6173 | 2.82 |
| 6 | 建筑业(e) | 3729 | 1.71 |
| 7 | 农、林、牧、渔业(a) | 2177 | 1.00 |
| 8 | 交通运输,仓储和邮政业(g) | 1190 | 0.54 |
| 9 | 金融(j) | 246 | 0.11 |
| 10 | 其他行业 | 8906 | 4.08 |
注:1.按照GB /T4754-2017国民经济行业分类代码进行分类。2.按照全国高新技术企业认定数据库(2022年)进行认定。 |
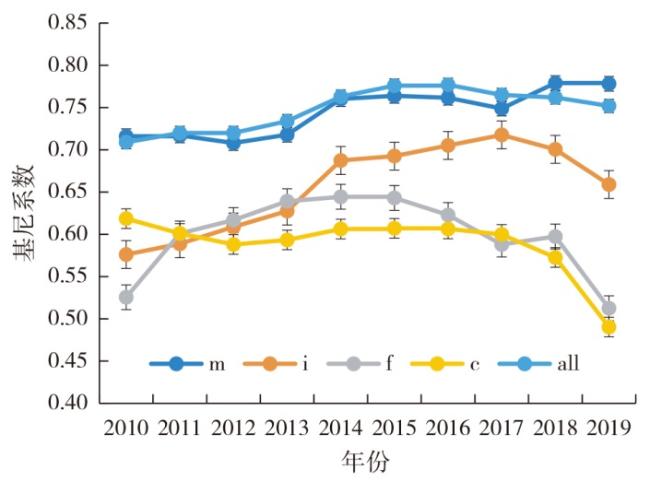
图3 新增高新技术企业集聚的不均衡指数注:制造业(c):包括专用设备制造业、通用设备制造业、金属制品业、纺织业;批发及零售业(f):包括批发业、零售业;信息传输、软件和信息技术服务业(i):包括电信、广播电视和卫星传输服务、互联网和相关服务、软件和信息技术服务业;科学研究和技术服务业(m):包括研究和试验发展、专业技术服务业,科技推广和应用服务业;其他行业(other):其他所有不在上述4类中高新技术企业。all:代指整体高新技术企业。 Fig.3 Disequilibrium index of the agglomeration of new high-tech enterprises |
表3 MGWR模型回归结果Tab.3 Regression results of MGWR model |
| 变量 | β | P值(MC) | 带宽 | 带宽置信度(95%) |
|---|---|---|---|---|
| X1 | 0.279*** | 0.000 | 271 | 1.975 |
| X2 | -0.023 | 0.229 | 123 | 2.350 |
| X3 | 0.020 | 0.139 | 254 | 2.165 |
| X4 | -0.020 | 0.250 | 271 | 2.120 |
| X5 | -0.018 | 0.246 | 43 | 2.860 |
| X6 | 0.519*** | 0.000 | 96 | 2.448 |
| X7 | 0.109* | 0.098 | 43 | 2.860 |
| X8 | -0.012 | 0.337 | 206 | 2.396 |
| X9 | -0.038* | 0.058 | 271 | 2.048 |
| X10 | 0.000 | 0.984 | 271 | 2.028 |
| X11 | 0.113** | 0.018 | 123 | 2.258 |
| X12 | 0.024** | 0.032 | 100 | 2.705 |
| X13 | 0.063** | 0.033 | 271 | 1.990 |
| X14 | 0.004 | 0.696 | 271 | 2.033 |
| X15 | -0.018 | 0.429 | 271 | 2.037 |
注:***、**、*分别通过1%、5%、10%显著性检验,模型对因变量和自变量均进行了标准化,不同变量间系数大小可以进行比较。 |
| [1] |
习近平. 在全国科技大会、国家科学技术奖励大会、两院院士大会上的讲话[J]. 中华人民共和国国务院公报, 2024(20):6-9.
|
| [2] |
高培勇, 隆国强, 刘尚希, 等. 扎实推动高质量发展,加快中国式现代化建设——学习贯彻中央经济工作会议精神笔谈[J]. 经济研究, 2024, 59(1):4-35.
|
| [3] |
肖凡, 任建造, 伍敏冬, 等. 21世纪以来中国高新技术企业的时空分布和影响机制[J]. 经济地理, 2018, 38(2):27-35.
|
| [4] |
周媛媛, 董平, 陆玉麒, 等. 基于上市高新技术企业的中国城市创新网络及其影响因素[J]. 经济地理, 2023, 43(6):145-155.
|
| [5] |
肖凡, 王姣娥, 黄宇金, 等. 中国高新技术企业分布影响因素的空间异质性与尺度效应[J]. 地理研究, 2022, 41(5):1338-1351.
|
| [6] |
|
| [7] |
唐永伟, 唐将伟, 熊建华. 城市创新空间发展的时空演进特征与内生逻辑——基于武汉市2827家高新技术企业数据的分析[J]. 经济地理, 2021, 41(11):58-65.
|
| [8] |
|
| [9] |
符文颖, 董诗涵. 技术型新创企业的地理学研究进展[J]. 地理科学, 2019, 39(9):1398-1406.
|
| [10] |
马淑燕, 赵祚翔, 王桂玲. 中国国家高新技术产业开发区时空格局特征及影响因素[J]. 经济地理, 2022, 42(8):95-102,239.
|
| [11] |
王振坡, 段思洁, 宋顺锋. 我国高新技术企业选址的影响因素研究——基于35个大中城市的实证分析[J]. 城市发展研究, 2020, 27(9):122-131.
|
| [12] |
|
| [13] |
|
| [14] |
周灿, 曾刚, 曹贤忠. 中国城市创新网络结构与创新能力研究[J]. 地理研究, 2017, 36(7):1297-1308.
|
| [15] |
|
| [16] |
许吉黎, 黄耿志, 张虹鸥, 等. 可持续性转型视角下区域新兴产业形成的研究进展与展望[J]. 经济地理, 2022, 42(12):142-151.
|
| [17] |
刘骁啸, 吴康. 功能疏解背景下京津冀中部核心区产业投资网络演化研究[J]. 地理科学进展, 2020, 39(12):1972-1984.
|
| [18] |
郭峰, 曹友斌, 熊云军, 等. 国家级新区设立与企业空间布局:基于镇级面板数据的分析[J]. 经济研究, 2023, 58(8):191-208.
|
| [19] |
盛科荣, 杨雨, 孙威. 中国城市网络中心性的影响因素及形成机理:基于上市公司500强企业网络视角[J]. 地理科学进展, 2019, 38(2):248-258.
|
| [20] |
吴康, 方创琳, 赵渺希. 中国城市网络的空间组织及其复杂性结构特征[J]. 地理研究, 2015, 34(4):711-728.
|
| [21] |
张永凯, 徐伟. 演化经济地理学视角下的产业空间演化及其影响因素分析——以中国汽车工业为例[J]. 世界地理研究, 2014, 23(2):1-13,25.
|
| [22] |
|
| [23] |
|
| [24] |
金海燕, 刘宵, 李佩. 中国城市人才聚集的时空演化特征及影响因素研究[J]. 世界地理研究, 2024, 33(8):117-131.
|
| [25] |
丁建军, 刘贤, 王淀坤, 等. 国家级专精特新“小巨人”企业空间分布及其影响因素[J]. 经济地理, 2022, 42(10):109-118.
|
| [26] |
曹清峰. 国家级新区对区域经济增长的带动效应——基于70大中城市的经验证据[J]. 中国工业经济, 2020(7):43-60.
|
| [27] |
|
| [28] |
张莉, 朱光顺, 李世刚, 等. 市场环境、重点产业政策与企业生产率差异[J]. 管理世界, 2019, 35(3):114-126.
|
| [29] |
郭丽燕, 黄建忠, 庄惠明. 人力资本流动、高新技术产业集聚与经济增长[J]. 南开经济研究, 2020(6):163-180.
|
| [30] |
丛海彬, 段巍, 吴福象. 新型城镇化中的产城融合及其福利效应[J]. 中国工业经济, 2017(11):62-80.
|
| [31] |
耿纯, 赵艳朋. 交通基础设施对新建制造业企业选址的异质影响研究[J]. 经济学动态, 2018(8):90-105.
|
| [32] |
张杰, 唐根年. 浙江省制造业企业时空迁移特征及驱动机理——基于县域尺度[J]. 经济地理, 2019, 39(6):118-126.
|
| [33] |
古恒宇, 孟鑫, 沈体雁, 等. 中国城市流动人口居留意愿影响因素的空间分异特征[J]. 地理学报, 2020, 75(2):240-254.
|
/
| 〈 |
|
〉 |