
Spatiotemporal Heterogeneity and Evolutionary Mechanism of the Distribution of China's Convention and Exhibition Venues in the Past 10 Years
Received date: 2022-11-24
Revised date: 2024-05-10
Online published: 2025-01-21
As an important support of convention and exhibition activities, convention and exhibition venues play an important role in promoting the operation of convention and exhibition projects and the development of convention and exhibition economy. Taking 31 provincial-level regions in China as the research unit and exhibition venues with a scale of more than 20000 m2 as the research object, this paper analyzes the spatio-temporal heterogeneity and evolution mechanism of the distribution of convention and exhibition venues in China by using the methods of Kernel density analysis, nearest neighbor index, spatial autocorrelation and Geodetector. The results show that: 1) At the national scale, convention and exhibition venues are generally in a bow-shaped spatial distribution pattern which is made up of three cores and seven hot spots, and the gravity center continues to move from the northwest of China to the southeast of China. 2) At the provincial scale, the spatial distribution pattern is obviously different between the east of China and the west of China, which is consistent with the level of economic development, and shows a horizontal gradient evolution. The distribution of convention and exhibition venues in the province is mostly concentrated, but tends to be dispersed. 3) The spatiotemporal heterogeneity of the distribution of convention and exhibition venues in China is affected by economy, society, industry endogenous and traffic environment, and the influence degree is increasing. The interaction of any two factors is higher than the force of a single factor.
WEI Tongfeng , SUN Haiyan , QIN Weishan , ZHAO Yumei . Spatiotemporal Heterogeneity and Evolutionary Mechanism of the Distribution of China's Convention and Exhibition Venues in the Past 10 Years[J]. Economic geography, 2024 , 44(12) : 82 -90 . DOI: 10.15957/j.cnki.jjdl.2024.12.009
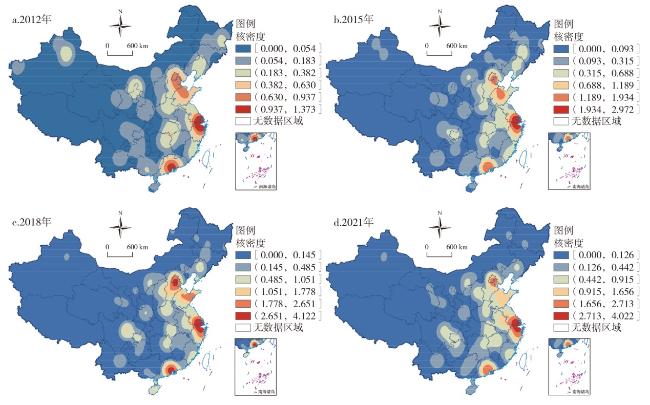
表1 全国会展场馆重心和标准差椭圆参数Tab.1 Gravity center and standard deviation ellipse parameters of convention and exhibition venues in China |
| 年份 | 重心坐标 | 移动方向 | 面积 (km2) | 周长 (km) | 方位角 (°) |
|---|---|---|---|---|---|
| 2012 | 115°01′E,33°24′N | 东偏南 | 374.08 | 69.60 | 93.12 |
| 2015 | 116°14′E,33°02′N | 南偏西 | 247.96 | 56.14 | 44.09 |
| 2018 | 116°10′E,32°51′N | 南偏西 | 209.64 | 52.17 | 30.04 |
| 2021 | 115°47′E,32°09′N | 198.22 | 50.19 | 37.05 |
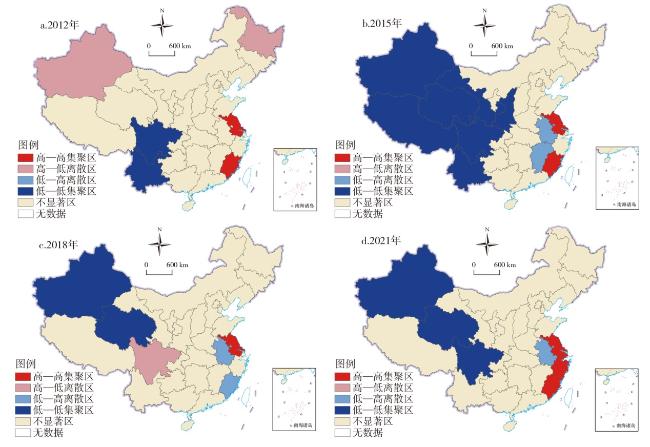
表2 不同年份全国会展场馆的各省最邻近点指数Tab.2 Nearest neighbor index of convention and exhibition venues in different provinces of China in 2012,2015,2018 and 2021 |
| 省份 | 2012 | 2015 | 2018 | 2021 | |||||||
|---|---|---|---|---|---|---|---|---|---|---|---|
| NNI | SST | NNI | SST | NNI | SST | NNI | SST | ||||
| 安徽 | - | - | 0.776052 | 集聚 | 1.129795 | 随机 | 0.742686 | 集聚 | |||
| 北京 | 0.194065 | 集聚 | 0.194065 | 集聚 | 0.354596 | 集聚 | 0.390591 | 集聚 | |||
| 福建 | 0.725311 | 集聚 | 0.636284 | 集聚 | 1.139182 | 随机 | 2.2923 | 随机 | |||
| 甘肃 | - | - | - | - | - | - | 1.801673 | 随机 | |||
| 广东 | 0.939427 | 集聚 | 3.059875 | 随机 | 2.511926 | 随机 | 0.817214 | 集聚 | |||
| 广西 | 0.075283 | 集聚 | 1.140644 | 随机 | - | - | 1.140644 | 随机 | |||
| 贵州 | - | - | - | - | 1.541101 | 随机 | 0.900750 | 集聚 | |||
| 海南 | - | - | - | - | 0.918842 | 集聚 | 1.371618 | 随机 | |||
| 河北 | 1.274597 | 随机 | 0.982376 | 集聚 | 0.730122 | 集聚 | 0.764663 | 集聚 | |||
| 河南 | 0.030784 | 集聚 | 0.346101 | 集聚 | 0.515545 | 集聚 | 0.283464 | 集聚 | |||
| 湖北 | 0.081239 | 集聚 | 0.093935 | 集聚 | 0.293046 | 集聚 | 0.093955 | 集聚 | |||
| 湖南 | 0.090135 | 集聚 | 0.617850 | 集聚 | 0.239166 | 集聚 | 0.598527 | 集聚 | |||
| 吉林 | - | - | 0.023238 | 集聚 | 0.023238 | 集聚 | 0.023238 | 集聚 | |||
| 江苏 | 0.827429 | 集聚 | 1.173908 | 随机 | 1.103383 | 随机 | 0.887295 | 集聚 | |||
| 江西 | - | - | 1.122259 | 随机 | - | - | 0.733159 | 集聚 | |||
| 辽宁 | 0.515762 | 集聚 | 0.445792 | 集聚 | 0.419524 | 集聚 | 0.422665 | 集聚 | |||
| 黑龙江 | 0.704790 | 集聚 | 1.516110 | 集聚 | 1.491839 | 随机 | - | - | |||
| 内蒙古 | - | - | 0.729930 | 集聚 | 1.261714 | 随机 | 1.175138 | 随机 | |||
| 宁夏 | 0.046325 | 集聚 | - | - | - | - | - | - | |||
| 青海 | - | - | - | - | - | - | - | - | |||
| 山东 | 1.084836 | 随机 | 0.657940 | 集聚 | 0.575135 | 集聚 | 1.458280 | 随机 | |||
| 山西 | - | - | 0.011498 | 集聚 | 0.559606 | 集聚 | 0.013151 | 集聚 | |||
| 陕西 | 0.482401 | 集聚 | 0.036247 | 集聚 | 1.176614 | 随机 | 3.823671 | 随机 | |||
| 上海 | 0.218749 | 集聚 | 0.408729 | 集聚 | 0.408729 | 集聚 | 0.595896 | 集聚 | |||
| 四川 | - | - | 0.045921 | 集聚 | 0.118129 | 集聚 | 0.222351 | 集聚 | |||
| 天津 | 0.563608 | 集聚 | 0.563608 | 集聚 | 0.126499 | 集聚 | 0.259113 | 集聚 | |||
| 西藏 | - | - | - | - | - | - | - | - | |||
| 新疆 | 0.859887 | 集聚 | 0.606584 | 集聚 | - | - | - | - | |||
| 云南 | - | - | 0.001187 | 集聚 | 0.001187 | 集聚 | 0.001187 | 集聚 | |||
| 浙江 | 0.806401 | 集聚 | 0.581539 | 集聚 | 0.648595 | 集聚 | 0.580824 | 集聚 | |||
| 重庆 | - | - | 0.083916 | 集聚 | 0.083916 | 集聚 | 0.083228 | 集聚 | |||
| 集聚占比(%) | 88.90 | 84.00 | 66.70 | 73.10 | |||||||
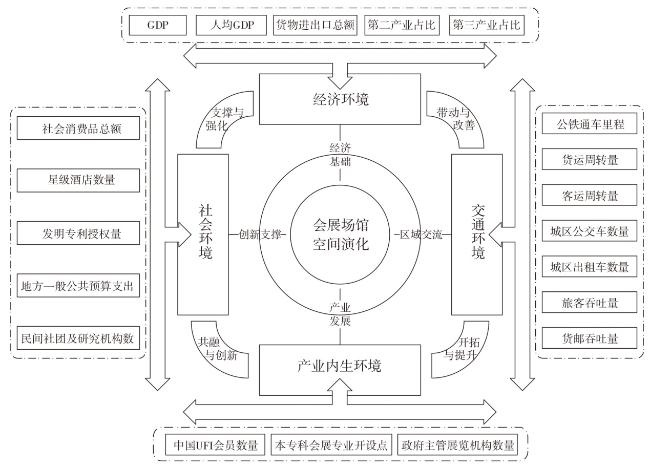
图3 全国会展场馆空间布局演化机理Fig.3 Evolution mechanism of convention and exhibition venues in China |
表3 影响因素探测指标及各影响因素(q值)探测结果Tab.3 Detection indexes of influence factor and detection results of each influence factor (q value) |
| 目标层 | 指标层 | 单位 | 因子 | q值 | |||
|---|---|---|---|---|---|---|---|
| 2012 | 2015 | 2018 | 2021 | ||||
| 经济环境 | GDP | 亿元 | X1 | 0.5475** | 0.7258*** | 0.7206*** | 0.7917*** |
| 人均GDP | 万元 | X2 | 0.5025*** | 0.6225*** | 0.3486 | 0.3777 | |
| 货物进出口总额 | 亿元 | X3 | 0.8639*** | 0.7517*** | 0.5971* | 0.7844*** | |
| 第二产业占比 | % | X4 | 0.0745 | 0.1845 | 0.1484 | 0.2280 | |
| 第三产业占比 | % | X5 | 0.1431 | 0.0606 | 0.1363 | 0.0955 | |
| 社会环境 | 社会消费品总额 | 亿元 | X6 | 0.5623** | 0.7367*** | 0.7282*** | 0.7465*** |
| 星级酒店数量 | 个 | X7 | 0.6137*** | 0.5536*** | 0.5362*** | 0.6319*** | |
| 发明专利授权量 | 个 | X8 | 0.4572** | 0.7395*** | 0.6294*** | 0.7745*** | |
| 地方一般公共预算支出 | 亿元 | X9 | 0.4964** | 0.4738* | 0.5285** | 0.7160*** | |
| 民间社团及研究机构数 | 个 | X10 | 0.7672*** | 0.7804*** | 0.7594*** | 0.8435*** | |
| 产业内生环境 | 中国UFI会员数量 | 个 | X11 | 0.4009 | 0.7793*** | 0.6455** | 0.7005*** |
| 本专科会展专业开设点 | 个 | X12 | 0.3666 | 0.4850 | 0.4537 | 0.4199 | |
| 政府主管展览机构数量 | 个 | X13 | 0.0913 | 0.5830** | 0.6023*** | 0.2787 | |
| 交通环境 | 公铁通车里程 | km | X14 | 0.0511 | 0.0347 | 0.0667 | 0.0378 |
| 货运周转量 | 亿t·km | X15 | 0.3237 | 0.6994*** | 0.5949*** | 0.5633*** | |
| 客运周转量 | 亿人·km | X16 | 0.2307 | 0.3178 | 0.4329* | 0.3660 | |
| 城区公交车数量 | 辆 | X17 | 0.5763* | 0.5846** | 0.6895*** | 0.5817** | |
| 城区出租车数量 | 辆 | X18 | 0.4984*** | 0.4449** | 0.4605** | 0.2880 | |
| 旅客吞吐量 | 万人 | X19 | 0.4065** | 0.3339 | 0.3675 | 0.3921 | |
| 货邮吞吐量 | 万t | X20 | 0.4067** | 0.3932 | 0.2702 | 0.4240 | |
注:***、**、*分别表示在1%、5%、10%水平下显著。 |
| [1] |
任国岩. 长三角会展场馆空间集聚特征及影响因素[J]. 经济地理, 2014, 34(9):86-92.
|
| [2] |
|
| [3] |
|
| [4] |
|
| [5] |
|
| [6] |
|
| [7] |
|
| [8] |
|
| [9] |
|
| [10] |
|
| [11] |
蒋晓晓. 浅析会展与旅游产业融合对城市经济发展的影响与启示[J]. 中国会展, 2024(3):59-61.
|
| [12] |
杨京波. 会展场馆选择标准研究述评——基于会议策划者视角[J]. 旅游学刊, 2013, 28(12):105-115.
|
| [13] |
孙杨, 陈文荟. 会展场馆的空间布局与功能定位研究——以济南市为例[J]. 经营与管理, 2019(10):111-114.
|
| [14] |
徐博, 方向东. 中国会展产业高质量发展的空间格局与动态演进[J]. 中国商论, 2024(9):128-131.
|
| [15] |
方忠权. 广州会展企业空间集聚特征与影响因素[J]. 地理学报, 2013, 68 (4):464-476.
|
| [16] |
严荣, 覃凯璇, 耿松涛. 会展业发展与经济增长关系的时空差异及影响机理——基于海南省的实证研究[J]. 东南大学学报(哲学社会科学版), 2024, 26(3):117-128,152.
|
| [17] |
杨欣, 金李梅. 中国会展业时空分布特征[J]. 经济地理, 2014, 34(8):96-102.
|
| [18] |
王劲峰, 徐成东. 地理探测器:原理与展望[J]. 地理学报, 2017, 72(1):116-134.
|
| [19] |
秦伟山, 赵明明, 张义丰, 等. 中国健康城市建设的时空格局及其调控策略[J]. 地理学报, 2023, 78(11):2883-2902.
|
| [20] |
肖晔, 赵林, 吴殿廷. 中国会展业与会展教育耦合协调度评价及影响因素[J]. 经济地理, 2020, 40(3):119-128.
|
/
| 〈 |
|
〉 |