
Coupling Coordination Relationship Between Gross Ecosystem Product and Economic Development in Important Ecological Functional Areas:A Case Study in the Yellow River Basin
Received date: 2023-04-26
Revised date: 2024-06-17
Online published: 2024-12-18
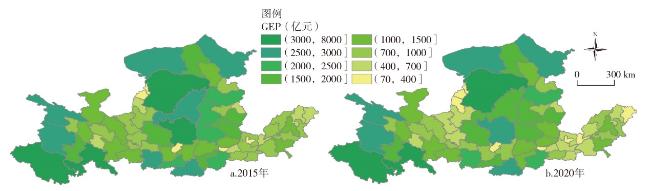
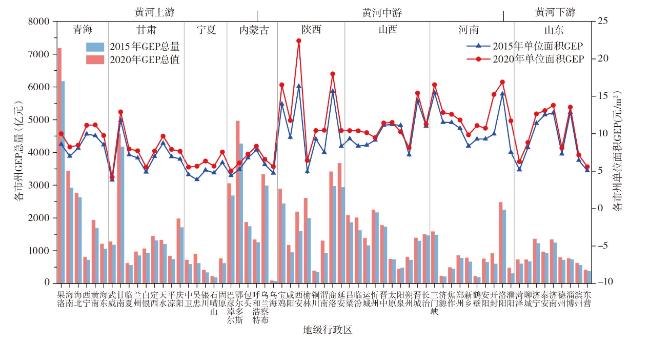
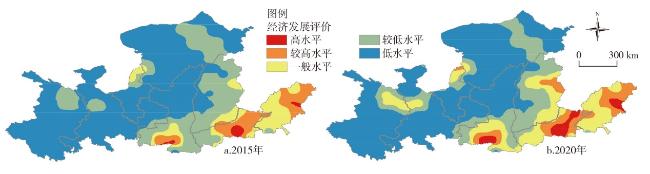
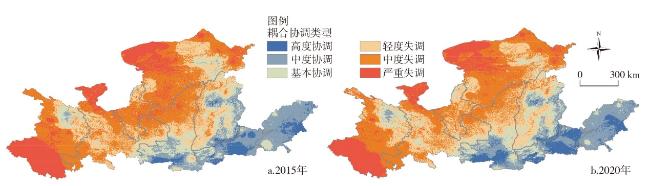
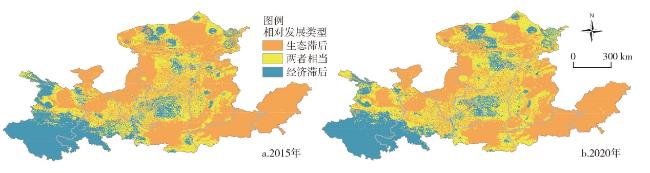
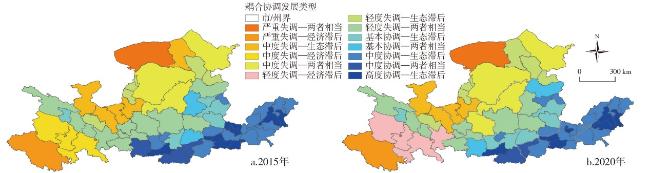
This paper selected 63 prefecture-level cities in the Yellow River Basin as research area and constructed accounting system for the Gross Ecosystem Product (GEP) of Yellow River Basin in 2015 and 2020. It explored the coupling coordination relationship between GEP and regional economic development,and revealed the spatio-temporal evolution characteristics of their coupling coordination relationship at different scales. The results showed that: 1) The total GEP in the Yellow River Basin demonstrated a rapid growth trend,increasing from 9.19 trillion yuan in 2015 to 9.76 trillion yuan in 2020,the growth rate was 6.2%. This growth indicates an improved ecological quality and a significant enhancement in ecological value in the Yellow River Basin. Moreover,there were substantial differences in GEP spatial distribution among different regions,with no significant regularity. From an administrative viewpoint,the western and northern regions exhibited higher total GEP,while the overall GEP in the eastern and southern regions remained relatively low. 2) The overall coupling coordination degree between GEP and regional economic development in the Yellow River Basin displayed a natural transition and gradual change,with higher levels in the east of the Yellow River Basin and lower levels in the west of the Yellow River Basin. The spatial characteristics of relative development showcased a gradual increase from the west of the Yellow River Basin to the east of the Yellow River Basin,indicating that the comprehensive development capacity in the east of the Yellow River Basin surpassed that in the west of the Yellow River Basin thereby reflecting a stronger ability to coordinate ecological and economic development. 3) From the perspective of the coupling coordination development changes in cities of the Yellow River Basin,the differences between regions are obvious,it showed the overall characteristics of the transformation from unbalanced development to coordinated development,from the double lag of economy and ecology to the mutual development,indicating that it was gradually moving toward a path of ecological and economic coordination and sustainable development in the Yellow River Basin. It shows that China's implementation of the Yellow River Basin ecological protection and high-quality development strategy has achieved phased results. In the future,government should adhere to the principle of ecological priority and green development,strengthen the regular monitoring of the coupling coordination development of ecological environment and social economy,and apply local policies to effectively promote the ecological protection and high-quality development of the Yellow River Basin.
WEI Wei , YUAN Zaiwu , WEI Xiaoxu , DOU Haomin , XIONG Jinkun . Coupling Coordination Relationship Between Gross Ecosystem Product and Economic Development in Important Ecological Functional Areas:A Case Study in the Yellow River Basin[J]. Economic geography, 2024 , 44(11) : 161 -172 . DOI: 10.15957/j.cnki.jjdl.2024.11.017
表1 数据类型与来源说明Tab.1 Data type and source description |
| 数据名称 | 分辨率(m) | 数据来源 |
|---|---|---|
| 行政区划 | - | 国家基础地理信息中心(http://www.ngcc.cn/ngcc/http://www.ngcc.cn/ngcc/) |
| DEM | 30 | 地理空间数据云(https://www.gscloud.cn/https://www.gscloud.cn/) |
| 土地利用 | 1000 | 中国科学院资源环境科学与数据中心(https://www.resdc.cn/https://www.resdc.cn/) |
| 降水量数据 | 1000 | 国家地球系统科学数据中心共享服务平台(http://www.geodata.cn/http://www.geodata.cn/) |
| 降雨侵蚀力 | 1000 | 北京师范大学地理数据与应用分析中心(https://gda.bnu.edu.cn/) |
| 气象数据 | 站点 | 国家气象数据中心(http://data.cma.cn/) |
| 土壤数据 | 1000 | 中国土壤数据库(http://vdb3.soil.csdb.cn/) |
| 植被指数NDVI | 1000 | 中国科学院资源环境科学与数据中心(https://www.resdc.cn/https://www.resdc.cn/) |
| 净初级生产力NPP | 500 | 美国地质勘探局USGS(https://www.usgs.gov/) |
| 蒸散发 | 1000 | 国家地球系统科学数据中心共享服务平台(http://www.geodata.cn/http://www.geodata.cn/) |
| 统计数据 | - | 各省、市、州统计年鉴,水资源公报,社会发展公报等 |
表2 GEP核算指标体系及方法说明Tab.2 GEP accounting indicator system and method description |
| 核算项目 | 功能指标 | 评估方法 | 功能量、价值量评估 |
|---|---|---|---|
| 供给服务 | 水资源、 农林牧渔 | 市场价值法 | 式中:Vwr为产品供给价值(元/a);Qfi为物质产品产量(kg/a);Qi为第i种物质产品产量(kg/a);Ui为第i种物质产品单价(元/kg) |
| 调节服务 | 水土保持 | 替代成本法、 RUSLE | 式中:Vsd是水土保持服务总价值(元);λ为泥沙淤积系数,取24%[18];Qsr为水土保持量[t/(hm2·a)];ρ为土壤容重(t/m3);Urd为水库清淤成本(元/m3);SRP为潜在土壤侵蚀量[t/(hm2·a)];SRA为实际土壤侵蚀量[t/(hm2·a)];R为降雨侵蚀力因子[MJ·mm/(hm2·h)];K为土壤可侵蚀因子[t·h/(MJ·mm)];LS为地形因子(无量纲);C为植被覆盖因子(无量纲);P为水土保持措施因子(无量纲) |
| 水源涵养 | 影子工程法、水量平衡方程 | 式中:Vwc是水源涵养服务总价值(元);Qwc是水源涵养功能总(m3);Urc表示水库建设单位库容投资(元/m3);i表示生态系统;j表示生态系统个数;Si表示年地表径流量(mm);Ri表示降雨量(mm);ETi表示蒸散量(mm);Areai表示第i类生态系统(农田、森林、草地、灌丛、湿地、河流湖泊、城乡聚落和荒漠)面积(km2);α表示平均径流系数 | |
| 固碳释氧 | 造林成本法、 工业制氧法 | 式中:Vco为固碳释氧总价值(元);Qwc为固碳释氧总的功能量(t);Si为研究区第i类生态系统类型的面积(hm2);NPPi为第i类生态类型的NPP;Uc为市场造林固碳成本价格(t/元);Uo为市场制造O2价格(t/元) | |
| 气候调节 | 替代成本法、蒸散模型 | 式中:Vcr为气候调节总价值量(元);Qcr为气候调节总功能(kW·h);Ucr为气候调节的价格系数,取63个地级及以上行政区电价的平均值(元/kW·h);Ewr为水面蒸发的水量(m3);Ewk为水面蒸发所吸收的热量(kJ/kg),取在1个标准大气压下,100℃水温环境下的汽化热(2260 kJ/kg)[1];β是加湿器将1 m3水转化为蒸汽的耗电量(kW∙h),取值为125 kW·h[9];GPPi表示不同类型的生态系统单位面积在单位时间内蒸腾所消耗的热量,分别为2837.27、1300.95和969.83 kJ/(m2·d)[18];Areai为不同生态系统(农田、森林、草地、灌丛、湿地、河流湖泊、城乡聚落和荒漠)的面积(m2);d为每年空调开放天数,取值为日均温度大于26℃的天数;α为空调能效比,值取为3.08[18] | |
| 文化服务 | 景观旅游 | 式中: 为文化服务价值(万元);Vt是各市州旅游收入(万元); 是第i种用生态系统旅游文化价值占旅游总收入比值(%),依据《入境游客抽样调查综合分析报告》中的数据,取自然景观旅游在研究区总旅游收入中的比例(24.6%)[18] |
表3 区域经济发展指标体系及说明Tab.3 Index system of regional economic development |
| 准则层 | 经济指标名称 | 单位 | 属性 | 权重 |
|---|---|---|---|---|
| 经济规模 (0.525) | GDP | 亿元 | 正向 | 0.113 |
| 社会固定资产投资额 | 亿元 | 正向 | 0.128 | |
| 地方财政收入 | 亿元 | 正向 | 0.134 | |
| 进出口总额 | 亿美元 | 正向 | 0.163 | |
| 经济质效 (0.340) | 人均GDP | 元/人 | 正向 | 0.121 |
| 城镇居民人均年可支配收入 | 元/人 | 正向 | 0.031 | |
| 农村居民人均年可支配收入 | 元/人 | 正向 | 0.093 | |
| 人均社会消费品零售总额 | 元/人 | 正向 | 0.115 | |
| 经济结构 (0.135) | 第二产业占GDP比重 | % | 正向 | 0.054 |
| 第三产业占GDP比重 | % | 正向 | 0.081 |
表4 GEP与经济发展的耦合协调发展类型及划分标准Tab.4 Coupling coordination development types and classification standards between GEP and economic development |
| 耦合协调度 | 相对发展度 | 耦合协调类型 | 耦合协调发展特征 |
|---|---|---|---|
| 0<D≤0.2 | 0<E≤2 | 严重失调 | 严重失调—生态滞后 |
| 2<E≤4 | 严重失调—两者相当 | ||
| E>4 | 严重失调—经济滞后 | ||
| 0.2<D≤0.3 | 0<E≤2 | 中度失调 | 中度失调—生态滞后 |
| 2<E≤4 | 中度失调—两者相当 | ||
| E>4 | 中度失调—经济滞后 | ||
| 0.3<D≤0.4 | 0<E≤2 | 轻度失调 | 轻度失调—生态滞后 |
| 2<E≤4 | 轻度失调—两者相当 | ||
| E>4 | 轻度失调—经济滞后 | ||
| 0.4<D≤0.5 | 0<E≤2 | 基本协调 | 基本协调—生态滞后 |
| 2<E≤4 | 基本协调—两者相当 | ||
| E>4 | 基本协调—经济滞后 | ||
| 0.5<D≤0.6 | 0<E≤2 | 中度协调 | 中度协调—生态滞后 |
| 2<E≤4 | 中度协调—两者相当 | ||
| E>4 | 中度协调—经济滞后 | ||
| 0.6<D≤1.0 | 0<E≤2 | 高度协调 | 高度协调—生态滞后 |
| 2<E≤4 | 高度协调—两者相当 | ||
| E>4 | 高度协调—经济滞后 |
表5 2015和2020年黄河流域GEP核算结果Tab.5 GEP accounting results of the Yellow River Basin in 2015 and 2020 |
| 2015年 | 2020年 | 变化率(%) | ||||
|---|---|---|---|---|---|---|
| GEP(亿元) | 比例(%) | GEP(亿元) | 比例(%) | |||
| 农林牧渔 | 13852.33 | 15.05 | 17151.02 | 17.56 | 22.63 | |
| 水资源 | 606.41 | 0.65 | 579.73 | 0.59 | -4.39 | |
| 水土保持 | 8127.81 | 8.84 | 4132.63 | 4.23 | -49.15 | |
| 水源涵养 | 11936.71 | 12.98 | 15843.55 | 16.22 | 32.72 | |
| 固碳释氧 | 4080.67 | 4.44 | 4393.98 | 4.50 | 7.67 | |
| 气候调节 | 50003.04 | 54.36 | 51738.11 | 52.97 | 3.46 | |
| 文化服务 | 3383.34 | 3.68 | 3833.79 | 3.93 | 13.31 | |
| 合计 | 91990.31 | 97672.81 | 6.17 | |||
图1 2015和2020年黄河流域各市州GEP空间分布Fig.1 Spatial distribution of GEP in prefecture-level cities of Yellow River Basin in 2015 and 2020 |
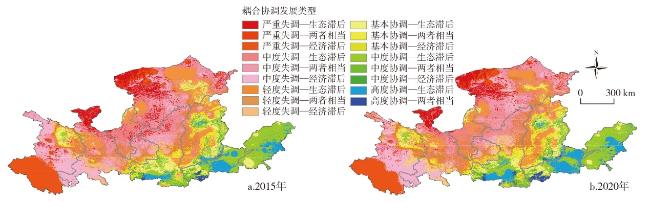
图4 2015和2020年黄河流域耦合协调类型空间分布Fig.4 Spatial distribution of coupling coordination type in the Yellow River Basin in 2015 and 2020 |
表6 2015和2020年黄河流域耦合协调类型面积及占比Tab.6 Area and proportion of coupling coordination types in the Yellow River Basin in 2015 and 2020 |
| 类型 | 2015年 | 2020年 | 变化率 (%) | |||
|---|---|---|---|---|---|---|
| 面积(万km2) | 比例(%) | 面积(万km2) | 比例(%) | |||
| 严重失调 | 18.11 | 16.14 | 15.22 | 13.56 | -15.96 | |
| 中度失调 | 37.82 | 33.70 | 36.32 | 32.37 | -3.97 | |
| 轻度失调 | 22.06 | 19.66 | 24.92 | 22.21 | 12.96 | |
| 基本协调 | 13.43 | 11.97 | 13.45 | 11.99 | 0.15 | |
| 中度协调 | 15.78 | 14.07 | 15.08 | 13.44 | -4.44 | |
| 高度协调 | 5.01 | 4.46 | 7.21 | 6.43 | 43.91 | |
表7 2015和2020年黄河流域相对发展类型面积及占比Tab.7 Area and proportion of relative development type in the Yellow River Basin in 2015 and 2020 |
| 类型 | 2015年 | 2020年 | 变化率 (%) | |||
|---|---|---|---|---|---|---|
| 面积(万km2) | 比例(%) | 面积(万km2) | 比例(%) | |||
| 生态滞后 | 57.86 | 51.56 | 51.15 | 45.58 | -11.60 | |
| 两者相当 | 28.61 | 25.50 | 38.05 | 33.92 | 32.99 | |
| 经济滞后 | 25.74 | 22.94 | 23.01 | 20.50 | -10.61 | |
| [1] |
白杨, 李晖, 王晓媛, 等. 云南省生态资产与生态系统生产总值核算体系研究[J]. 自然资源学报, 2017, 32(7):1100-1112.
|
| [2] |
|
| [3] |
|
| [4] |
欧阳志云, 朱春全, 杨广斌, 等. 生态系统生产总值核算:概念、核算方法与案例研究[J]. 生态学报, 2013, 33(21):6747-6761.
|
| [5] |
胡洵瑀. 新时代生态系统生产总值核算:评《生态系统生产总值(GEP)核算理论与方法》[J]. 湿地科学与管理, 2022, 18(1):73.
|
| [6] |
|
| [7] |
宋昌素, 欧阳志云. 生态产品总值(GEP)理论内涵与应用实践[J]. 人民论坛·学术前沿, 2023(18):92-95.
|
| [8] |
|
| [9] |
韩增林, 赵玉青, 闫晓露, 等. 生态系统生产总值与区域经济耦合协调机制及协同发展——以大连市为例[J]. 经济地理, 2020, 40(10):1-10.
|
| [10] |
白玛卓嘎, 肖娥, 欧阳志云, 等. 基于生态系统生产总值核算的习水县生态保护成效评估[J]. 生态学报, 2020, 40(2):499-509.
|
| [11] |
尹岩, 郗凤明, 王娇月, 等. 生态系统价值在政策制度设计中的应用——以福州市为例[J]. 应用生态学报, 2021, 32(11):3815-3823.
|
| [12] |
|
| [13] |
沈钰仟, 杜傲, 林子雁, 等. 赣州市山水林田湖草修复工程生态保护效益[J]. 生态学报, 2023, 43(2):650-659.
|
| [14] |
陈默, 林育青, 张建云, 等. 水生态系统生产总值核算体系及应用[J]. 水资源保护, 2023, 39(1):234-242.
|
| [15] |
王克达, 魏斌, 常璐, 等. 福州市森林生态系统生产总值(GEP)评估[J]. 沈阳农业大学学报, 2022, 53(6):759-767.
|
| [16] |
|
| [17] |
|
| [18] |
林瑒焱, 徐昔保. 长三角地区生态系统生产总值时空变化及重要生态保护空间识别[J]. 资源科学, 2022, 44(4):847-859.
|
| [19] |
吴之见, 杜思敏, 黄云, 等. 基于生态系统生产总值核算的生态保护成效评估——以赣南地区为例[J]. 生态学报, 2022, 42(16):6670-6683.
|
| [20] |
|
| [21] |
张籍, 邹梓颖. 雅鲁藏布江流域生态产品总值(GEP)核算及其应用研究[J]. 生态经济, 2022, 38(10):167-172,227.
|
| [22] |
刘玉, 翟晓燕, 张永勇, 等. 基于水循环模拟的水生态产品价值量核算——以黄河上游湟水河流域为例[J]. 地理科学进展, 2023, 42(9):1704-1716.
|
| [23] |
|
| [24] |
|
| [25] |
|
| [26] |
韩叙, 柳潇明, 刘文婷, 等. 黄河流域绿色金融与经济高质量发展耦合协调时空特征及驱动因素[J]. 经济地理, 2023, 43(9):121-130.
|
| [27] |
董书霞, 郭素婷, 杨雯宇. 基于生态系统服务价值的黄河流域生态与能源—经济—环境耦合协调发展研究[J]. 科学与管理, 2024, 44(1):48-56,74.
|
| [28] |
陈昊, 巩芳, 陈都兰. 草原生态系统服务价值与牧区居民生态福祉耦合协调关系及其异质性研究[J]. 草业学报, 2023, 32(11):1-16.
|
| [29] |
|
| [30] |
|
| [31] |
王奕淇, 李国平. 基于SD模型的黄河流域生态环境与社会经济发展可持续性模拟[J]. 干旱区地理, 2022, 45(3):901-911.
|
| [32] |
刘家旗, 茹少峰. 基于生态足迹理论的黄河流域可持续发展研究[J]. 改革, 2020(9):139-148.
|
| [33] |
|
| [34] |
|
| [35] |
贾洪文, 樊树钢. 黄河流域绿色金融与经济高质量发展耦合协调研究[J]. 生态经济, 2023, 39(10):89-98.
|
| [36] |
周成, 冯学钢, 唐睿. 区域经济—生态环境—旅游产业耦合协调发展分析与预测——以长江经济带沿线各省市为例[J]. 经济地理, 2016, 36(3):186-193.
|
| [37] |
孙剑锋, 李世泰, 纪晓萌, 等. 山东省文化资源与旅游产业协调发展评价与优化[J]. 经济地理, 2019, 39(8):207-215.
|
| [38] |
李鸿飞, 何颖茹, 毕晓莉. 黄河流域兰州段生态环境与高质量发展耦合协调关系研究[J]. 干旱区地理, 2022, 45(4):1244-1253.
|
| [39] |
|
/
| 〈 |
|
〉 |