
The Carbon Emission Effect of the Belt and Road Initiative on Cities along the Domestic Route
Received date: 2023-09-27
Revised date: 2024-06-27
Online published: 2024-11-29
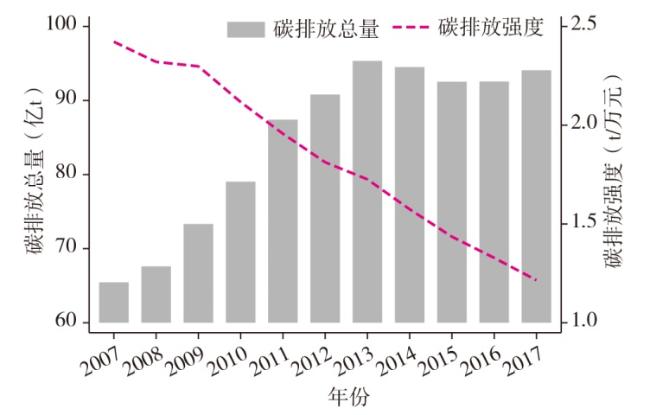
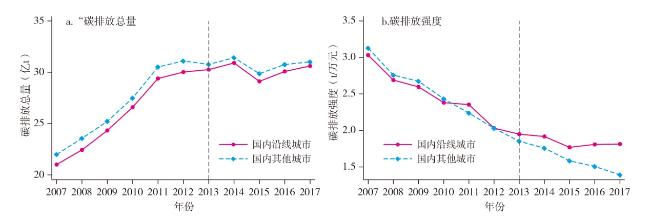
Promoting the high-quality development of the Belt and Road Initiative is one of the important measures to achieve high-level opening up and build a new development pattern. Scientific assessment of the environmental effect of the Belt and Road Initiative is of great significance to promote the high-quality development of the Belt and Road Initiative. This paper uses the difference-in-differences method to test the effect and mechanism of the Belt and Road Initiative on carbon intensity of cities along the route in China from 2007 to 2017. The results are as follows: 1) The Belt and Road Initiative has significantly increased the carbon emission intensity of cities along the route in China. 2) Mechanism test reveals that the Belt and Road Initiative mainly elevates the carbon emission intensity of domestic cities along the route by promoting the carbon-intensive exports and distorting the industrial structure. 3) Heterogeneity analysis shows that the increase in carbon emissions resulting from participation in the Belt and Road Initiative mainly occurs in eastern cities,central cities, and non-resource-based cities in China. As the largest producer and exporter of goods along the Belt and Road,China is under certain carbon emission pressures while meeting the needs of other countries along the Belt and Road.
CHEN Liang , GAO Haoyu , HUANG Rongrong . The Carbon Emission Effect of the Belt and Road Initiative on Cities along the Domestic Route[J]. Economic geography, 2024 , 44(10) : 185 -193 . DOI: 10.15957/j.cnki.jjdl.2024.10.019
表1 双重差分模型的基准回归结果Tab.1 Baseline regression results of the difference-in-differences model |
| 变量 | (1) | (2) | (3) | (4) | (5) | (6) |
|---|---|---|---|---|---|---|
| Treat·Post | 0.1693***(0.023) | 0.1510***(0.023) | 0.1511***(0.023) | 0.1454***(0.023) | 0.1513***(0.022) | 0.1497***(0.022) |
| PerGDP | -0.3860***(0.063) | -0.3857***(0.063) | -0.3182***(0.064) | -0.3127***(0.064) | -0.3166***(0.065) | |
| Openness | -0.0002(0.000) | -0.0060***(0.001) | -0.0064***(0.001) | -0.0062***(0.001) | ||
| Gov | 0.2254***(0.054) | 0.2399***(0.055) | 0.2300***(0.055) | |||
| Pop | 0.8774***(0.170) | 0.8492***(0.172) | ||||
| Inf | -0.0184(0.023) | |||||
| Constant | 2.3444***(0.009) | 6.3628***(0.651) | 6.3591***(0.651) | 3.9955***(0.853) | -1.3286(1.418) | -1.0346(1.442) |
| 城市固定效应 | 是 | 是 | 是 | 是 | 是 | 是 |
| 年份固定效应 | 是 | 是 | 是 | 是 | 是 | 是 |
| 调整后R2 | 0.954 | 0.955 | 0.955 | 0.956 | 0.956 | 0.956 |
| 样本量(个) | 3113 | 3113 | 3113 | 3113 | 3113 | 3091 |
表2 稳健性检验:排除其他政策干扰Tab.2 Robustness tests (excluding the effect of other policies) |
| (1) 科技与金融结合 | (2) 国家创新型城市 | (3) 低碳城市 | (4) 同时考虑三种政策 | |
|---|---|---|---|---|
| Treat·Post | 0.1452***(0.023) | 0.1586***(0.023) | 0.1519***(0.022) | 0.1600***(0.023) |
| 控制变量 | 是 | 是 | 是 | 是 |
| 城市固定效应 | 是 | 是 | 是 | 是 |
| 年份固定效应 | 是 | 是 | 是 | 是 |
| 调整后R2 | 0.960 | 0.960 | 0.961 | 0.961 |
| 样本量(个) | 3091 | 3091 | 3091 | 3091 |
表3 机制检验:出口碳密集化Tab.3 Mechanism tests (promoting carbon-intensive exports) |
| (1) | (2) | (3) | |||
|---|---|---|---|---|---|
| 碳密集型 出口占比 | 碳密集型出口占比_“一带一路” 经济体 | 碳密集型出口占比_非“一带一路”经济体 | |||
| Treat·Post | 0.0159*(0.009) | 0.0268** (0.011) | 0.0137 (0.009) | ||
| 控制变量 | 是 | 是 | 是 | ||
| 企业固定效应 | - | - | - | ||
| 城市固定效应 | 是 | 是 | 是 | ||
| 年份固定效应 | 是 | 是 | 是 | ||
| 调整后R2 | 0.786 | 0.738 | 0.760 | ||
| 样本量(个) | 2628 | 2617 | 2626 |
表4 机制检验:产业结构扭曲Tab.4 Mechanism tests (the distortion of industrial structure) |
| (1) | (2) | (3) | (4) | |
|---|---|---|---|---|
| 产业结构 层次指数 | 工业用电 占比 | 企业 进入 | 企业 退出 | |
| Treat·Post | -1.7936***(0.205) | 0.0306***(0.007) | 0.0440***(0.016) | -0.0542**(0.022) |
| 控制变量 | 是 | 是 | 是 | 是 |
| 城市固定效应 | 是 | 是 | 是 | 是 |
| 年份固定效应 | 是 | 是 | 是 | 是 |
| 企业固定效应 | - | - | 是 | 是 |
| 调整后R2 | 0.956 | 0.766 | 0.386 | 0.156 |
| 样本量(个) | 3091 | 2736 | 2214419 | 2214419 |
表5 异质性分析Tab.5 Heterogeneity test results |
| (1) | (2) | (3) | (4) | (5) | (6) | |
|---|---|---|---|---|---|---|
| 东部城市 | 中西部城市 | 中心城市 | 非中心城市 | 资源型城市 | 非资源型城市 | |
| Treat·Post | 0.1266**(0.060) | 0.0779(0.084) | 0.2193***(0.071) | 0.0780(0.071) | 0.1037(0.101) | 0.1513***(0.055) |
| 控制变量 | 是 | 是 | 是 | 是 | 是 | 是 |
| 城市固定效应 | 是 | 是 | 是 | 是 | 是 | 是 |
| 年份固定效应 | 是 | 是 | 是 | 是 | 是 | 是 |
| 调整后R2 | 0.970 | 0.952 | 0.959 | 0.959 | 0.954 | 0.966 |
| 样本量(个) | 907 | 1855 | 1056 | 2035 | 1217 | 1874 |
| [1] |
|
| [2] |
|
| [3] |
姚秋蕙, 韩梦瑶, 刘卫东. “一带一路”沿线地区隐含碳流动研究[J]. 地理学报, 2018, 73(11):2210-2222.
|
| [4] |
孟凡鑫, 苏美蓉, 胡元超, 等. 中国及“一带一路”沿线典型国家贸易隐含碳转移研究[J]. 中国人口·资源与环境, 2019, 29(4):18-26.
|
| [5] |
岳立, 杨玉春. “一带一路”沿线国家绿色全要素能源效率的时空分异研究——基于超效率DEA模型和GML指数法[J]. 经济问题探索, 2019(6):111-119.
|
| [6] |
刘乃全, 戴晋. 我国对“一带一路”沿线国家OFDI的环境效应[J]. 经济管理, 2017, 39(12):6-23.
|
| [7] |
协天紫光, 薛飞, 葛鹏飞. 中国对外直接投资对“一带一路”沿线国家绿色全要素生产率的影响[J]. 上海财经大学学报, 2019, 21(6):96-110.
|
| [8] |
曹翔滕, 聪波, 张继军. “一带一路”倡议对沿线国家环境质量的影响[J] .中国人口·资源与环境, 2020, 30(12):116-124.
|
| [9] |
昌敦虎, 缪琪, 原佳倩, 等. “一带一路”沿线国家碳排放:外商直接投资与发展要素的共同影响分析[J]. 环境科学研究, 2022, 35(7):1556-1563.
|
| [10] |
武汉大学国家发展战略研究院课题组. 中国实施绿色低碳转型和实现碳中和目标的路径选择[J]. 中国软科学, 2022(10):1-12.
|
| [11] |
汪克亮, 庞素勤. “一带一路”倡议实施对中国沿线城市绿色转型的影响[J]. 资源科学, 2021, 43(12):2475-2489.
|
| [12] |
余东升, 李小平, 李慧. “一带一路”倡议能否降低城市环境污染?——来自准自然实验的证据[J]. 统计研究, 2021, 38(6):44-56.
|
| [13] |
|
| [14] |
|
| [15] |
|
| [16] |
苑希, 孟寒, 祁欣. 共建“一带一路”十周年:成就、经验与展望[J]. 国际贸易, 2023(4):69-80.
|
| [17] |
陈衍泰, 吴哲, 范彦成, 等. 新兴经济体国家工业化水平测度的实证分析[J]. 科研管理, 2017, 38(3):77-85.
|
| [18] |
汪海建, 薛云燕, 周绍杰. “去产能”政策是否提高公司绩效——基于制造业上市公司的实证研究[J]. 经济理论与经济管理, 2022, 42(1):51-66.
|
| [19] |
郭士伊, 刘文强, 赵卫东. 调整产业结构降低碳排放强度的国际比较及经验启示[J]. 中国工程科学, 2021, 23(6):22-32.
|
| [20] |
沈小波, 陈语, 林伯强. 技术进步和产业结构扭曲对中国能源强度的影响[J]. 经济研究, 2021, 56(2):157-173.
|
| [21] |
徐思, 何晓怡, 钟凯. “一带一路”倡议与中国企业融资约束[J]. 中国工业经济, 2019(7):155-173.
|
| [22] |
徐思, 潘昕彤, 林晚发. “一带一路”倡议与公司债信用利差[J]. 金融研究, 2022(2):135-152.
|
| [23] |
|
| [24] |
吕越, 陆毅, 吴嵩博, 等. “一带一路”倡议的对外投资促进效应——基于2005—2016年中国企业绿地投资的双重差分检验[J]. 经济研究, 2019, 54(9):187-202.
|
| [25] |
|
| [26] |
宋洋, 贺灿飞,
|
| [27] |
毛其淋, 盛斌. 中国制造业企业的进入退出与生产率动态演化[J]. 经济研究, 2013, 48(4):16-29.
|
| [28] |
李虹, 邹庆. 环境规制、资源禀赋与城市产业转型研究——基于资源型城市与非资源型城市的对比分析[J]. 经济研究, 2018, 53(11):182-198.
|
/
| 〈 |
|
〉 |